
記住我


Chronic low back pain (CLBP) is the leading cause of years lived with disability, and a global burden both in the developed and developing countries.13 Although CLBP is very common, approximately 90% of individuals with CLBP cannot identify a clear specific cause or origin of the pain.22 The concept of nociplastic pain was recently proposed, in which augmented pain and sensory processing and altered pain modulation in the central nervous system are thought to play prominent roles.7,11,23 Chronic low back pain is considered one of the most common nociplastic pain syndromes,11 and thus, alterations in the central nervous system may play an important role in the course of CLBP.
There is growing evidence that CLBP is significantly associated with alterations in brain structure and function. Several hospital-based studies have shown that individuals with CLBP have lower brain volumes in pain-related brain regions than those without.1,5,20,34,43 However, the generalizability of these findings may be limited because most of these studies were case–control studies with a small sample size of less than 100 participants and only compared patients with severe CLBP and healthy controls. Conversely, a limited number of population-based studies with relatively large sample sizes have examined the association between CLBP and brain volume in general populations, including people with CLBP of different degrees of severity from mild to severe, and the findings have been inconsistent.8,12
The present study sought to investigate the association between CLBP and regional brain atrophy using brain magnetic resonance imaging (MRI) data from more than 1000 older people living in a community in Japan.
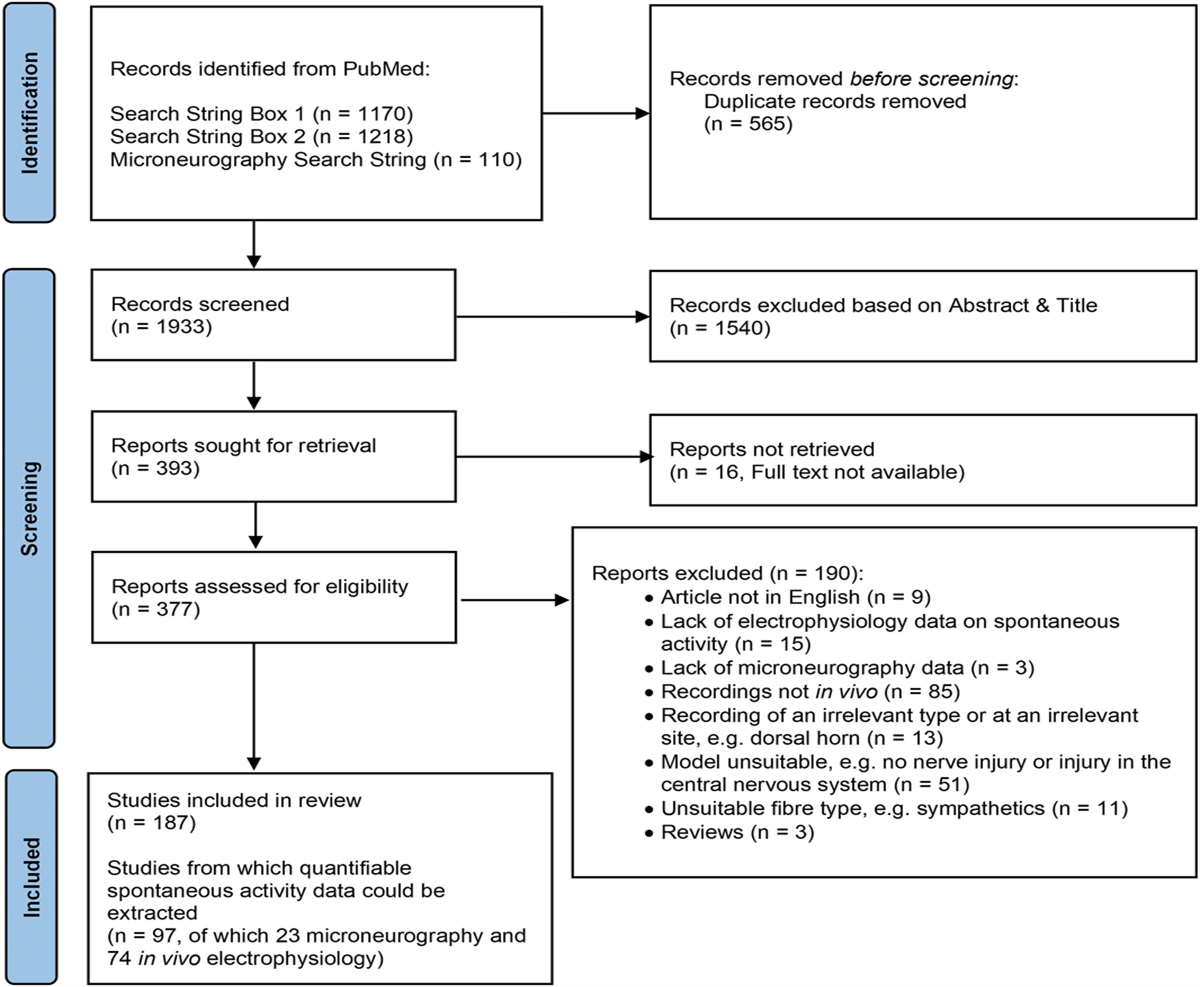
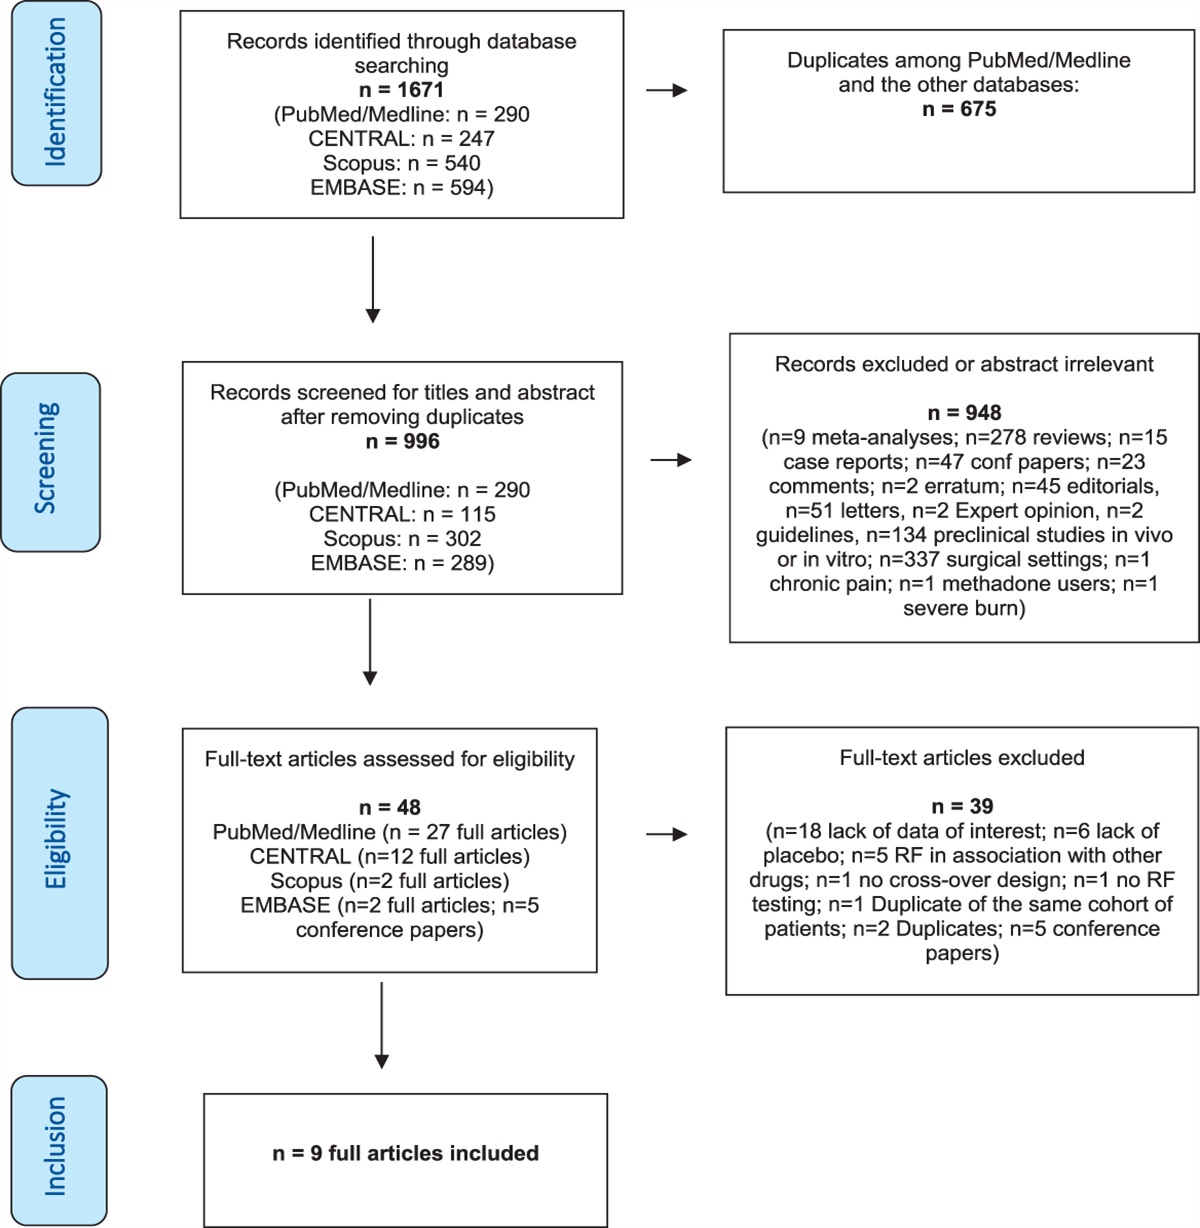
2. Methods 2.1. Study design and participantsThe Hisayama Study is an ongoing population-based cohort study of cerebrocardiovascular disease in the town of Hisayama, which is a metropolitan area of Fukuoka City in Japan. In addition to annual health examination, for residents aged 65 years or older, comprehensive screening surveys of dementia and activities of daily living (ADL) have been conducted every 5 to 7 years since 1985. The detailed design of the study has been described elsewhere.25,26 In 2017 and 2018, a total of 2202 residents aged ≥65 years (94.1% of the town's total population in this age group) participated in the screening surveys of dementia; of whom, 1577 participants (71.6%) underwent brain MRI scans. Among these 1577 participants, we excluded the following from the present analysis: 7 individuals who did not provide consent to use the MRI data, 49 individuals whose brain MRI data were inappropriate for the FreeSurfer analysis in the visual check by the study team (7 with artifacts, 17 with skull stripping error, 9 with trace error, 8 with brain infarction, 1 with brain hemorrhage, 1 with chronic subdural hematoma, 1 with brain tumor, and 5 with any errors in the evaluation process of the regional brain volumes using the FreeSurfer software for the imaging analysis), 130 with history of dementia, and 285 without available data for chronic pain. The remaining 1106 individuals (491 men and 615 women) were included in the present study (Fig. 1). This study was approved by the Kyushu University Institutional Review Board for Clinical Research, and written informed consent was obtained from all the participants.
 Figure 1.:
 Selection process of the examined population. MRI, magnetic resonance imaging.
2.2. Assessment of chronic low back pain and pain-related measurementParticipants were asked the following questions using a questionnaire: “Do you have any pain on your body?” “Is the pain present for more than 3 months?” and “What part of your body mainly suffers from pain: your head, face, neck, shoulders, arms, chest, back, abdomen, low back, knees, feet, pelvic, buttocks, genital area, tongue, teeth, entire body or some other part?” They were also asked about average pain intensity over the previous week using a visual analog scale (VAS).15 Chronic pain was defined as having any subjective pain for more than 3 months according to the International Association for the Study of Pain (IASP) definition.41 Participants were classified into 3 groups based on the information on the questionnaire about the presence or absence of chronic pain and of the body part that mainly suffered from pain, as follows: a “no chronic pain (NCP)” group, a “CLBP” group, and a “chronic pain in body parts other than the lower back (OCP)” group.
2.3. Assessment of regional brain volumeMagnetic resonance imaging examinations included T1-weighted, 3-dimensional, magnetization-prepared, rapid gradient echo images, conventional T1- and T2-weighted images, fluid-attenuated inversion recovery (FLAIR) images, T2*-weighted images, and magnetic resonance angiography of the brain. They were performed using a 1.5-Tesla MRI scanner (Intera Pulsar; Philips Medical Systems, Best, the Netherlands) with a multichannel head coil. T1-weighted 3-dimensional images acquired in the sagittal plane with the following parameters were used to determine regional brain atrophy: repetition time 8.5 milliseconds, echo time 4.0 milliseconds, inversion time 1000 milliseconds, flip angle 8°, a field of view 240 mm, acquisition matrix 192 × 192, slice thickness 1.2 mm, number of excitations 1. The segmentation and volume measurements of cortical and subcortical brain structures, and intracranial volume (ICV) were performed automatically using the FreeSurfer software (version 6.0.0; Harvard University, Boston, MA [http://surfer.nmr.mgh.harvard.edu]). The cortical parcellation was performed using a Desikan–Killiany atlas.9 All FreeSurfer automated segmentation results were visually checked for accuracy by the study team. Six study members, including an expert stroke neurologist and an expert psychiatrist, double-checked whether the cortex was correctly segmented by FreeSurfer according to the Enhancing Neuro Imaging Genetics through Meta Analysis (ENIGMA) Cortical Quality Control Protocol 2.0.10 Among the cases identified as having inaccurate segmentation by at least 1 member, skull and dura matter misclassifications were corrected by command and reanalyzed. Reanalyzed images were double-checked again by the study members to determine whether they were appropriate for the present analysis.
As the brain regions of interest in the present analysis, we selected the following pain-related brain regions based on a previous study, in which the examined brain regions were determined by a systematic search of the literature8: (1) ventrolateral prefrontal cortex, (2) dorsolateral prefrontal cortex, (3) orbitofrontal cortex, (4) postcentral gyrus, (5) insular cortex, (6) thalamus, (7) anterior cingulate cortex, (8) posterior cingulate cortex, (9) amygdala, and (10) hippocampus. In addition to the aforementioned 10 regions, we also examined the striatal brain regions (ie, the caudate nucleus, putamen, pallidum, and nucleus accumbens) and memory-related regions (ie, the entorhinal cortex and parahippocampal gyrus). The former have been reported to be associated with CLBP,2 whereas the latter are known to be associated with early cognitive dysfunction.28 To adjust for head size, regional brain volume was calculated as a percentage of ICV as follows: ([left + right] regional brain volume/ICV) × 100 (%). Because there was no evidence of heterogeneity between the association of chronic pain status with the left and right regional brain volume (all P for heterogeneity > 0.40), we analyzed each regional brain volume as the sum of the left and right values.
2.4. Other covariatesEach participant answered a self-administered questionnaire and was checked by trained interviewers. The questionnaire included the information of medical history, medications for hypertension and diabetes, educational level, marital status, subjective economic status, current smoking, current drinking, regular exercise, ADL, and depressive symptoms. Low education level was defined as 9 years or less of formal education. Marital status was categorized into 2 groups: with or without a partner. Subjective economic status was assessed by the following question: “How do you feel about the economic status of your household?” Participants were asked to choose among 6 responses: high, rather high, neither high nor low, rather low, low, or unknown; participants who answered “low” or “rather low” were defined as having low subjective economic status.6 Regular exercise was defined as engaging in physical exercise 3 or more times a week during leisure time. Activities of daily living disability was defined as a Barthel Index of ≤95.36,40 Depressive symptoms were assessed by the 15-item Geriatric Depression Scale (GDS), and a participant who had a GDS score of ≥6 was defined as having depressive symptoms.16 Body height and weight were measured in light clothing without shoes, and body mass index (BMI) was calculated (in kilograms/square meter). Hypertension was defined as blood pressure levels of ≥140/90 mm Hg (the mean of 3 measurements) and/or current use of antihypertensive medication.45 Plasma glucose levels were measured by the hexokinase method. Diabetes was determined by plasma glucose level (fasting glucose level of ≥126 mg/dL, 2-h postload glucose level after 75-g oral glucose tolerance test of ≥200 mg/dL, or casual glucose level of ≥200 mg/dL, using the 2006 World Health Organization criteria46) and/or current use of medication for diabetes. Serum total cholesterol was measured enzymatically. Cerebrovascular lesions on MRI were defined as brain infarction or hemorrhage observed on MRI regardless of the presence or absence of neurological symptoms. Brain infarction included lesions of ≥3 mm in diameter visible on both the T1- and the T2-weighted image with a surrounding hyperintense rim on the FLAIR image. Brain hemorrhage was defined as any hemorrhagic lesions, including cerebral microbleeds, visible on the T2*-weighted image.17 Each scan was read by 2 trained stroke neurologists who were blinded to the clinical information (interrater agreement ratio: 85.2% for the brain infarctions, 90.5% for the brain hemorrhages). In the case of different interpretations, a third stroke neurologist read the image and made a final decision.
2.5. Statistical analysisThe age- and sex-adjusted mean values of continuous variables and frequencies of categorical variables for risk factors were calculated and compared between groups using an analysis of covariance with the Dunnett method for multiple comparisons and a logistic regression analysis including age and sex in the relevant model, respectively, with the NCP group set as a reference. The multivariable-adjusted means and 95% confidence intervals of the regional brain volume/ICV were calculated using an analysis of covariance. We evaluated 3 different models as follows: (1) model 1, adjusted for age and sex; (2) model 2, adjusted for age, sex, and sociodemographic, physical, and lifestyle factors (ie, educational status, marital status, subjective economic status, hypertension, diabetes, serum total cholesterol, BMI, current smoking, current drinking, regular exercise, cerebrovascular lesions on MRI, and ADL disability); and (3) model 3, adjusted for the covariates included in model 2 plus depressive symptoms as a psychological factor because depressive symptoms are often observed in individuals with CLBP and depression itself has been reported to be associated with lower regional brain volumes.44 To assess the dose–response relationship between the severity of CLBP and the regional brain volume, we divided the CLBP group into low- and high-intensity groups by a median VAS of 40 mm; individuals in the NCP and CLBP groups were included in this analysis (n = 730). As a sensitivity analysis, the relationship between the severity of CLBP and the regional brain volumes were assessed using VAS as a continuous variable (VAS in the NCP group was set as 0 mm). For the subgroup analysis, we stratified participants by age (<75 and ≥75 years). The heterogeneity in the magnitude of the association of CLBP status with the multivariable-adjusted mean values of pain-related brain regions across the age groups was tested by adding a multiplicative interaction term between the status of CLBP and age group to the relevant model. Additionally, a similar analysis was performed using age as a continuous variable for a sensitivity analysis. The aforementioned analyses were performed using the SAS software package (version 9.4; SAS Institute Inc, Cary, NC). Two-sided values of P < 0.05 were considered statistically significant in all analyses.
We also used the Query, Design, Estimate, Contrast (QDEC) interface of FreeSurfer to perform a group analysis in which regions of interest were not set, to compare the difference in cortical volume between the CLBP group and the NCP group, after excluding the OCP group. Query, Design, Estimate, Contrast supplies the statistical maps, which show the distribution of P values generated by means of a general linear model with covariates. The general linear model was computed on a vertex-by-vertex basis for the cortical volume of each hemisphere, using the following covariates: age, sex, educational status, marital status, subjective economic status, hypertension, diabetes, serum total cholesterol, BMI, current smoking, current drinking, regular exercise, cerebrovascular lesions on MRI, and ADL disability. Multiple comparisons were corrected using a Monte Carlo simulation method, which is a cluster-wise correction using a threshold set at P < 0.05, with the initial cluster-forming criterion being set at P < 0.005 in accordance with previous studies.4,18
3. ResultsIndividuals suffering mainly from CLBP accounted for 17.1% of the total study population. Among the individuals with chronic pain, the low back was the most common body part chosen as the main site of pain, followed by the knees, shoulders, and feet (Table S1, available as supplemental digital content at https://links.lww.com/PAIN/B586). The age- and sex-adjusted baseline characteristics of the study population according to the status of chronic pain are summarized in Table 1. Compared with the NCP group, the CLBP group had significantly higher proportions of the individuals with low education level, hypertension, and depressive symptoms, and a significantly lower proportion of the individuals with regular exercise. In the OCP group, the mean values of age and BMI, and the proportions of women and the individuals with low subjective economic status, ADL disability, and depressive symptoms were significantly higher, whereas the mean value of serum total cholesterol and the proportion of the individuals with regular exercise were significantly lower than in the NCP group.
Table 1 - Age- and sex-adjusted baseline characteristics of the study participants according to the status of chronic pain (n = 1106). VariablesTotal participants (n = 1106)
Status of chronic pain*Age is sex adjusted.
†P < 0.05 vs no chronic pain.
‡Sex is age adjusted.
§P < 0.001 vs no chronic pain.
‖Two individuals with missing data on these variables were excluded.
¶Three individuals with missing data on cerebrovascular lesions on MRI were excluded.
#Three individuals with missing data on GDS score were excluded.
ADL, activities of daily living; BMI, body mass index; GDS, Geriatric Depression scale; MRI, magnetic resonance imaging; SE, standard error; VAS, visual analog scale.
Table 2 demonstrates multivariable-adjusted mean values of the pain-related brain regions according to the status of chronic pain. The CLBP group had significantly lower age- and sex-adjusted mean values of the ventrolateral prefrontal cortex, the dorsolateral prefrontal cortex, the posterior cingulate cortex, and the amygdala than the NCP group (model 1). These significant associations remained unchanged substantially after adjustment for age, sex, educational status, marital status, subjective economic status, hypertension, diabetes, serum total cholesterol, BMI, current smoking, current drinking, regular exercise, cerebrovascular lesions on MRI, and ADL disability (model 2) and after additional adjustment for depressive symptoms (model 3). There was no evidence of a significant difference between the CLBP group and the NCP group in the remaining brain regions of interest (ie, the orbitofrontal cortex, postcentral gyrus, insular cortex, anterior cingulate cortex, and hippocampus). Also, there was no evidence of a significant difference in brain volumes for any of the examined regions between the NCP group and the OCP group (all P > 0.40). Table S2 shows multivariable-adjusted mean values of the striatal brain regions and memory-related brain regions (available as supplemental digital content at https://links.lww.com/PAIN/B586). For these regions, there was no evidence of a significant difference in brain volumes between the NCP and CLBP groups or between the NCP and OCP groups.
Table 2 - Multivariable-adjusted mean values of the regional brain volumes according to the status of chronic pain (n = 1106). Status of chronic pain No. participants Multivariable-adjusted mean values (95% confidence intervals) Model 1 P Model 2 P Model 3 P Ventrolateral prefrontal cortex, %ICV No chronic pain 541 1.228 (1.218-1.238) (Ref.) 1.228 (1.218-1.238) (Ref.) 1.227 (1.217-1.237) (Ref.) Chronic pain in body parts other than the lower back 376 1.218 (1.206-1.231) 0.41 1.220 (1.208-1.232) 0.56 1.219 (1.207-1.232) 0.58 Chronic low back pain 189 1.200 (1.183-1.217) 0.01 1.199 (1.182-1.216) 0.009 1.200 (1.183-1.217) 0.02 Dorsolateral prefrontal cortex, %ICV No chronic pain 541 4.906 (4.876-4.936) (Ref.) 4.908 (4.877-4.939) (Ref.) 4.905 (4.875-4.936) (Ref.) Chronic pain in body parts other than the lower back 376 4.899 (4.862-4.935) 0.94 4.901 (4.864-4.938) 0.95 4.902 (4.865-4.938) 0.99 Chronic low back pain 189 4.836 (4.785-4.887) 0.04 4.830 (4.779-4.882) 0.02 4.835 (4.783-4.887) 0.04 Orbitofrontal cortex, %ICV No chronic pain 541 1.650 (1.639-1.660) (Ref.) 1.650 (1.640-1.660) (Ref.) 1.649 (1.638-1.659) (Ref.) Chronic pain in body parts other than the lower back 376 1.641 (1.629-1.653) 0.49 1.642 (1.630-1.654) 0.55 1.642 (1.630-1.654) 0.67 Chronic low back pain 189 1.633 (1.616-1.650) 0.19 1.633 (1.616-1.650) 0.17 1.635 (1.618-1.652) 0.33 Postcentral gyrus, %ICV No chronic pain 541 1.075 (1.067-1.084) (Ref.) 1.075 (1.066-1.083) (Ref.) 1.074 (1.065-1.082) (Ref.) Chronic pain in body parts other than the lower back 376 1.077 (1.067-1.087) 0.96 1.078 (1.067-1.089) 0.86 1.078 (1.068-1.089) 0.76 Chronic low back pain 189 1.061 (1.046-1.075) 0.16 1.061 (1.046-1.075) 0.21 1.062 (1.048-1.077) 0.36 Insular cortex, %ICV No chronic pain 541 0.883 (0.877-0.890) (Ref.) 0.883 (0.877-0.890) (Ref.) 0.883 (0.877-0.890) (Ref.) Chronic pain in body parts other than the lower back 376 0.885 (0.877-0.892) 0.93 0.885 (0.877-0.893) 0.95 0.885 (0.877-0.893) 0.92 Chronic low back pain 189 0.875 (0.865-0.886) 0.36 0.875 (0.864-0.886) 0.33 0.876 (0.865-0.887) 0.44 Thalamus, %ICV No chronic pain 541 0.832 (0.827-0.837) (Ref.) 0.832 (0.827-0.837) (Ref.) 0.832 (0.826-0.837) (Ref.) Chronic pain in body parts other than the lower back 376 0.828 (0.822-0.834) 0.45 0.829 (0.822-0.835) 0.67 0.829 (0.822-0.835) 0.73 Chronic low back pain 189 0.831 (0.822-0.839) 0.95 0.831 (0.822-0.840) 0.99 0.832 (0.823-0.840) 1.00 Anterior cingulate cortex, %ICV No chronic pain 541 0.469 (0.464-0.475) (Ref.) 0.469 (0.463-0.474) (Ref.) 0.468 (0.463-0.474) (Ref.) Chronic pain in body parts other than the lower back 376 0.472 (0.465-0.478) 0.82 0.473 (0.466-0.480) 0.57 0.473 (0.466-0.480) 0.53 Chronic low back pain 189 0.469 (0.460-0.478) 1.00 0.470 (0.460-0.479) 0.98 0.470 (0.461-0.479) 0.95 Posterior cingulate cortex, %ICV No chronic pain 541 0.378 (0.374-0.382) (Ref.) 0.378 (0.374-0.382) (Ref.) 0.377 (0.373-0.381) (Ref.) Chronic pain in body parts other than the lower back 376 0.375 (0.370-0.379) 0.44 0.375 (0.370-0.380) 0.60 0.375 (0.371-0.380) 0.75 Chronic low back pain 189 0.369 (0.362-0.375) 0.03 0.369 (0.362-0.375) 0.03 0.369 (0.363-0.376) 0.08 Amygdala, %ICV No chronic pain 541 0.183 (0.181-0.185) (Ref.) 0.183 (0.181-0.185) (Ref.) 0.183 (0.181-0.185) (Ref.) Chronic pain in body parts other than the lower back 376 0.184 (0.182-0.186) 0.73 0.183 (0.181-0.186) 0.97 0.184 (0.181-0.186) 0.89 Chronic low back pain 189 0.179 (0.176-0.182) 0.04 0.179 (0.176-0.182) 0.02 0.179 (0.176-0.182) 0.048 Hippocampus, %ICV No chronic pain 541 0.494 (0.490-0.498) (Ref.) 0.494 (0.490-0.498) (Ref.) 0.494 (0.490-0.498) (Ref.) Chronic pain in body parts other than the lower back 376 0.494 (0.489-0.498) 0.99 0.494 (0.489-0.498) 0.95 0.494 (0.489-0.499) 1.00 Chronic low back pain 189 0.487 (0.480-0.494) 0.14 0.486 (0.479-0.493) 0.07 0.487 (0.480-0.493) 0.13Values are calculated as follows: ([left + right] regional brain volume/ICV) × 100 (%).
Model 1: Adjusted for age and sex.
Model 2: Adjusted for age, sex, educational status, marital status, subjective economic status, hypertension, diabetes, serum total cholesterol, body mass index, current smoking, current drinking, regular exercise, cerebrovascular lesions on magnetic resonance imaging, and activities of daily living disability. Five participants with missing data on some covariates were excluded.
Model 3: Adjusted for covariates included in model 2 plus depressive symptoms. Eight participants with missing data on some covariates were excluded.
ICV, intracranial volume.
To assess the association between the severity of CLBP and the atrophy of the 4 above-mentioned brain regions that were significantly associated with CLBP, the brain volumes of each region were compared across the NCP, low-intensity CLBP (VAS < 40 mm), and high-intensity CLBP (VAS ≥ 40 mm) groups among 730 individuals in the NCP and CLBP groups (Table 3). As the pain intensity increased, the age- and sex-adjusted mean values of the brain volumes in the above 4 brain regions tended to decrease significantly (all P for trend < 0.05, model 1). This association did not materially change after adjusting for covariates, including depressive symptoms (model 2 and model 3). In the sensitivity analysis using VAS as a continuous variable in 726 individuals in the NCP group and CLBP group, higher VAS was significantly associated with lower brain volumes in the above 4 brain regions (Table S3, available as supplemental digital content at https://links.lww.com/PAIN/B586).
Table 3 - Multivariable-adjusted mean values of the regional brain volumes according to the pain intensity of chronic low back pain (n = 730). Status of chronic pain No. participants Multivariable-adjusted mean values (95% confidence intervals) Model 1 P Model 2 P Model 3 P Ventrolateral prefrontal cortex, %ICV No chronic pain 541 1.228 (1.217-1.238) (Ref.) 1.229 (1.218-1.239) (Ref.) 1.228 (1.218-1.238) (Ref.) Chronic low back pain VAS < 40 mm 93 1.211 (1.186-1.236) 0.39 1.209 (1.184-1.234) 0.28 1.209 (1.184-1.234) 0.31 VAS ≥ 40 mm 96 1.189 (1.165-1.214) 0.01 1.188 (1.163-1.213) 0.007 1.190 (1.165-1.216) 0.02 P for trend = 0.004 P for trend = 0.002 P for trend = 0.005 Dorsolateral prefrontal cortex, %ICV No chronic pain 541 4.906 (4.875-4.936) (Ref.) 4.910 (4.879-4.941) (Ref.) 4.908 (4.877-4.939) (Ref.) Chronic low back pain VAS < 40 mm 93 4.870 (4.796-4.944) 0.62 4.864 (4.789-4.939) 0.47 4.864 (4.789-4.939) 0.49 VAS ≥ 40 mm 96 4.806 (4.732-4.879) 0.03 4.794 (4.719-4.870) 0.01 4.804 (4.728-4.881) 0.03
留言 (0)