In vivo experimental designAnimals and experimental design
A total of 105 female C57BL/6 (6–8 weeks of age and weighing 19–22 g) mice were assessed in the present study. All the animals were housed in an environment with a temperature of 22 ± 1 ºC, relative humidity of 50 ± 1%, and a light/dark cycle of 12/12 h and were given water and food ad libitum. All animal studies (including the mice euthanasia procedure) were done in compliance with the regulations and guidelines of Tongji University School of Medicine in Shanghai institutional animal care and conducted according to the AAALAC and the IACUC guidelines (Shanghai) 2017–0005).
All mice were randomly divided into 3 groups (n = 35): 42% hydrogen gas inhalation group (H2 group), LPS-induced ALI group (LPS group, LPS derived from Escherichia coli (serotype O111:B4)), and ALI with 42% hydrogen inhalation group (LPS + H2 group).
Ten mice were randomly drawn from each group to determine the 72 h survival statistics, which were used to assess the protective effect of H2. The other 75 mice were used for collecting other samples. The two ALI groups were induced by intraperitoneal injection of 10 mg/kg LPS. Treatments with inhalation of 42% hydrogen gas for 72 h were administered after the injection of LPS or saline. Hydrogen was produced by a hydrogen–oxygen nebulizer (license No: AMS-H-03, Shanghai Asclepius Meditec Co., Ltd., Shanghai, China) that generates 3 L/min hydrogen gas by water electrolysis. As measured by gas chromatography, the gas generated consisted of 67% hydrogen and 33% oxygen. To keep the oxygen content at 21%, a certain amount of nitrogen was passed in. Thus, the hydrogen mixed gas contained 42% hydrogen, 21% oxygen, and 37% nitrogen (endotoxin-free, purity > 99.9%) in the air.
Cytokine measurements
To measure the cytokines in the serum of mice, blood samples were collected from the eyeball at 3, 6, 12, 24, 48, and 72 h after LPS injection. The serum was separated by centrifugation at 3000 g for 15 min (4℃) and then stored at -80℃. The corresponding enzyme-linked immunosorbent kit (CUSABIO BioTECH., Ltd., China) was used to detect the concentrations of IL-1β, TNF-α, IL-6, and IL-10. All samples were measured in triplicate.
Measurement of MDA and NO levels in lung tissues
Malondialdehyde (MDA) and nitric oxide (NO) are commonly used to represent local or systemic oxidative stress. The lung tissues were collected at 6, 12, and 24 h after LPS injection. Then, 10% of lung tissue homogenates were separated from the supernatant by 3000 g centrifugation for 20 min at 4 °C. Subsequently, MDA and NO content in the supernatants was measured using an MDA assay kit and NO assay kit (Jiancheng Bioengineering Institute, Nanjing, China).
Histological examinations
Lung tissue was collected at 6, 12, 24, and 48 h after LPS injection and fixed in 10% neutral buffered formalin for 24 h and then embedded in paraffin. All specimens were cut into 5 μm thick sections and stained with hematoxylin and eosin (HE). Samples were photographed and examined immediately by Leica DM Microscopes (DM 2500B, Germany, × 200).
TLR4 expressions in lung tissues
Twelve and 24 h after LPS injection, lung specimens were cut into 5 μm thick sections, then immersed in 3% H2O2 for 25 min and rinsed with PBS. They were blocked with 10% normal rabbit serum for 30 min at room temperature and stained with anti-TLR4 primary antibody (1:500; Abcam) overnight at 4 °C, followed by horseradish peroxidase or fluorescein isothiocyanate-conjugated goat anti-mouse immunoglobulin G antibody (1:5000; zhongshan bio.) for 50 min at room temperature. Sections were observed under a microscope (Eclipse Ti-SR; Nikon, Japan, × 200).
In vitro experimental designCell Culture and groups
The mouse RAW 264.7 macrophage cells were purchased from American Type Culture Collection [ATCC], USA. Cells were cultured in a humidified incubator containing 5% CO2 with Dulbecco’s modified Eagle’s medium (DMEM) medium (Gibco, Grand Island, NY) at 37 °C, containing 100-IU/mL penicillin G, 100-IU/ mL streptomycin, and 10% heat-inactivated fetal bovine serum.
The experiment included three groups: PBS group, LPS group, and LPS + H2 group. The PBS group was cultured with a normal DMEM medium and stimulated with PBS in a humidified atmosphere containing 5%CO2/95% air at 37ºC; the LPS group was cultured with a normal DMEM medium and stimulated with LPS in a humidified atmosphere containing 5%CO2/95% air at 37ºC; the LPS + H2 group was cultured with normal DMEM medium + 60% H2 and stimulated with LPS in a humidified atmosphere containing hydrogen mixed gas (60% hydrogen, 21% oxygen, 5% carbon dioxide, and 14% nitrogen (endotoxin-free, purity > 99.9%) in air. Hydrogen was produced by a hydrogen–oxygen nebulizer (license No: AMS-H-03, Shanghai Asclepius Meditec Co., Ltd., Shanghai, China).
Nitric oxide measurement
RAW 264.7 mouse macrophages (1 × 10⁵cell/ml) were plated in 96-well plates. On day 2, the LPS + H2 group and LPS group were pretreated with H2 (60% H2 + normal cell medium) or vehicle (normal cell medium) for 24 h, respectively, and then all cells were incubated with LPS (200 ng/mL) for another 24 h. The concentration of nitric oxide (NO) in media was determined using the NO assay kit (Jiancheng Bioengineering Institute, Nanjing, China).
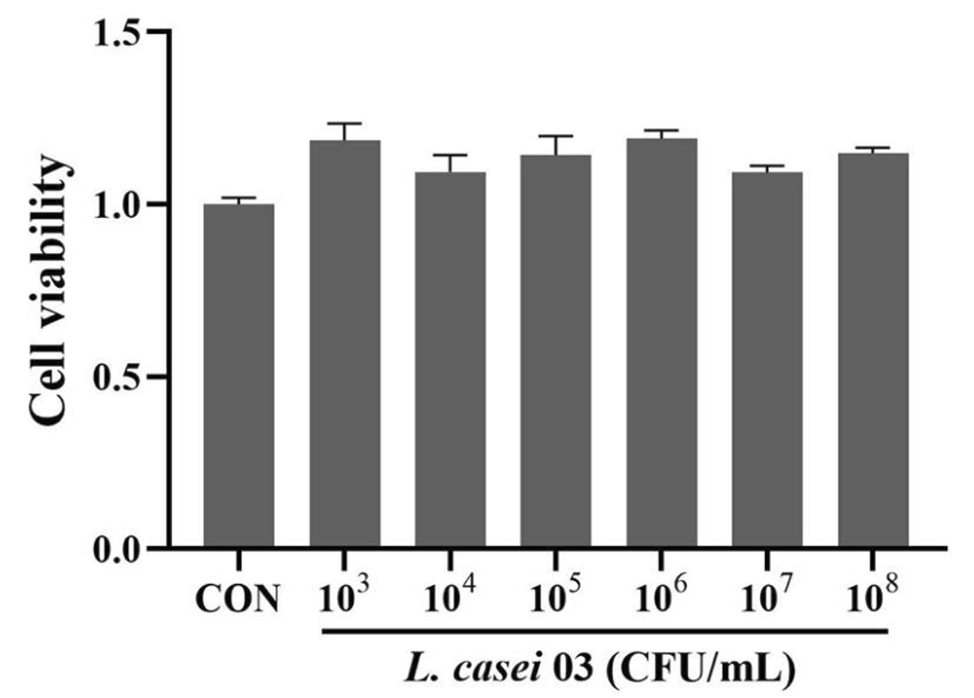
Cell viability assay
Cell viability was assessed by the Cell Counting Kit (Beyotime, China). In 96-well culture dishes, 1 × 10⁵ macrophages in each well and cell were pretreated with 60% H2 for 24 h and then stimulated with LPS (200 ng/ml) or PBS for another 24 h. Then, a 20 μl CCK-8 solution was added to each well and incubated at 37 °C for another 4 h. The cell viability was measured by a microplate spectrophotometer (Thermo, USA) at OD450 nm.
Detection of intracellular ROS
Intracellular ROS production was monitored by a ROS assay kit (Solarbio, China). RAW 264.7 mouse macrophages (1 × 10⁵cell/ml) were seeded into 6-well. Cells were pretreated with 60% H2 for 24 h and then stimulated with LPS (1 μg/ml) or PBS for another 24 h. Then, cells were exposed to a serum-free medium containing 10-μM 2', 7'-Dichlorodihydrofluorescein diacetate (DCFDA). After 20 min of incubation in darkness, the cells were washed three times with a blank DMEM medium. At last, cells were observed under the fluorescence microscope (OLYMPUS, IX71).
Real-time quantitative PCR
In 6-well culture dishes, 1 × 10⁵ macrophages were placed in each well and pretreated with 60% H2 for 24 h and then stimulated with LPS (1 μg/ml) or PBS for another 24 h. Total RNA was extracted by Trizol reagent (Invitrogen, USA) and reverse-transcribed using Thermo Scientific RevertAid cDNA Synthesis Kit (Thermo, USA) to produce cDNA. The quantitative real-time PCR was performed with the ABI-7500 machine using SYBR Green PCR Kit (Thermo, USA).Glyceraldehydes-3-phosphate dehydrogenase (GAPDH) mRNA was used as an internal control. The quantitative PCR program used was as follows: predenaturation (94 °C, 10 min), denaturation (94 °C, 20 s), annealing (55 °C, 20 s), and extension (72 °C, 20 s), using primers specific for GAPDH, IL-6, IL‐1β, IL‐10, and TNF-α.
Each sample was conducted in triplicate, and the gene expression levels were calculated relative to the amount of GAPDH using the 2−ΔΔCT method. The primer sequences for the tested genes are listed in Table 1.
Table 1 The primer sequences of mouse GAPDH, TNF-α, IL-1β, IL-6 and IL-10Western blot
All cells were collected and lysed in RIPA buffer (Beyotime, China), and the whole proteins, nucleoproteins, and cytoplasmic proteins were extracted as required. Protein concentrations were determined by BCA protein assay kit (KeyGEN BioTECH, China). Equal quantities of protein were separated on 12% SDS–PAGE, electrophoretically transferred to polyvinylidene fluoride membranes (Millipore, USA), and then blocked with 5% non-fat milk in TBST buffer for 2 h at room temperature. The membranes were then incubated with the corresponding antibodies overnight at 4 °C. The corresponding antibodies were: anti-IκB, anti-pIκB, anti-TLR4, and anti-NF-κB(Abcam, Cambridge, UK). Samples were then washed three times and incubated with the horseradish peroxidase-conjugated secondary anti-rabbit/mouse antibody for 1 h at room temperature. The proteins were visualized using an enhanced ECL detection kit (Dingguo changsheng biotechnology CO., Ltd., China) and scanned with a Clinx ChemiScope chemiluminescence imaging system (ChemiScope 5300 Pro). The relative optical densities of specific proteins were estimated utilizing a ChemiScope analysis program.
Statistical analysis
Data were reported as the mean ± SEM. All statistical analyses were performed using Prism 5.0 (GraphPad Software, USA). The nonparametric Mann–Whitney U test was employed to compare the value of all indicators between pairwise. A significance level of 0.05 was considered to be significant for all calculations. #p or *p represents p-value < 0.05. ##p or **p represents p-value < 0.01. ###p or ***p represents p-value < 0.001.


留言 (0)