
記住我
Over the years, incorporating neoadjuvant treatment (chemotherapy and radiotherapy) has improved outcome with low local recurrence rates and improved survival.1
Most patients will undergo total mesorectal excision (TME) with a low colorectal or coloanal anastomosis. Despite the nerve-sparing and sphincter-sparing nature of the procedure, up to 60% to 90% of patients will experience cumbersome bowel symptoms, impacting quality of live.2,3 These bowel symptoms can vary greatly and include, but are not limited to: increased frequency of bowel movements, urgency, clustering, and fecal incontinence. The combination of the symptoms and their impact on quality of life has been summarized in an international consensus definition and is referred to as the low anterior resection syndrome (LARS).2,4 The LARS score (LARS questionnaire) was developed as a quick screening tool.5 Other assessment tools, such as the ColoRectal Functioning Outcome (COREFO questionnaire)6 and a stool diary, can provide a more comprehensive means to understand the clinical picture.
The current management of LARS after TME includes antidiarrheal medication, dietary instructions, enemas, or sacral nerve stimulation. However, most patients are instructed that spontaneous improvement will follow. Nevertheless, a pilot study regarding a novel bowel rehabilitation program (BOREAL) in LARS patients was recently published, using a stepwise approach to asses and treat LARS patients, starting with medical management as a first option, followed by pelvic floor physiotherapy, biofeedback, transanal irrigation, then sacral nerve stimulation, antegrade irrigation, and eventually a definitive colostomy.7
Recent treatment guidelines on rectal cancer (RC) do not8 or only briefly9,10 mention pelvic floor muscle training (PFMT) as a conservative treatment option for LARS. However, in noncancer populations, PFMT is highly recommended as a treatment option for fecal incontinence.11
Previous reviews remained inconclusive, partly due to the limited number of studies and the rather low methodological quality (nonrandomized efficacy studies) of these studies.12–14 Furthermore, 2 randomized controlled studies reported on the role of PFMT on fecal incontinence after RC surgery.15,16 Notwithstanding the fact that these were randomized trials, the focus was specifically on PFMT effects for incontinence instead of bowel complaints as a whole complex of symptoms (LARS). Follow-up was only reported until maximally 9 months.15,16 This randomized controlled trial (RCT) aims to evaluate the effects of a comprehensive PFMT program up to 1 year after TME for RC on the comprehensive set of bowel symptoms or LARS, in comparison to patients who received no training.
METHODS Study DesignThe study protocol has previously been published.17 In short, this study was a multicenter, single-blind, prospective RCT. Patients treated for RC were recruited after TME in 3 Belgian hospitals: University Hospitals Leuven, Onze-Lieve-Vrouw (OLV) Hospital in Aalst or General Hospital Groeninge in Kortrijk. Ethics approval was granted by the coordinating Ethical Committee of the University Hospitals Leuven (s59761) and additionally a positive advice from the other local Ethical Committees was obtained. This study applies the principles established in the Declaration of Helsinki and was reported according to the CONSORT guidelines (Supplemental Digital Contents 1, 2, https://links.lww.com/SLA/E106, https://links.lww.com/SLA/E107). This trial was registered at Netherlands Trial Register (NTR6383).
PatientsInclusion criteria were as follows: (1) patients who had a low anterior resection (LAR) with TME for RC, (2) patients with a minimal LARS score5 of 21/42 (=at least minor LARS) at 1 month after surgery (no ileostomy) or after ileostomy closure, and (3) patients had to be able to come to the hospital once a week during the complete treatment period of 12 weeks. Exclusion criteria have previously been described.17 A written consent form was signed by participants before data collection and obtained by the assessor before the first assessment. All data were deidentified and coded with a unique trial identification number.
Randomization and BlindingOne month after restoration of transit, patients were randomly assigned to the intervention group (receiving 12 weeks of PFMT) or to the control group (not receiving PFMT, standard care). The randomization was computer generated. Sequencing was determined by the date of rectal resection (in case of no ileostomy) or by the date of the ileostomy closing (in case the patient received a temporary ileostomy). The randomization was performed with 8 strata, using 6-size permuted blocks. The strata were a result from 3 binary stratification variables, which were: sex (male vs female), type of anastomosis (stapled vs handsewn), and type of reconstruction (colonic J-pouch/side-to-end coloanal anastomosis vs straight coloanal anastomosis). The assessor was blinded for the allocation of the participants to the 2 groups, and the participants were asked not to discuss the treatment of their bowel symptoms with the assessor. Blinding of the participants or of the therapist who performed the treatments was not possible given the nature of the intervention.
ProceduresThe intervention group received 12 weeks of PFMT, consisting of 9 individual treatments: during the first 6 weeks once a week and 3 sessions over the last 6 weeks. Each session was provided by a specialized physiotherapist trained in pelvic re-education and with several years of experience in training these patients. The sessions started with an assessment and evaluation of bowel symptoms with a stool diary, combined with patient education, pelvic floor muscle exercises (focused on strength, endurance, relaxation, proprioception, and coordination), electromyographic-biofeedback/electrical stimulation, and rectal balloon training (improvement of rectal sensation of filling and proper expelling). The content of the treatment has been described in detail in the published protocol.17 The control group did not receive any PFMT. During follow-up, every participant was monitored by the department of abdominal surgery, and no adverse events were expected due to PFMT. If necessary, adverse events could be reported to members of the research team.
OutcomesAll outcome measures were assessed at 1, 4, 6, and 12 months after TME/stoma closure. The primary outcome was defined as the proportion of participants with an improvement in the LARS category at 4 months (from major LARS to minor LARS, from major LARS to no LARS, or from minor LARS to no LARS) compared with the LARS score measured at 1 month postoperatively. The primary outcome was the dichotomous classification of change in the LARS category (1: change in category, 0: no change in category). The LARS score itself (continuous variable) was recorded as a secondary outcome. Other secondary outcomes were bowel symptoms evaluated by (1) the COREFO questionnaire,6 (2) a Numeric Rating Scale (NRS) regarding the subjective bother of bowel symptoms, and (3) a stool diary. A 7-day stool diary assessed: frequency of bowel movements, stool consistency (scored on the Bristol Stool Scale), urgency/incontinence/soiling episodes, fragmentation of stool (clustering). Quality of life was evaluated by the Short Form 12 (SF-12).18
Sample Size CalculationThe primary endpoint was defined as the proportion of patients with an improvement in the LARS category at 4 months (=minimal clinically important difference). The expected proportion of patients with success (improvement) in the control group was assumed to equal 10% after 12 weeks of PFMT, based on expert opinion. It was calculated that 49 subjects per group were needed to detect with at least 80% power a difference of 25% between groups (in the proportion of patients that improved in LARS category), based on expert opinion (thus 10% vs 35%). This calculation was based on a 2-sided Fisher exact test with α equal to 0.05. To anticipate for patient dropout and inclusion of strata (8 strata, resulting from 3 binary stratification variables) in the final analysis (a stratified exact test for proportions), 60 subjects per group were required.
Statistical AnalysisFor the primary analysis, a 2-sided stratified exact Cochran-Mantel-Haenzel-test was used to compare the proportion of patients with a decrease in LARS category between both groups at 4, 6, and 12 months. Tipping point imputation was used for missing data on LARS category changes under MNAR (missing non-at-random) assuming no changes in the intervention group. Data were analyzed according to the intention-to-treat principle. For the secondary outcomes [LARS (continuous), COREFO, NRS, bowel diary frequencies, SF-12], linear mixed-effects models were used to assess changes over time (from 1 to 12 months). To assess different trajectories for patients in both groups, we included random effects (intercept and slope) and fixed effects (time, group, interaction of group, and time) into the model. For the primary and secondary outcomes, the α level was set at 0.05. Analyses were performed by Leuven Biostatistics and Statistical Bioinformatics Centre. The exact Cochran-Mantel-Haenzel test was performed in SAS 9.4, and linear mixed-effects models were fitted in R (v.4.0.3).
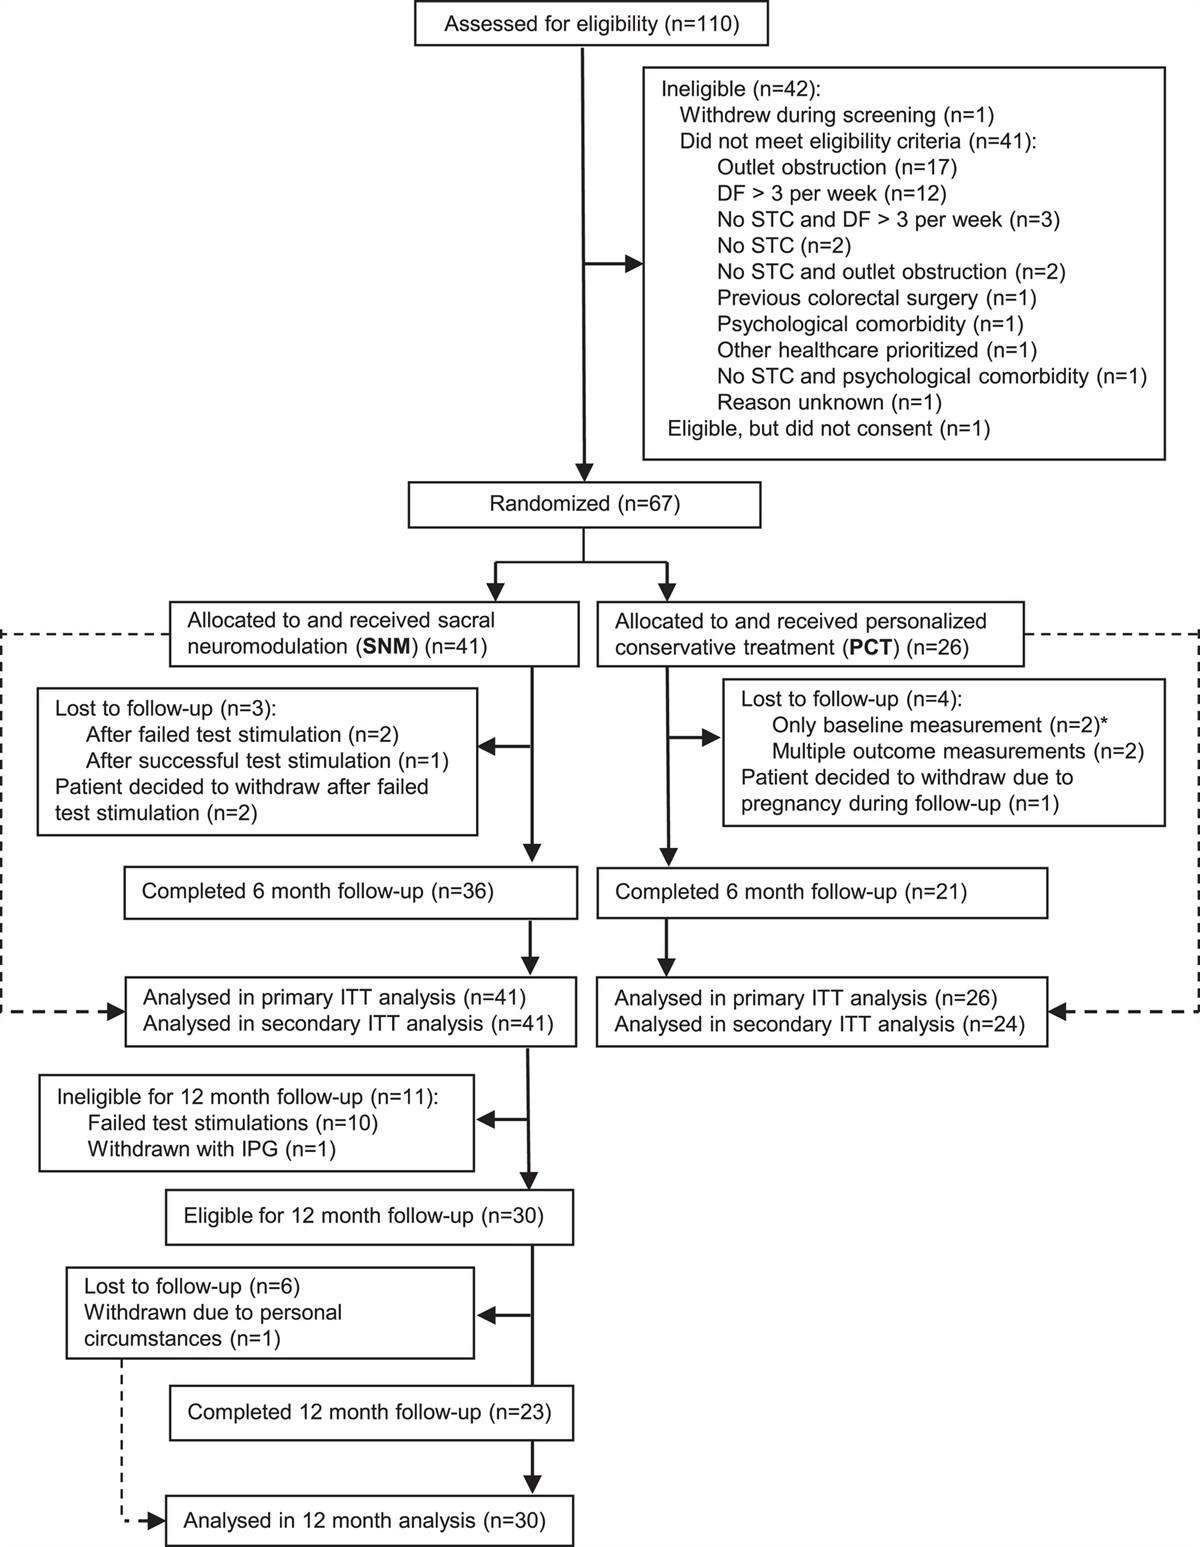
RESULTSBetween January 2017 and January 2021, 104 patients entered the study protocol. Initially, the inclusion of 120 patients was foreseen. As the accrual rate was hampered by the COVID-19 restrictions and based upon a lower-than-predicted dropout rate, inclusion was stopped at 49 months (104 patients). Figure 1 gives an overview of the trial. Baseline characteristics are shown in Table 1, and outcome values for the questionnaires in Table 2. At 4 months, after TME/stoma closure, there was a significant difference in the proportion of patients with an improvement in the LARS category (P=0.0415). At 6 months, the difference remained significant (P=0.0091) but no longer at 12 months (P=0.3897) (Table 2, Fig. 2). At 4 months, the continuous LARS score (P=0.0496) and COREFO score (P=0.0369) differed significantly between both groups (Table 2, Fig. 3). Furthermore, all the following items were significantly better in the intervention group at 4 months: the average frequency of bowel movements/24 hours (P=0.0277), the average frequency of solid stool leakage (day: P=0.0241; night: P=0.0496) as well as the average number of clusters per day (P=0.0369), assessed with the stool diary. Other secondary outcome variables (NRS scores, SF-12 scores, and the remaining stool diary items) were not found to be significantly different between the intervention and control group. An overview of the results is further presented in Table 2.
 FIGURE 1:
 Trial recruitment. *Due to psychosocial circumstances, distance to the hospital or group preference.
TABLE 1 - Baseline Characteristics (N=104) Value Variables Intervention Group (n=50) n (%) Control Group (n=54) n (%) Age [mean (SD)/median (IQR)] (y) 58.8 (12.7) 57.1 (10.9) ≤49 11 (22.0) 14 (25.9) 50–69 29 (58.0) 35 (64.8) ≥70 10 (20.0) 5 (9.3) Sex Male 36 (72.0) 35 (64.8) Female 14 (28.0) 19 (35.2) BMI [mean (SD)/median (IQR)] (kg/m2) 24.6 (4.0) 24.1 (3.7) <25.0 28 (56.0) 30 (55.6) 25.1–30.0 19 (38.0) 16 (29.6) >30.0 3 (6.0) 8 (14.8) Partner Yes 46 (92.0) 48 (88.9) No 4 (8.0) 6 (11.1) Employment status Retired 23 (46.0) 17 (31.5) Employed/unemployed 27 (54.0) 27 (68.5) Tumor height* Low (0–5 cm) 29 (58.0) 31 (59.3) Mid (5.1–10 cm) 14 (28.0) 16 (29.6) High (10.1–15 cm) 7 (14.0) 7 (11.1) Type of reconstruction Straight coloanal anastomosis 36 (72.0) 31 (57.4) Side-to-end coloanal anastomosis 5 (10.0) 16 (29.6) Colon pouch-anal anastomosis/J-pouch 9 (18.0) 7 (13.0) Anastomosis Handsewn 15 (30.0) 17 (31.5) Stapled 35 (70.0) 37 (68.5) Neoadjuvant therapy No 15 (30.0) 16 (29.6) Chemotherapy and/or radiotherapy 35 (70.0) 38 (70.4) Adjuvant therapy No 26 (52.0) 28 (51.9) Chemotherapy 23 (46.0) 25 (46.2) Chemoradiotherapy 1 (2.0) 1 (1.9) Stoma Yes 43 (86.0) 47 (87.0) No 7 (14.0) 7 (13.0)*From the anal verge.
BMI indicates body mass index; IQR, interquartile range.
Bold values indicate statistically significant P < 0.005.
*Cochran-Mantel-Haenzel.
†Linear mixed-effect models.
‡Average frequency.
§Average number.
C indicates control; E, experimental; BM, bowel movements; CI, confidence interval; MCS, Mental Component Score; PCS, Physical Component Score; SL, stool leakage.
 FIGURE 2:
 Representation of the LARS categories for the experimental and control group at each timepoint. *P-values correspond to the results of the exact proportion test of the proportion differences, based on the 1 month timepoint.
 FIGURE 3:
 Representation of the trajectories of the LARS and COREFO scores over time.
No serious adverse events related to PFMT were reported. No RC patients were withdrawn because of harm related to the intervention.
DISCUSSIONThis is the first RCT justifying the use of PFMT to improve bowel symptoms in the early care pathway of RC patients. PFMT resulted in a significantly higher proportion of patients with an improvement in LARS at 4 and 6 months. At 4 months, the total LARS and COREFO scores were significantly decreased in the intervention group, and PFMT had a beneficial effect on stool frequency, incontinence, and clustering.
There is a natural tendency for functional improvement over time.19 This study shows that PFMT can accelerate this process, as twice as many patients reached acceptable function at 4 months. The lack of improvement in the quality of life or the lack of differences between the groups regarding this aspect might be linked to the choice of a questionnaire rather than the intervention that is falling short. After all, the LARS questionnaire was developed as a short questionnaire for bowel dysfunction after LAR on the basis of symptoms and impact on quality of life. Seeing that PFMT was shown to have a significant influence on the LARS score, we can further perpetuate the foregoing reasoning regarding the choice in the quality of life questionnaires. We therefore propose that all patients with LARS symptoms at 1 month should rece
留言 (0)