
記住我


In order to obtain a sufficient cohort to study metabolic inflammation in the future, a two-step process was planned for FoCus cohort recruitment: [A] Seventy-five percent of the subjects were recruited randomly (n = 4,600; assuming a response rate between 30.0 and 40.0%) from the population via the local registration offices in the Kiel area, ensuring a cross-sectional representation of the population in Kiel, the capitol of the federal state Schleswig–Holstein in Northern Germany, and the area within a radius of 15-kms. These subjects are defined as the registration office group (ROG). 28.5% (n = 1309) of the 4600 invited subjects agreed to participate. [B] 25% of FoCus particpants were patients with metabolic inflammation recruited from the Outpatient Centre of the Division of Endocrinology, Diabetes and Clinical Nutrition of the University Medical Center of Schleswig–Holstein in Kiel (UKSH). These patients also lived in the Kiel area. The reason to include these subjects was to ensure a significant number of subjects with clinically manifest metabolic inflammation at baseline, in order to identify biomarkers or pathologies which can be followed longitudinally in subjects drawn from the baseline sample. This group is defined as the metabolic inflammation group (MIG). During their regular clinic visits, 502 patients were personally asked whether they would like to participate in the cohort study and all agreed to participate. Data acquisition and management were performed in close collaboration with the popgen Biobank of the Institute of Epidemiology [7]. The detailed study flowchart is presented in Fig. 2.
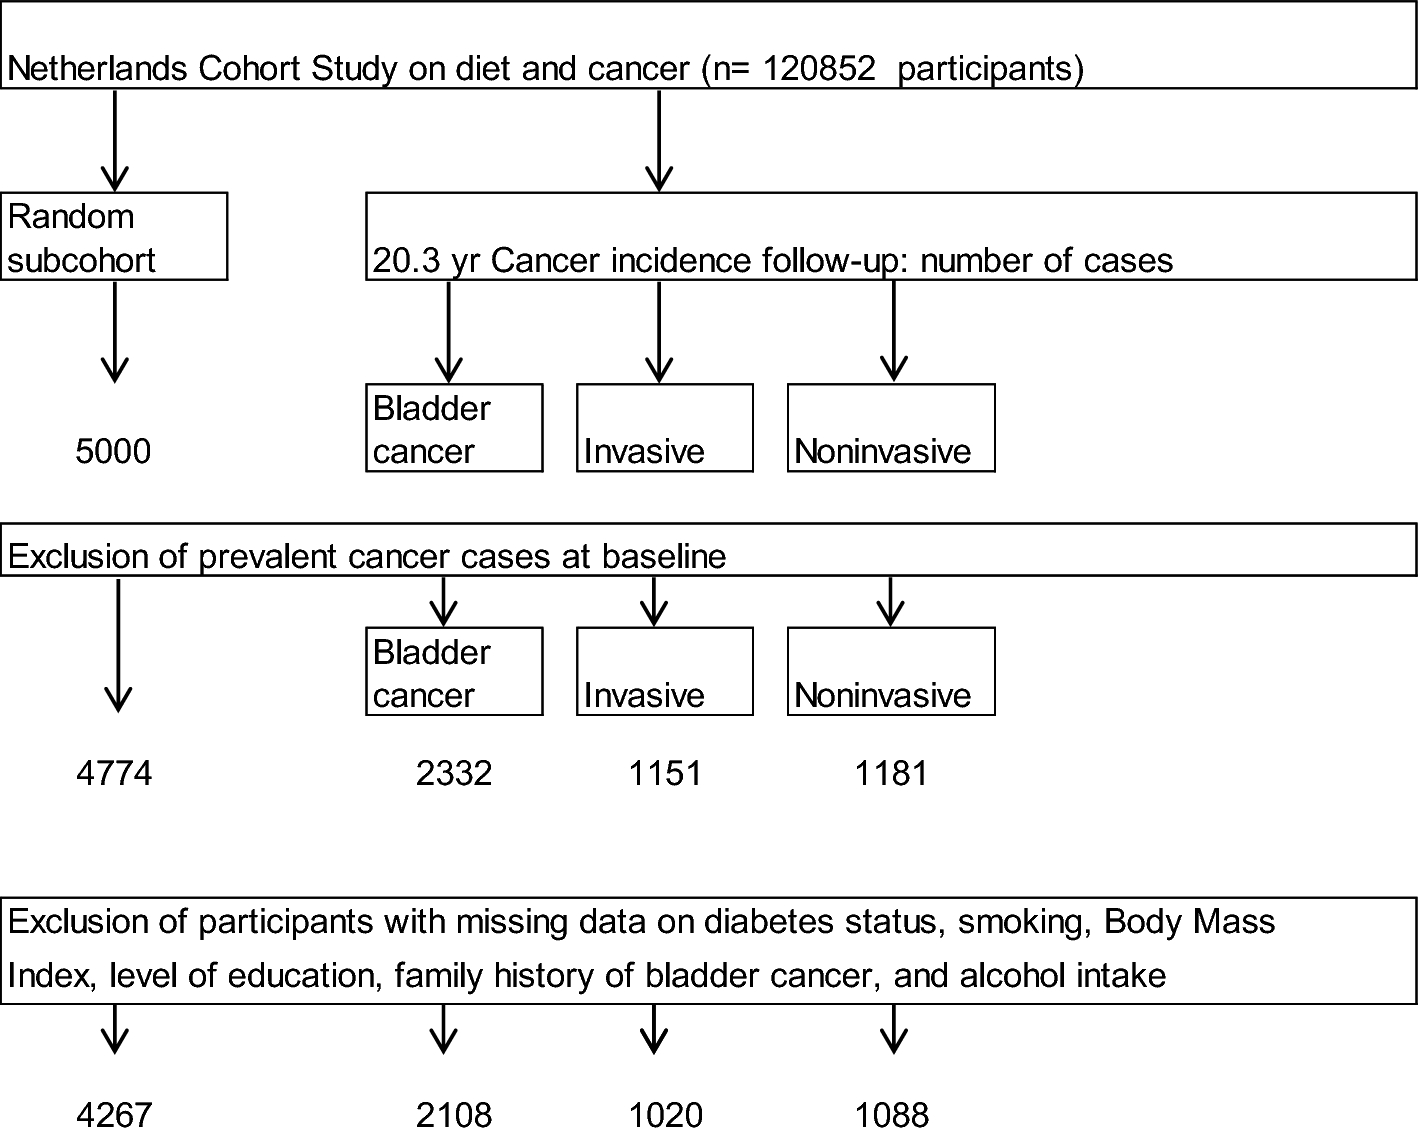
Fig. 2
Flow chart of the FoCus cohort
Recruitment phase (2011–2014)During the first recruitment phase referred to as baseline in the following, data were collected between 2011 and 2014 from 1811 adults (18–83 years). Two hundred of the 1,811 subjects were pheno- and geno-typed twice to validate the analytical methods used, through re-invitation six months after initial recruitment. After internal data pre-processing 1795 of the 1811 subjects were eligible for further data analyses (8 withdrew consent to participate, 8 were excluded for data quality reasons), including 1301 (72.5%) residents (ROG) from the regional registration office and 494 (27.5%) patients (MIG) from the Obesity Outpatient Centre (see Fig. 2).
Before its start, the study was approved by the local ethics committee of the Kiel University (A156-03/Date 2011/07/28) and was registered under the clinical trial number DRKS00005285 at the German Clinical Trials Register in Cologne. All participants were informed about the nature of the study and the study procedure including anthropometric measures, biomaterial sampling, dietary and lifestyle assessment as well as data handling. All participants had appropriate time to consider whether they wanted to take part in the study. Participants were also informed that they could withdraw from the study at any time without giving reasons. Data collected up to that point were then removed from the database accordingly. After that procedure, all participants who provided written informed consent were included into the FoCus study. Participants were also asked for their consent to be contacted in the future for follow-up visits.
Data collectionParticipants within the cohort underwent an internal and nutritional medical phenotyping program (Tables 1, 2 and 3) including, for example, anthropometric measurements, medical history, sociodemographic data, analysis of metabolic and inflammatory markers in blood samples and evaluations of a food frequency questionnaire.
Table 1 Physical and medical examinations conducted and collected biomaterial at baseline and first follow-up (Follow-up 1)Table 2 Blood and urine parameters determined at baseline and first follow-up (Follow-up 1)Table 3 Questionnaires conducted at baseline and first follow-up (Follow-up 1)ExaminationsAll examinations were performed at the study centre by trained medical staff according to the study-specific standard operating protocol.
Anthropometric and blood pressure measurementsHeight and weight were measured during the clinical investigation and body mass index (BMI = weight (kg)/ height (m)2) was calculated. BMI classes were stratified according to the World Health Organization (WHO) [8] as follows: underweight (< 18.5 kg/m2), normal weight (18.5–24.9 kg/m2), overweight (25–29.9 kg/m2), obesity grade I (30–34.9 kg/m2), obesity grade II (35–39.9 kg/m2) and obesity grade III (≥ 40 kg/m2). Participants were weighed without shoes and wearing light clothes using digital scales (Tanita BC-418 MA, Tanita Europe BV, Amsterdam, Netherlands). The weight was determined to the nearest 0.1 kg. Height was measured to the nearest 1 cm using a stadiometer (seca GmbH&Co.KG, Hamburg, Germany). Waist circumference was measured at the approximate midpoint between the lower margin of the last palpable rib and the top of the iliac crest and hip circumference around the widest portion of the buttocks according to the WHO [9]. All physical examinations were performed by trained medical staff and each measurement was repeated twice by the same staff member. For data analyses, mean values were calculated. Body fat analysis were performed using a single frequency body composition analyser (Tanita BC-418 MA, Tanita Europe BV, Amsterdam, Netherlands; bioimpedance analysis (BIA)) in standing position. The advantages of the BIA analysis technique are its ease of use and the non-invasive mode of measurement.
After a resting period of 5–10 min in sitting position, measurement of systolic and diastolic blood pressure was undertaken twice by sphygmomanometer (weight adopted blood pressure cuffs; BOSCH + SOHN GmbH u. Co. KG, Jungingen, Germany) and stethoscope, with 3-min between measurements. The mean of the two blood pressure measurements was used for further analyses.
Handgrip strength determinationMuscle strength was assessed by measuring handgrip strength (HGS) using a MAP 80K1 handgrip dynamometer (Kern & Sohn GmbH, Balingen, Germany). The HGS was measured in a sitting position and the forearm was angled at 90° to the upper arm. Subjects were asked to squeeze the handle of the dynamometer as strongly as they could. Isometric HGS was measured three times for left and right hand, in turn. The participants were also asked about their dominant hand. The mean of the three measurements was calculated for the right and left side. For future analyses the mean of the dominant hand will be used.
Laboratory analysesFasting blood samples were obtained by venepuncture after an overnight fast (average fasting time 10.75 ± 5.3 h) for biochemical analysis of metabolic and inflammatory markers. Midstream urine samples for metabolomics were collected on the day of the visit. Stool samples for microbiome analysis were collected by participants prior to the visit (Table 2).
Blood sample analysesC-reactive protein (CRP), interleukin-6 (IL-6), fasting glucose, fasting insulin and triglycerides were analysed in the central laboratory of the UKSH in Kiel on the day of collection. HOMA-IR was calculated (Homeostasis Model Assessment Insulin Resistance = fasting glucose (mg/dL) × fasting insulin (μU/mL)/405) as an index of insulin sensitivity. Blood samples for central laboratory analysis were stored at 4° C until transport.
All other blood samples and other biomaterials were collected and processed following internal laboratory standardized operating procedures. In general, blood samples were centrifuged, separated and aliquoted. For the analysis of genotypes, whole blood samples were frozen. Aliquoted samples were stored at -80 °C.
Protein levels of wingless-Type MMTV Integration Site Family Member 5A (WNT5A), secreted frizzled‐related protein 5 (sFRP 5), myostatin, fetuin-A, osteopontin and fibroblast growth factor 21 (FGF-21) were assessed in subgroups of participants using the following commercially available ELISA kits: WNT5A (SEP549Hu), sFRP5 (SEC842Hu), myostatin (SEB653Hu), fetuin-A (SEA178Hu), osteopontin (SEA899Hu) and FGF-21 (SEC918Hu) all from the Cloud-Clone Corp. (Wuhan, Peoples Republic of China). The measurements were performed according to the manufacturer’s instructions. Nicotinic acid and Nicotinamide serum levels were measured by liquid chromatography and tandem mass spectrometry (Agilent 1100 HPLC/CTC-PAL Autosampler/Sciex API 4000 Triple Quadrupole) by an external specialized laboratory (Medizinisches Labor Bremen, Bremen, Germany) (for methods see Table 2).
Gut microbiome analysesInitially, stool samples of all subjects submitted to the study centre between 2011 and 2015 were stored at – 80 °C until further analysis. The subsequent preparation and sequencing of the samples was carried out by the Institute for Clinical Molecular Biology (IKMB) at the Kiel University as described by Heinsen et al. [10].
DNA extraction from stool samplesDNA was extracted from stool samples using the QIAamp DNA Stool Mini Kit and the QIAcube system (both from Qiagen). After thawing, about 200 mg of sample material was used and transferred to bead-beating tubes (Garnet, 0.7 mm) which were filled with 1.1 ml of ASL lysis buffer. This solution in the tubes was homogenized in SpeedMill PLUS (Analytik Jena) for 45 s at 50 Hz. The samples were then heated to 95 °C. for 5 min. All further steps were continued according to the manufacturer's protocol.
Amplicon sequencing of bacterial 16S rRNA and quality controlDuring preparation for sequencing, the variable V1-V2 region of the 16S rRNA gene was amplified by polymerase chain reaction (PCR), using a pair of primers 27F/338R with an individual combination of two barcodes according to the dual barcoding approach of Caporaso et al. [11]. The SequalPrep Normalization Plate Kit (Thermo Fisher Scientific) according to the manufacturer's instructions was used to normalize the DNA concentration from the PCR products. This was followed by sequencing of the prepared DNA solution with the Illumina MiSeq device. For this purpose, the individual samples were mixed equimolarly (“pooled”). If there was no error, the generated sequences were assigned to the corresponding samples. Complementary sequences were read in the forward and reverse directions and were combined by the program FLASH. The Illumina company also provides a Q-score for the Miseq device, which is used for quality control. Sequences with a Q-Score below 30 in more than 5% of the nucleotides were sorted out using additional software (UCHIME). After quality control, 1541 samples remained for statistical analyses.
Genetic analysesThe laboratory procedures and quality controls were conducted at the Institute of Clinical Molecular Biology (IKMB), Kiel University. Genotyping was performed according to the Infinium Assay Lab Setup and Procedures Guide from illumina (December 2017), using the Infinium iScan OmniExpressExome BeadChip array, build 37/hg19 (illumina, San diegi, CA, USA). The BeadChips were scanned and imaged at two wavelengths using the iScan two-channel microarray scanner. The image files generated were further processed by the iScan Control Software and GenomeStudio software and randomly assembled beadtypes were decoded and their corresponding SNPs were identified [12].
Quality controlsQuality control was conducted using R version 3.1.0 beta and PLINK (whole genome association analysis toolset) version 1.07 [13] and version 1.90 beta [14]. 942,280 single nucleotide polymorphisms (SNPs) in 1,713 samples were collected. All individuals had a genotype call rate of > 95% over the cohort. For each sample pair, identity by descent (IBD) was calculated. Here, a threshold of IBD > 0.185 was used to exclude strong relatedness among individuals, which could otherwise lead to biased estimations in the association analysis. For the calculation of IBD the SNPRelate–package [15] of R was used and a maximum likelihood approach was applied.
SNPs with missingness > 5% over the cohort were excluded from the data set. This was the case for 2591 SNPs. Hardy–Weinberg Equilibrium (HWE) was used to identify SNPs with genotyping errors and SNPs, of which the observed cohort’s allele frequency did significantly deviate from the expected with a p-value > 1e−05 were discarded. This was the case for 2048 SNPs. After quality control, 937,641 SNPs were left. A minor allele frequency (MAF) threshold was set at 0.05, meaning that only SNPs which occurred in at least 5% of the cohort samples were used for further analyses. This was the case for 601,203 SNPs.
Population outliers were identified based on ethnicity by principal component analysis (PCA) of data merged to Hapmap Phase III data [16] from four different populations (European, East Asian (Beijing, China), East Asian (Tokyo, Japan) and African). All individuals not located in the rectangle of the cohort were defined as population outliers and excluded from analysis. After the quality control, 1559 samples remained for the genetic analyses.
Metabolomic analysesBlood and urine samples were analysed by different analytical approaches. Urine samples were diluted 1:4 with water containing 0.1% formic acid (v/v) and analysed by a quadrupole time of flight mass spectrometer (Bruker, Bremen, Germany) [17]. To enhance reproducibility, data were filtered for metabolites present in at least 10% of all samples with a minimum intensity of 106 counts. For urine metabolomics, 891 volunteer samples were analysed and 140 recall samples (collected six months after the individual’s first recruiting day).
Blood samples were extracted by a modified SIMPLEX approach in accordance to Matyash et al. [18]. Samples were subjected to ultra-high-resolution Fourier Transform—Ion Cyclotron Resonance—mass spectrometry (FT-ICR-MS (Bruker, Bremen, Germany). This approach provides the highest mass accuracy, highest resolution and excellent sensitivity for metabolomics data [19]. For the semi-targeted evaluation, a local database built using different web databases (e.g. KEGG, HMDB) [20, 21] and various original research papers was used. Chemical formulae were assigned based on a mass error < 2 ppm, isotopic fine structure and the seven golden rules. Data were filtered for metabolites that were present in at least 10% of all samples with a minimum intensity of 1 million counts. In total, samples of 1747 subjects (plus 189 recall samples, obtained six months after initial recruitment) were analysed. 2389 different hydrophilic and 1754 lipophilic metabolites in blood were found with all metabolites present in at least 10% of all subjects.
QuestionnairesTwo different questionnaires were used for the assessment of information regarding the medical history, general health, medication intake, nutrition, lifestyle (e.g. activity, sleep, smoking habits), sociodemographic and socioeconomic factors (see Table 3).
Questionnaire of medical, sociodemographic and socioeconomic variablesThe main FoCus questionnaire (version 1.1 from July 18, 2011) for assessment of medical status was used to retrieve participants’ medical history. The questionnaire was divided into sections focusing on diverse medical conditions. For example, regarding diabetes status, a question asked whether there was diabetes mellitus diagnosed by the general practitioner. This question could be answered with “yes” or “no”. Sub-questions then asked for the type of diabetes. All participants were asked to bring their regular medication to the study visit in the form of a physician's listing or original packaging (including prescribed and over the counter medication). Participants were also asked if they had taken any medication during the past 5 days before the study visit in addition to their regular medication. Beside medical variables, a second part of the FoCus questionnaire was used to record sociodemographic (e.g. school graduation, type of household, children), socioeconomic (e.g. employment situation) and lifestyle (e.g. content of life, smoking) aspects. Data from 1795 subjects were available.
Questionnaire on the frequency of consumption of food, activity and sleepIn cooperation with the German Institute for Nutritional Research Potsdam-Rehbrücke (DIFE), a questionnaire was developed to record the nutritional behaviour and nutrient intake of all macro- and micronutrients and nutritional supplements. The European Prospective Investigation into Cancer and Nutrition (EPIC) FFQ according to Schulz et al. [22] was applied as a Food Frequency Questionnaire (FFQ). This retrospective survey method was used to determine eating behaviour over the past 12 months. Structurally, the FFQ was divided into classical food groups. To get a semi-quantitative record of food intake, questions about both frequency of consumption and portion sizes were asked, with questions accompanied by pictures of portions and sizes. In 10% of the subjects, a phone-based 24 h-recall was used to validate the EPIC-12-month FFQ. Nutrition data were calculated as energy density (main macronutrients e.g. protein, fat, carbohydrates and alcohol) or were energy-adjusted by the residual method of Willet et al. [23] to adjust single nutrients to the energy intake of the group. Physical activity (walking, cycling, sports, gardening, do it yourself, cleaning, watch TV and climbing stairs) and sleep were part of the EPIC FFQ [24,25,26]. The physical activity questionnaire is a short version of a more extensive questionnaire which was tested in one of the Dutch EPIC centres [27]. Nutrition, activity and sleep data from 1670 subjects were available.
Additional examinationsTesting procedure for tasteTo assess the taste sensitivity of the probands, whole-mouth tests were performed. Each subject was tested separately. First of all, probands were asked to neutralize their mouths with drinking water. Next, they were provided with 0.02 L tasting solution. This solution contained the synthetic bitter compound 6-n-Propylthiouracil (PROP) in a concentration of 273 mg/500 mL drinking water. After a few seconds of keeping the PROP solution in the oral cavity, the probands marked the perceived intensity on a general labelled magnitude scale (gLMS). This procedure was repeated for the second taste solution, containing the tasting agent sodium chloride (NaCl) in a concentration of 29 g/500 mL drinking water. A labelled magnitude scale (LMS) consists of five tick marks, labelled from bottom to top as ‘barely detectable’, ‘weak’, ‘moderate’, ‘strong’, ‘very strong’, and ‘strongest imaginable’, dividing the scale (0–234 mm) in a quasi-logarithmic manner [28]. However, the LMS can be further modified using a more unspecific top-label ‘strongest imaginable sensation of any kind’ to achieve a more generalized version of it (gLMS), aiming at the avoidance of ceiling effects by the type of sense under study [29]. After probands marked their perceived taste sensation per test solution on the gLMS, the distances were measured in millimetres. Visual inspection of raw data showed strong clusters, therefore probands were stratified into 3 taste sensitivity groups, ‘low’, ‘medium’ and ‘high’, according to their marked taste perception for each drinking solution. For the bitter taste test, cut-offs were set at ‘low < 61 mm’, ‘medium > = 61 mm and < 107 mm’ and ‘high > = 107 mm’ and for the salt taste test, cut-offs were set at ‘low < 107 mm’, ‘medium > = 107 mm and < 151 mm’ and ‘high > 151 mm’. Taste sensitivity data were available for 1789 and 1788 study participants for bitter and salty respectively.
Magnetic resonance imaging (MRI) and spectroscopy of the hypothalamusThe MRI examinations were performed on a 3 T MRI scanner (Achieva; Phillips Medical Systems, Eindhoven, the Netherlands) with a 32-channel head coil. T2-weighted fluid-attenuated inversion recovery (FLAIR) images were used to analyse regions of interest (ROIs). Those were in particular the putamen (PUT), the medio basal hypothalamus (MBH) and the amygdala (AMY). The AMY-data was used to normalize PUT- and MBH-data in order to rule out intraindividual differences and to obtain signal ratios. For placement of the MBH-ROIs in coronal T2-weighted FLAIR images, anatomic landmarks such as the third ventricle and the optic tract were used. A voxel size of 0.9 × 1.13 × 3 mm3 (echo time [TE] = 160 ms; repetition time [TR] = 12,000 ms) was used. The volumes of the ROIs were drawn manually. For the MBH, amounts covered were circa 2–4 mm2, with a circumference of circa 6–7 mm, diameter of circa 3 mm, and thickness of 3 mm.
Spectroscopy data were analysed using the Philips SpectroView package. Multivoxel proton spectroscopy was performed using multiply optimized insensitive suppression train (MOIST) water suppression with voxel size 10 × 10 × 10 mm3 (chemical shift imaging point resolved spectroscopy, echo time = 35 ms, repetition time = 2000 ms) and additional sagittal and axial T2-weighted sequences for the MRS planning. The voxels were placed through the bottom of the third ventricle, unilaterally, to obtain separated results. The voxels (l/r) that included most of the MBH were chosen for spectrum analysis. As a marker of neuronal and axonal viability and intensity N-acetyl-aspartate (NAA) was normalized to creatine (Cr) as internal reference. MRI data are available from 54 subjects.
Social network analysesNutrition and activity behaviour data as well as relevant socio-economic characteristics of probands were used for detailed network analysis. Socio-economic variables in network analyses included age, biological sex, education, household size, and household income. Behavioural and lifestyle data were collected for a person connected to the study participant (= EGO), designated ALTER. ALTER may influence the behaviour of EGO. Thus, information on frequency of dieting (DIET), attitude towards food (AT), nutritional knowledge (KNOW), and frequency of physical activities (SPORT) were collected for the actor whose network and behaviour choices are being modelled (EGO) as well as for all of EGO’s social network contacts (ALTER). In a special social network survey EGO-centric network data were collected from each proband during the study centre visit using a specific computer-based social network questionnaire. The state of the art name generator concept was used to collect the social network data [30]. Three name generator questions were asked: (G1): With whom do you regularly discuss personal problems? (G2): To whom can you turn for help if you have a problem? (G3): With whom do you regularly discuss health-related (especially weight related) problems? For all ALTER mentioned by EGO in response, EGO was asked for their biological sex, age, education, and profession. In a next step EGO was asked to characterize ALTER by (A) ALTER-BMI measured in five categories (1–5) ranging from very slim to very fat; (B) Nutrition knowledge (ALTER-KNOW): 1 = very low, 2 = low, 3 = average, 4 = good, 5 = excellent; (C) Nutritional attitude (ALTER-AT): 1 = food is mainly convenience, 2 = diet has to balance health and convenience aspects, 3 = diet has to be mainly healthy; (D) Frequency of sport activities (ALTER-SPORT) longer than 30 min: 1 = never; 2 = 1–2 per month, 3 = 1 per week, 4 = several times per week; 5 = every day; (E) Diet behaviour (ALTER-DIET): it is asked how often ALTER has adopted a specific diet to lose weight: 1 = never, 2 = 1 time, 3 = 2–3 times; 4 = 4–5 times, 5 = > 5 times. EGO was also asked about the strength, length, and importance of the relation with ALTER. EGO was also asked to describe the pairwise relations of the ten most important individuals mentioned on a 3 point scale with 0 = do not know each other, 1 = know each other, 2 = know each other very well [30]. Data were calculated as a different network multiplier (NET-Z). NET-Z measured the field strength of different health-relevant behaviours and attitudes (Z = KNOW, DIET, BMI, AT, SPORT) which are prevalent in EGO’s social network and operating on EGO [31]. A possible bias of the method could be that EGO wouldn´t be able to exactly answer the questions regarding dietary behaviour, nutritional knowledge of a friend. Therefore, the answer could be influenced by EGOs own perception and attitudes.
Follow-up 1 (2016–2020)For follow-up 1, the data collection changed from invited visits at the study centre to visits at the general practitioner. The 1811 baseline cohort subjects were invited to participate in follow-up 1 and 45.3% (n = 820; ROG = 620 and MIG = 200) agreed, whereas 54.7% (n = 991) declined to participate in follow-up 1 (see Fig. 2 for details). The popgen biobank attempted to locate persons who had moved by making inquiries at the residents' registration offices. The first 5-year follow-up was completed in 2020.
Data collectionParticipants in the baseline cohort were asked if they were willing to participate in follow-up after 5 years (for more details please see Fig. 2). Both the former participant and his general practitioner received an information letter from the popgen biobank with information regarding the follow-up. With this letter, participants at the same time received a stool (for native stool sample) and blood collection kit (2 times serum) with the corresponding SOPs for the collection procedure while the general practitioner received only an identical blood collection kit (2 times serum). The collected biomaterials were labelled with an individual barcode and returned to the biobank according to the instructions in the collection cover letter. The blood samples were delivered to the study centre within 2 days (Table 1). Participants were also asked to complete the medical questionnaire, which was then returned by post. In this questionnaire the participants should state their height and also weight and they were asked questions regarding their health status, medication intake and nutrition (Table 3). All participants were informed about the nature of the study and the study procedure including biomaterial sampling and data handling. All participants had the appropriate time to consider whether they wanted to take part in the study after being informed. Participants were also informed that if they had any questions, they could ask the principal investigator at any time during an interview about the nature of the study and then decide whether they wanted to participate in the study. Participants were also informed that they could withdrew from the study at any time without giving reasons. After that procedure, all participants who provided written informed consent were included into the follow-up 1 part of the FoCus study. Participants were also asked for their consent to be contacted in the future for further follow-up visits. The follow-up was an addition to the first approval of the local ethics committee of the Kiel University (A156-03/Date 2011/07/28).
留言 (0)