
記住我


During the study period, 42 pediatric patients with spinal cord tumors were diagnosed, excluding non-biopsied patients with known Neurofibromatosis type 2. Diagnosis of sLGGs was made in 23 patients; 12 patients were diagnosed with ependymoma, and four patients with ATRT or other entity (Fig. 1a). Retrospective evaluation of the spinal cord tumor cohort revealed discordance between histology and the clinical course of the disease in three patients. Additional testing done in 2 ependymoma patients with atypical clinical course revealed rather glial tumors with ependymal features. Furthermore, one long-term surviving patient with an inoperable tumor initially described as anaplastic astrocytoma showed rather low-grade biology of the tumor with multiple progressions over many years of follow-up. In this particular patient, molecular studies revealed NTRK2 fusion and confirmed a glial origin of the tumors with low-grade behavior. Therefore, these three patients were added to the sLGGs group in this article to a total number of 26 patients (Additional file 2: Table S2; sLGG_01—sLGG_26), representing 7% of all institutional pediatric LGGs (total number = 350). Median age at diagnosis for the sLGGs group was 4.55 years (range from 1.15 to 17.54 years). Histologically, the sLGGs group comprised predominantly of pilocytic astrocytoma, diffuse astrocytoma, and ganglioglioma.
Fig. 1
a Overview of the total number of 42 spinal cord tumors diagnosed within 2000–2021. b Pie of pie demonstrates three molecular alteration groups in sLGGs; tumors driven with canonical BRAF fusions, non-canonical BRAF fusions, and non-BRAF alterations. c Oncoplot summarizes the relation of demographic (sex, age), clinical (progression, survival), and molecular-pathology data (histology, driver alteration, CDKN2A status), d Comparison of the molecular alterations, anatomical location, and extent of the tumors. The position of vertical lines shows the anatomical location of the tumor and the length of vertical lines outlines the levels of the spinal cord affected by each tumor sample. Molecular subtypes are shown in colors. On the left side are displayed common KIAA1549:BRAF fusions (pink) in contrast with the right side where are rare KIAA1549:BRAF fusions (yellow), a novel type of KIAA1549:BRAF fusion (red), non-KIAA1549:BRAF fusions (green) and non-BRAF alterations (blue)
Comprehensive genomic analysis uncovered a novel and rare alterations within the MAPK pathwayComprehensive genetic analysis consisting of Sanger sequencing, MLPA, and RNA sequencing was employed to determine the genetic landscape of pediatric LGGs. Oncogenic driver alterations were detected in 93% (n = 24) of patients; no alterations were detected in two patients where analysis failed due to insufficient tissue quality. Alterations found across sLGGs could be classified into two groups (Fig. 1b: 1) BRAF alteration consisting of KIAA1549:BRAF fusions (75%) with the high occurrence of rare and novel fusion variants, and non-KIAA1549:BRAF fusions (8%), 2) non-BRAF alterations (17%). Surprisingly, no case harboring BRAFV600E or H3F3A/HIST1H3B mutation was identified. We also evaluated the presence of the secondary alterations and found two cases of CDKN2A homozygous deletion in non-BRAF tumors. (Fig. 1c) Furthermore, pathogenic MET and EGFR variants were detected in two KIAA1549:BRAF cases.
A novel variant of KIAA1549:BRAF fusion (ex10:ex9) was identified using RNA sequencing in four cases (Fig. 2a). Rare types of KIAA1549:BRAF fusions (ex13:ex9, ex13:ex11, ex16:ex11, ex15:ex11) were identified in further 21% sLGG patients. Non-canonical BRAF fusions were detected in two patients; accounting for BCAS1:BRAF and GNAI1:BRAF. Two independent methods verified those rare and novel BRAF fusions using RT-PCR with specific primers and chromosome 7q34 duplication using MLPA.
Fig. 2
a Novel KIAA1549:BRAF fusion variant—ex9:ex10. The diagram shows an in-frame fusion gene incorporating the kinase domain of BRAF oncogene. b MRI images demonstrate similarities in the anatomical location of sLGGs in patients with detected novel KIAA1549:BRAF ex9:ex10 fusion variant. Tumors are delineated with green line
Anatomical distribution of the genetic alterations (Fig. 1d) interestingly showed KIAA1549:BRAF ex10:ex9-positive tumors located in the upper half of the spinal cord with partial medulla oblongata involvement in two cases (two cases in the cervical spine (C1–C7), one case in the cervical and upper thoracic spine (C2–T2), and one in the upper thoracic spine (T2–T7) (Fig. 2b). To evaluate the frequency of the KIAA1549:BRAF ex10:ex9 fusion variant, the cohort was expanded using 205 institutional cases of intracranial pediatric LGGs of various locations with known molecular drivers (Additional file 3: Fig. S1). Among more than 50 cases with detectable KIAA1549:BRAF, no case harbored an ex10:ex9 variant suggesting exclusive occurrence in the spinal cord.
Non-BRAF alterations were detected in four tumor samples consisting of CLIP2:NTRK2, KANK1:NTRK2, RAF1:QKI, and KRAS Q61H. The young age of three years and under at diagnosis characterized this group of patients. This group's histological appearance was not typical for LGG, and molecular testing helped refine the diagnosis. CLIP2:NTRK2 case was diagnosed as an anaplastic astrocytoma grade 3. Despite HGG histology, the presence of CDKN2A homozygous deletion, and multiple progressions, the patient was alive 15 years from the time of diagnosis. Pathologists reported two cases (KANK1:NTRK2 and RAF1:QKI) as ependymomas, but these tumors were reclassified as low-grade glioma due to the clinical course, underlying molecular alteration, and methylation profile. Based on the molecular profile, the case with KANK1:NTRK2 that also harbored CDKN2A homozygous deletion was treated with a radiation-sparing approach using chemotherapy only as first-line therapy. Patient with sLGG harboring RAF1:QKI underwent subtotal resection followed by careful observation. KRAS Q61H mutated case had histology of low-grade glioneuronal tumor (LGNT), and the patient was observed only after partial resection.
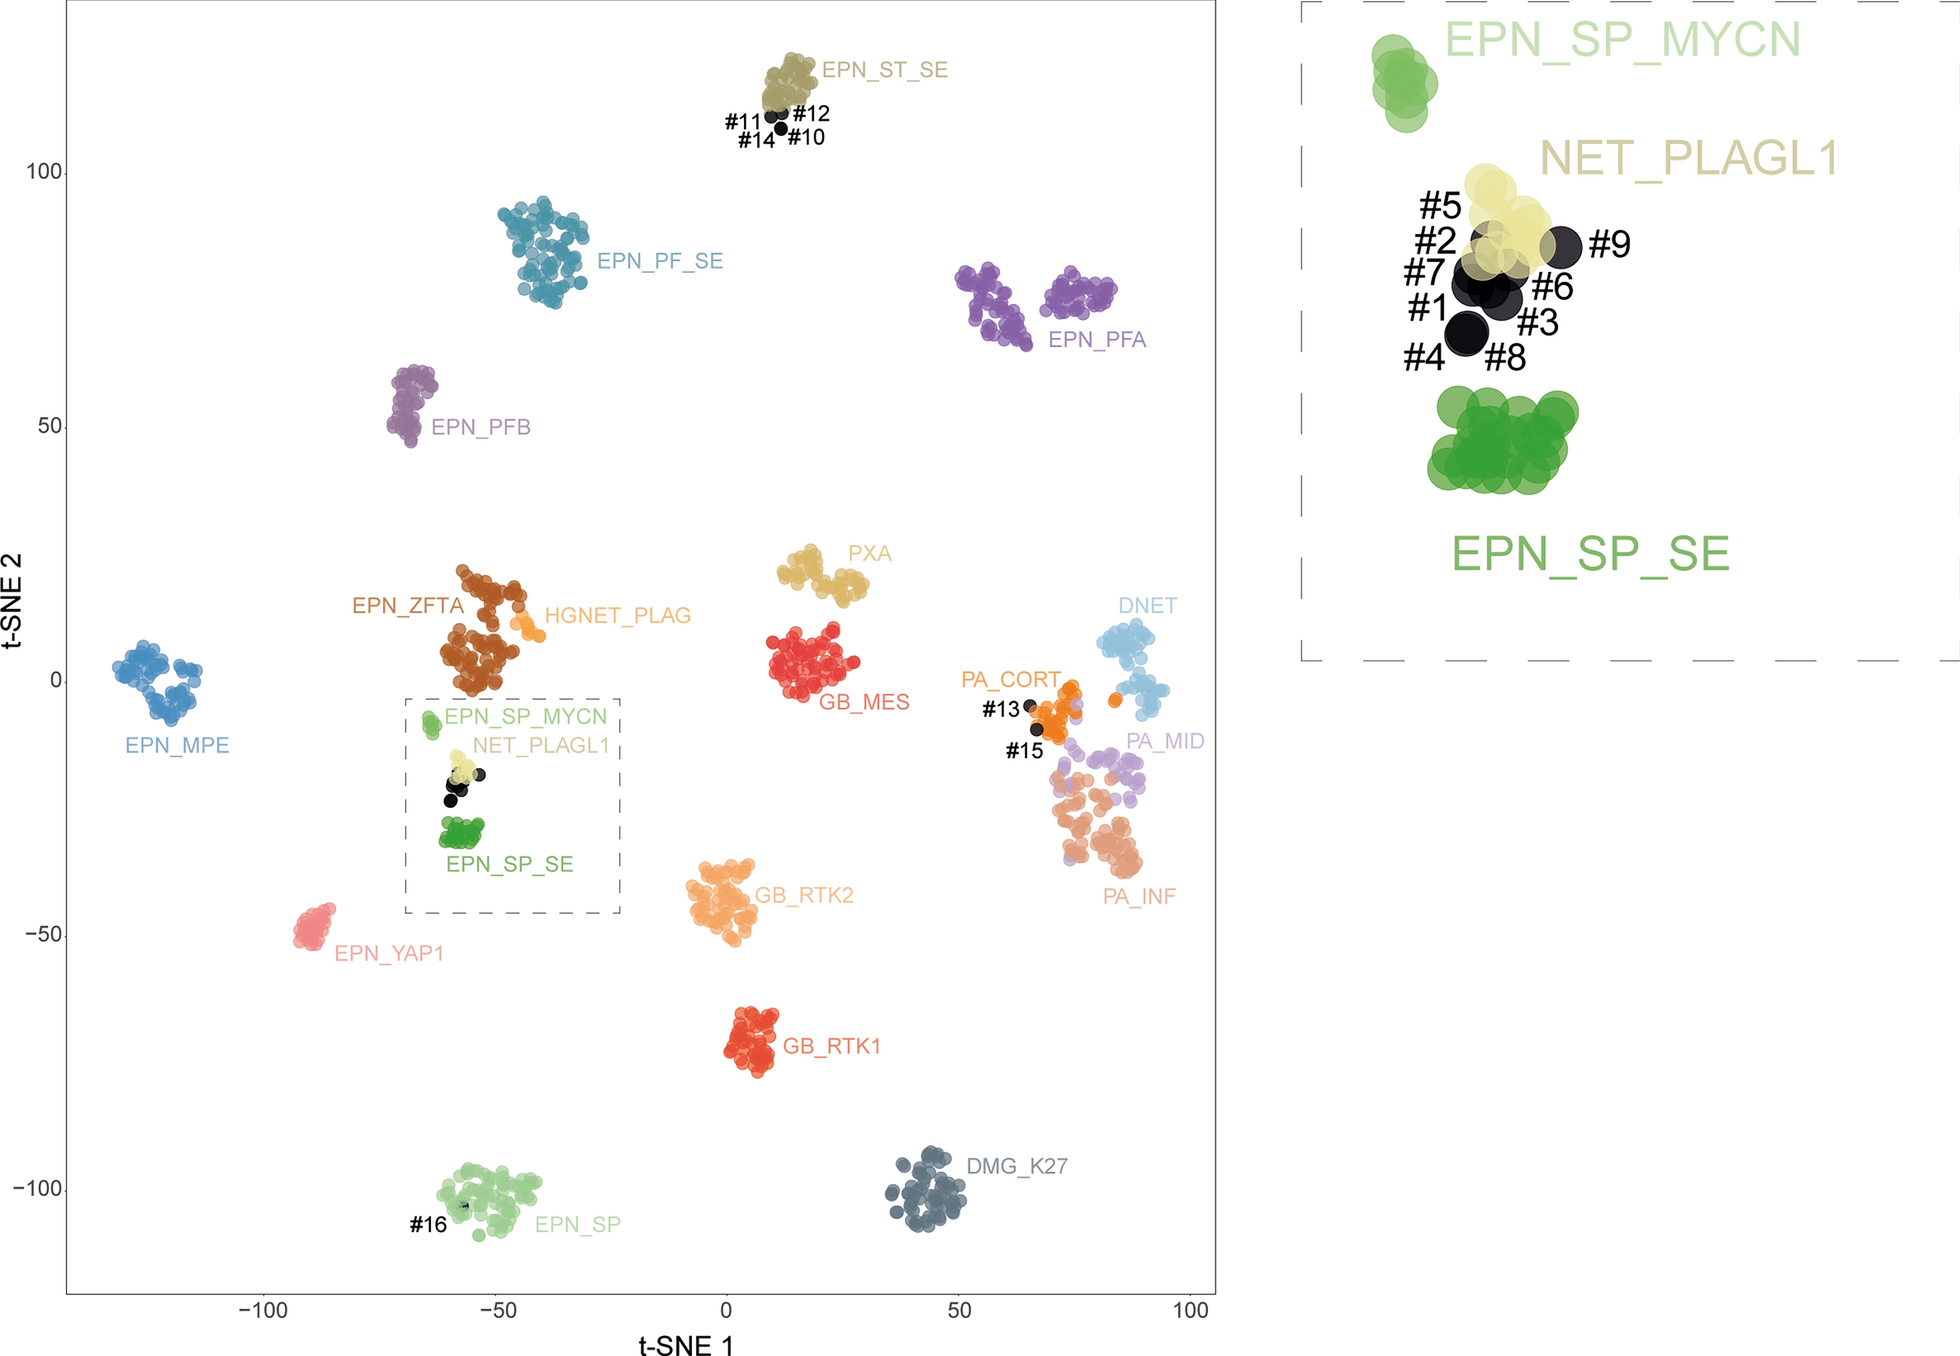
Methylation profiling revealed significant intertumoral heterogeneity among sLGGsThe current version (v12.5) of the Heidelberg methylation classifier does not provide any methylation class specific for spinal cord gliomas in contrast to spinal cord ependymomas. Therefore, we performed methylation profiling to evaluate how would sLGGs be classified based on the epigenetic features and to discern intertumoral heterogeneity. The analysis was performed using publically available Heidelberg classifier v12.5. Out of 22 patients (91.6%) with sufficient tissue available, 12 tumors (55%) were predicted as pilocytic astrocytoma, subclass posterior fossa (PA-PF) despite variable calibrated scores (calibrated scores (CS) 0.35–0.99). Three tumors (14%) with 1p deletion matched with diffuse leptomeningeal glioneuronal tumor (DLGNT), methylation class 1 (DLGNT – MC1) (two CS 0.99, one CS 0.25). One anaplastic astrocytoma with CLIP2:NTRK2 fusion was classified as anaplastic pilocytic astrocytoma (CS 0.62), currently also known as high-grade astrocytoma with piloid features (HGAP). The other NTRK2 fused glioma (KANK1:NTRK2), originally diagnosed as ependymoma, was classified as pleomorphic xanthoastrocytoma (PXA) (CS 0.90). One case (QKI:RAF1) was clustered with a subtype A of glioneuronal tumors (CS 0.99). One case (KIAA1549:BRAF ex10:ex9) was classified as desmoplastic infantile ganglioglioma / desmoplastic infantile astrocytoma (CS 0.59). The remaining three tumors (14%) matched with control tissue most probably due to low tumor tissue content. Moreover, t-SNE analysis using a previously published reference cohort was performed to further refine the methylation class prediction. As classified by v12.5, significant proportion of the samples clustered nearby PA-PF cluster. They seemed to be forming a separate cluster suggesting a possible distinction from posterior fossa pilocytic astrocytoma. Remaining samples clustered with DLGNT, GNT, PXA, and other clusters as predicted with the classifier (Fig. 3).
Fig. 3
T-SNE plot demonstrates the intertumoral heterogeneity among sLGGs. Prague samples (large red dots) are displayed among cases relevant methylation classes. This figure displays a close-up of the t-SNE with the whole reference cohort (see Additional file 4: Fig S2)
Clinical outcome and exploitation of molecular targetsAt a median follow-up of 6.96 years (IQR: 3.42–12.22), 5-year progression-free survival was 67.3% (95% confidence interval [CI], 50.8–89.1%). Overall survival rate at 5 years was 95.2% (95% [CI], 86.6–100.0%) (Fig. 4a). Infants of three years and younger fared significantly worse compared to those older than three with 5-year PFS 37.5% (CI 95%, 16.2–86.8%) and 85.9% (CI 95%, 69.5–100%), respectively (p < 0.001) (Fig. 4b) Three patients died of the disease 15, 10, and two years after diagnosis respectively due to the progressive disease, regardless of the histological grade or molecular alteration (one with CLIP2:NTRK2, one without known driver alteration, and one with KIAA1549:BRAF ex10:ex9 variant).
Fig. 4
Kaplan Meier survival analysis. a PFS and OS of the cohort. b Significantly worse PFS 37.5% (CI 95%, 16.2–86.8%) of younger children compared to PFS 85.9% (CI 95%, 69.5 to 100%) in older children (p < 0.001)
Based on molecularly identified targets, four patients received targeted therapy using MAPK pathway inhibitors. Three patients with KIAA1549:BRAF fusion were treated with MEK-inhibitor trametinib. According to the volumetric measurements, one of the patients (sLGG_15) responded with stable disease, and two patients (sLGG_06 and sLGG_07) exhibited partial responses (reduction of 51% and 61%) that were achieved after 5 and 8 months, respectively. Patient (sLGG_22) with CLIP2:NTRK2 fusion was treated with TRK inhibitor larotrectinib with quickly induced volume reduction, not meeting partial response (40%), detectable on magnetic resonance 54 days after the therapy initiation (Fig. 5). The radiological volume reduction was accompanied by significant clinical improvement with no remarkable drug-related toxicity. Unfortunately, tumor progression accompanied by clinical decline was detected after 22 months of targeted therapy. After another five months, the patient died due to the tumor progression to the brainstem. DNA sequencing from autopsy material did not reveal any point mutations in the NTRK1/2/3 kinase domain; thus, the mechanism of acquired resistance remained unknown [10].
Fig. 5
Radiological response to the targeted therapies. The white line (a.1) indicates tumor volume before initiation of NTRK inhibitor in patients sLGG_22, and (a.2) shows a 40% tumor volume reduction after 54 days of therapy. Likewise, the white line (b.1) shows tumor volume before initiation of MEK inhibitor in patient sLGG_07, and (b.2) shows a 61% tumor volume reduction after eight months of therapy
留言 (0)