
記住我


The study was approved by the Bioethical Commission of Medical University of Silesia in Katowice (decision no. PCN/CBN/0052/KB/77/22; approval date: 5 May 2022).
Sample collectionThe intervertebral discs were collected during 9 medico-legal autopsies. The post-mortem interval ranged between 2 and 10 days (7.0 ± 2.9 days). Six samples were collected from charred bodies (males) and three from charred spines’ fragments (Table 1). All tissue samples were stored at − 20 °C until further processing.
Table 1 Death circumstances, age, gender of the cadavers and DNA concentrations, and DNA degradation index of the intervertebral discs sampled from nine charred cadavers (cases 1–6) or charred body fragments (cases 7–9). The results are presented as mean ± standard deviationIn five cases, the charred body was revealed in the car wreckage (Figs. 1 and 2). In one case, the charred body was revealed in the rubble of a burnt down and collapsed house after a gas explosion (Fig. 3). The three spine fragments were revealed during the site examination after an uncontrolled nitroglycerin explosion (Fig. 4). The victims’ age ranged from 8 to 63 years (43.4 ± 16.0 years).
Fig. 1
The charred corpse reveal site (case 1): a the interior of the trunk compartment, after lifting the trunk door and a fragment of the trunk floor — the red arrow points to the gas tank, b charred skull with the body front, c and e charred skull on both sides, d the interior of the vehicle with the visible corpse after removing the roof
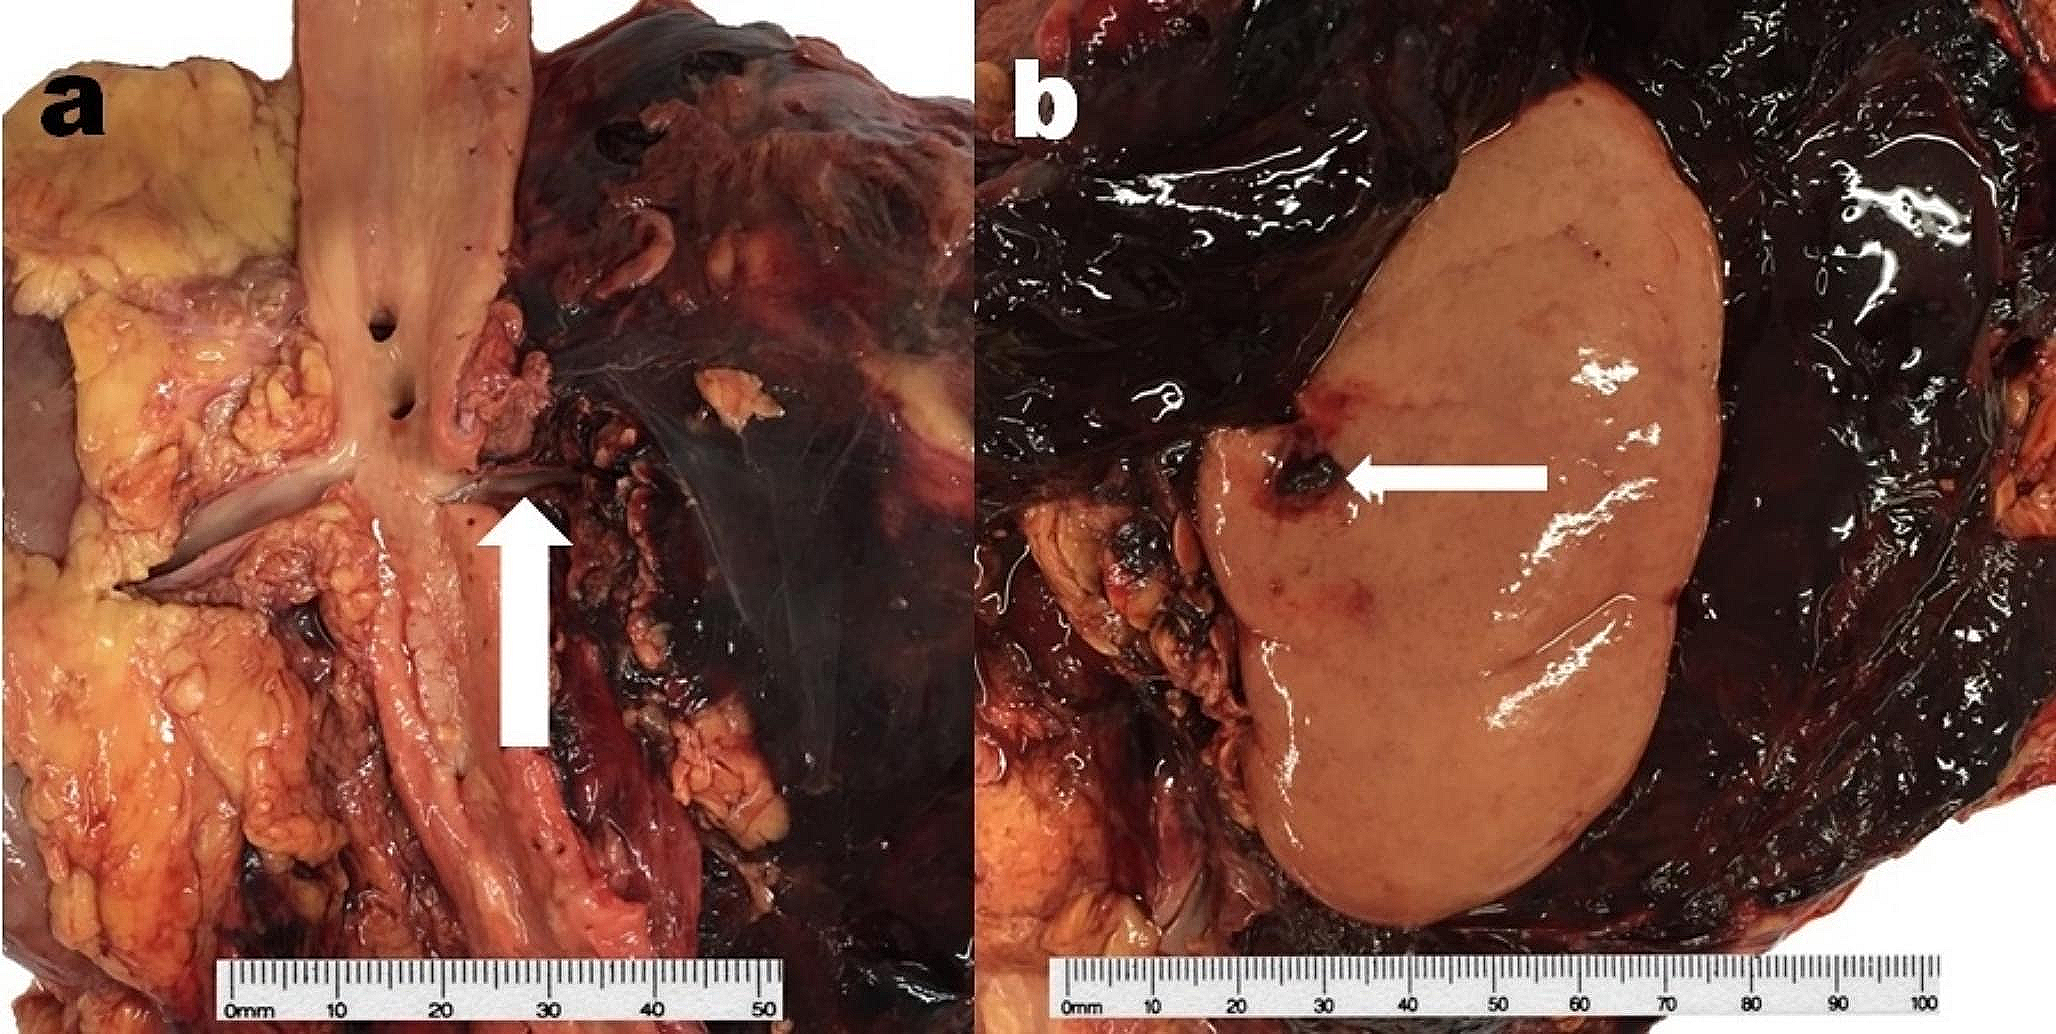
Fig. 2
The charred corpse reveal site and internal examination (case 2): a side view of the car wreckage; b rear view of the burnt vehicle — the red arrow marks the LPG fuel tank, c the interior of the vehicle with charred human remains, d charred human remains, e fragment of the burnt skull vault revealed at the incident site and delivered to the dissecting room together with the corpse, f visual inspection of the charred corpse’s spine during the forensic medical autopsy — the technician indicates the location (L1-L2) of the fibrous ring sampling for genetic testing
Fig. 3
The corpse revealed at the fire site and a construction disaster after a gas explosion in a single-family house (case 6): a charred body, b the location of the intervertebral disc sampling
Fig. 4
Three charred tissue fragments with the spine parts revealed after an uncontrolled nitroglycerin explosion: a case 7, b case 8, and c case 9
Hematoxylin–eosin histochemical stainingAnnulus fibrosus fragments were collected during forensic autopsy from the cadaver (case 1) or from charred spine fragment (cases 7–9). The discs were cut with a sterile surgical scalpel from the L1-L2 lumbar region due to the greater thickness and ease of preparation compared to the spine upper sections. The external surface of the collected fragment and contaminations were cleaned also with a sterile surgical scalpel. Tissue fragments were fixed in 4% formalin for 48 h and then fixed in a paraffin block. The tissue was sliced into 3-µm-thick samples on a microtome. The hematoxylin–eosin (H&E) histological staining [15, 16] was performed to visualize the cell nuclei (Fig. 5) in the examined tissue in order to confirm that the genetic test is well-founded.
Fig. 5
Fibrous cartilage of a fibrous ring of an intervertebral disc taken from a charred corpse (case 3): a magnification 10 × , b magnification 20 × . The scale is 100 µm. Purple parts are cell nuclei stained with hematoxylin–eosin
DNA extractionClean annulus fibrosus fragments (Fig. 6) were cut into 3 × 2 mm pieces with a sterile scalpel blade (Fig. 1b). DNA isolation was performed using a Sherlock AX kit (A&A Biotechnology, Poland) according to the manufacturer’s instruction. The final volume of the DNA solution used was 50 µL.
Fig. 6
Fragments of a fibrous ring collected from a charred corpse (case 3): a fragments with visible soot traces, b the other side of one of the fragments presented in photo a
Real-time PCRThe quality and concentration of DNA samples were evaluated in triplicate using a Quantifiler™ Trio DNA Quantification kit (Applied Biosystems, USA), HiD v. 1.2 software, and 7500 Real-Time PCR System (Applied Biosystems, USA). The qualitative analysis was performed using sequences for T. Large (214 bp) and T. Small (80 bp) autosomal chromosomes and the Y chromosome (75 bp). The degradation index was calculated based on the ratio of T. Small to T. Large autosomal sequences. All procedures were executed according to the manufacturer’s recommendations.
Multiplex PCR and capillary electrophoresisPCR was performed using a PowerPlex ESX 17 and PowerPlex HS 16 kit (Promega Corporation, USA) in a Gene Amp PCR System 9700 thermocycler (Applied Biosystems, USA). Amplification products were separated towards DNA CC5 ILS 500 and CC5 ILS 600 standards (Promega Corporation, USA) using a 3130 Genetic Analyzer (Applied Biosystems, USA). The following loci were analyzed: AMEL, D3S1358, TH01, D21S11, D18S51, D10S1248, D1S1656, D2S1338, D16S539, D22S1045, VWA, D8SS1179, FGA, D2S441, D12S391, D19S433, SE33, D5S818, D13S317, D7S820, TPOX, CSF1PO, Penta D, and Penta E. Additionally, alleles from chromosome Y were determined using a Yfiler test (Applied Biosystems, USA). PCR products were analyzed in a 3130 Genetic Analyzer (Applied Biosystems, USA). Genotypes were generated using Gene Mapper ID v3.2 software (Applied Biosystems, USA). Multiplex PCR and capillary electrophoresis procedures were executed according to the manufacturer’s recommendations.
Statistical analysisThe likelihood ratio (LR) was calculated using DNA Stat software v. 2.1 (Laser Systemy Informatyczne S.A., Poland) [17]. The remaining analyses were done using Statistica, version 13 (TIBCO Software Inc., Palo Alto, USA). Data distribution was tested using the Shapiro–Wilk test and quantile–quantile plot analysis. Data with normal distribution were presented as mean ± standard deviation. Linear regression analysis was used to assess the relationship between the analyzed parameters.
留言 (0)