
記住我


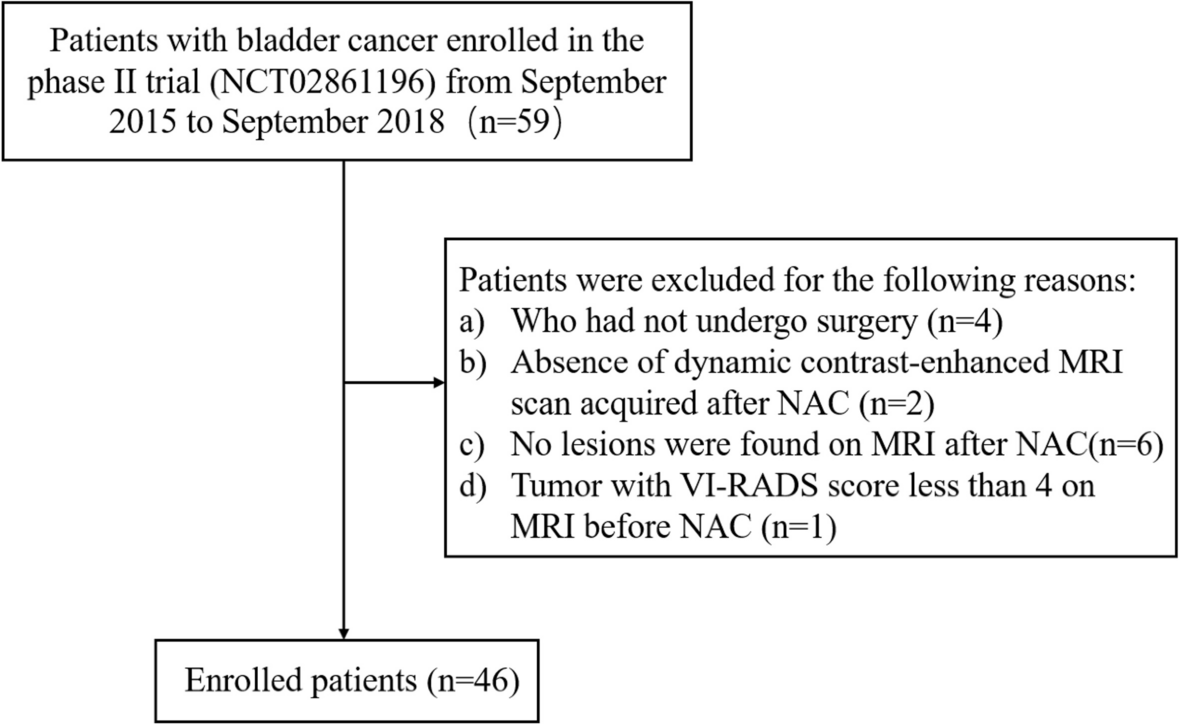


The study cohort comprised of 101 enrolled patients, from which 60 patients with 241 liver lesions underwent LT. 26 patients with 136 liver lesions were excluded due to previous HCC therapy. The final patient cohort (Fig. 3) comprised of 115 non-treated liver lesions in 34 patients with a mean age of 66 years (age range 55–73 years). Chronic HCV was the most common cause of liver disease. Majority of patients underwent deceased donor transplant. A total of 115 liver lesions (103 HCC, 3 non-HCC malignancy and 9 benign lesions) were noted at histopathology, with per-patient lesion count of 1 to 15 and lesion size range of 2 to 35 mm. Reader 1 (R1) and Reader 2 (R2) identified 78 and 80 lesions, respectively, on EOB-MRI while 46 and 42 lesions were identified, respectively, on CECT.
Fig. 3
Patient enrollment and study flowchart
Diagnostic Performance of Scoring Guidelines with EOB-MRI (Table 3)Table 3 HCC Sensitivity and Specificity with EOB-MRI for various guidelines. (Numbers represent Sensitivity/Specificity in percentages)The sensitivity for HCC diagnosis varied based on the HCC guideline, lesion size and visibility on imaging in reference to histopathology. Overall, significantly higher sensitivities were realised for both readers in the matched scenario compared to the real-world scenario.
In reference to all lesions > 1 cm on histopathology, the sensitivity for HCC diagnosis was significantly higher by LI-RADS 4 + 5 (63.1%), KLCA (60.7%) and APASL (59.5%) compared with LI-RADS 5 (35.7%) and EASL (32.1%) for R1. Similar trends were observed for R2, albeit without statistical significance. In reference to only imaging-visible lesions > 1 cm, LI-RADS 4 + 5 again had the highest sensitivity (98.1/81.0% for R1/R2), followed by KLCA (94.4/79.3% for R1/R2) and APASL (92.6/79.3% for R1/R2) with each demonstrating statistically significant differences versus EASL and LI-RADS 5 (Supplementary Table 4).
In reference to all lesions noted on histopathology regardless of size, similar trends were observed. LI-RADS 4 + 5 again demonstrated the greatest HCC sensitivity (68.0/52.4% for R1/R2) with statistically significant differences against LI-RADS 5 (29.1/28.2% for R1/R2) and EASL (26.2/28.2% for R1/R2). The next highest sensitivities for R1 were observed in APASL (63.1%) and KLCA (49.5%), which were significantly higher than LI-RADS 5 and EASL. For R2, similar trends were observed except that the differences between KLCA and, LI-RADS 5 and EASL, were not statistically significant. In reference to imaging-visible lesions only regardless of size, R1 had significantly higher HCC sensitivity for LI-RADS 4 + 5 (95.9%) compared to LI-RADS 5 (41.1%), EASL (37.0%) and KLCA (69.9%). LI-RADS 4 + 5 (75.0%) also demonstrated the highest sensitivity for R2, with statistically significant differences noted against LI-RADS 5 (40.3%) and EASL (40.3%). The next highest sensitivities in R1 were noted with APASL (89.0%) and KLCA (69.9%), which were significantly higher compared to LI-RADS 5 and EASL. APASL demonstrated higher sensitivity than KLCA (89.0% vs 69.9%, p = 0.047). Similar trends were observed with R2, with statistically significant differences between APASL (73.6%), and LI-RADS 5 (40.3%) and EASL (40.3%). KLCA did not demonstrate statistical significance against other guidelines (Supplementary Table 5).
The specificity for HCC across the guidelines varied 83.3–100% for R1 and 75.0–100% for R2. LI-RADS 5 and EASL provided a consistent specificity of 100% for R1, regardless of lesion size or visibility on imaging. The specificity for LI-RADS 5 and EASL for R2 ranged 80.0–91.7%. APASL and KLCA demonstrated the lowest specificity, ranging 83.3–100% for R1 and 75.0–80.0% for R2. The differences between specificities across the guidelines were not statistically significant.
Diagnostic Performance of Scoring Guidelines with CECT (Table 4)Table 4 HCC Sensitivity and Specificity with CECT for various guidelines. (Numbers represent Sensitivity/Specificity in percentages)The HCC sensitivities obtained by CECT with the scoring guidelines were generally lower compared to those with EOB-MRI. Similar to EOB-MRI, the diagnostic performance was higher overall for the matched-scenario compared to the real-world scenario.
In reference to all lesions > 1 cm, EASL showed the lowest sensitivity (15.1%) for R1 compared to the other guidelines, which all had the same sensitivity (28.0%). For R2, EASL again showed the lowest sensitivity (18.8%), while LI-RADS 4 + 5 demonstrated the highest sensitivity at 21.9%. If only imaging-visible lesions > 1 cm were included in the analysis, the sensitivity for R1 increased to 43.8% with EASL and 81.2% for the remaining guidelines. For R2, the sensitivity improved to 58.1% with EASL, which again remained the lowest, and 67.7% with LI-RADS 4 + 5, which remained the highest (Supplementary table 6).
For all lesions regardless of size, R1 had the lowest sensitivity with EASL (13.6%) and the highest sensitivities with LI-RADS 4 + 5 and APASL (31.1%). A similar trend was noted for R2 with EASL being the lowest (17.5%) and LI-RADS 4 + 5 being the highest (23.3%). If only imaging-visible lesions were included, for R1 the HCC sensitivity improved to 33.3% with EASL, still persisting as the lowest while increasing to 76.2% with LI-RADS 4 + 5 and APASL, which maintained the highest positions. For R2, the sensitivities improved to 47.4% with EASL and 63.2% with LI-RADS 4 + 5. Statistically significant differences in HCC sensitivities were observed for R1 in the imaging-visible lesions of all sizes between EASL, APASL and LI-RADS 4 + 5. No additional statistically significant trends were derived amongst the HCC sensitivities with CECT (Supplementary table 7).
The specificity for CECT was 100% with both readers for all the scoring guidelines, regardless of size cut-off or visibility on imaging. This was generally higher than EOB-MRI although there were no statistically significant differences across the guidelines.
Variation in HCC diagnosis between guidelines with EOB-MRI and CECT (Table 5)Table 5 Comparison of variances in HCC sensitivity and specificity across guidelines with EOB-MRI and CECT using Levene’s testThe standard deviations of HCC sensitivity and specificity with EOB-MRI and CECT across the various guidelines were compared for both readers. In terms of sensitivity, R2 demonstrated significantly greater standard deviation across the guidelines with EOB-MRI compared to CECT, regardless of lesion size or imaging visibility. Similar trend was observed for R1, with the exception of the imaging visible lesions > 1 cm and all lesions regardless of size groups wherein no statistically significant differences were noted. In terms of specificity, there was no variation across guidelines with CECT and all the standard deviations were significantly greater with EOB-MRI compared to CECT.
Transplant Allocation (Table 6)Table 6 Accuracy for simulated LT eligibility as per Milan criteria with EOB-MRI and CECT versus explant histopathology. (Numbers represent accuracy in percentages)The accuracy for simulated transplant eligibility based on MC across the HCC guidelines ranged between 82.4 – 94.1% with EOB-MRI and 73.5 – 79.4% with CECT for R1. For R2, the accuracy ranged 82.4 – 85.3% with EOB-MRI and 79.4 – 82.4% with CECT. Although there were no statistically significant differences in LT eligibility accuracies based on the HCC guidelines with both imaging modalities and either reader, the highest accuracy was obtained for LIRADS 5 for R1 with both EOB-MRI and CECT (94.1% and 79.4%, respectively). In comparison, R2 obtained highest accuracy for LI-RADS 5 and APASL with both EOB-MRI and CECT (85.3% and 82.4%, respectively).
Inter-reader agreement (Table 7)Table 7 Inter-reader agreements in terms of Kappa valuesThe inter-reader concordance between the two readers across various HCC guidelines ranged from fair to moderate (k = 0.30–0.43) for EOB-MRI and moderate to good (k = 0.54–0.70) for CECT [16].
留言 (0)