
記住我
The samples for this study were obtained from the Finnish middle-aged male participants of the Kuopio Ischaemic Heart Disease Risk Factor Study (KIHD). KIHD is an ongoing population-based prospective cohort study in Eastern Finland [25]. The baseline examination took place in 1984–1989. 2682 men aged 42–60 years (83% of those who were eligible) participated in the baseline examinations.
Dietary assessmentParticipants self-reported their dietary intake at baseline using a 4-day food record [26]. To ensure reporting accuracy, the participants received instructions on how to fill out the food record and a picture book containing a list of 126 foods and drinks typically consumed in Finland during the 1980s. Each item included a corresponding estimation of portion size based on household measures to ensure proper assessment and recording [27]. During a study visit, a nutritionist checked the completed food records with the participant to improve accuracy [25].
The definition of WG followed the definition by the HEALTHGRAIN project [28], including downstream products, such as pasta. The KIHD database does not include information on intakes of individual grains. In the mid-to-late 1980s in Finland, wheat and rye were the most commonly consumed grains, followed by oat, rice, and barley [29]. However, in the KIHD cohort, WG pasta or rice intake was very uncommon (Table 1). The calculation of food and nutrient intakes was performed using the NUTRICA® 2.5 software (Social Insurance Institution, Turku, Finland), based mainly on the Finnish database of the nutrient composition of foods.
Table 1 Baseline characteristics and dietary intake of study participants in each subsetSelection of samplesSerum samples and data for this study were taken from two independent subsets within the KIHD cohort. The discovery cohort (DC) was selected from a previous study on adherence to a healthy Nordic diet and incidence of coronary artery disease within a mean follow-up of 20.4 years (nDC = 364) [30]. The replication cohort (RC) was taken from a study investigating the association between egg consumption and the incidence of type 2 diabetes after a mean follow-up of 19.3 years [31]. From the original number of participants (n = 239), 39 participants were excluded, since they were already included in the DC (nRC = 200).
Collection of blood samples and other measurementsBlood samples were collected during the baseline examination visits in 1984–1989. Participants were instructed to abstain from alcohol consumption for 3 days and from smoking and eating for 12 h before examination visits between 08.00 and 10.00 on Tuesdays–Thursdays [32]. After 30-min rest in supine position, venous blood samples were drawn without a tourniquet [32]. Serum was separated by centrifugation at 2000g for 10 min (20 °C) after coagulation at room temperature for an hour [32]. The obtained serum samples were stored at − 80 °C until LC–MS analysis in 2016 for RC and 2018 for DC.
Body mass index (BMI) was calculated as body weight (in kg) divided by the square of height (in m2). The recording of habitual leisure-time physical activity [33], smoking and alcohol consumption in the past 12 months and measurement of blood pressure [34] have been described previously.
Metabolomics analysisSample randomization and preparation steps have been described in previous publications [30, 31]. After the samples were thawed entirely on ice water for approximately 3 h, 100 µL of each sample was mixed with 400 µL of acetonitrile then pipetted into 96-well plate filter plate layered with 96-well plate. Centrifugation (700g, 4 °C, 5 min) was performed to obtain protein-free filtrate [35] which was directly used for LC–MS injection.
Data acquisition for nontargeted metabolic profiling analysis was performed at the LC–MS metabolomics center (Biocenter Kuopio, University of Eastern Finland). Two different LC–MS systems were employed for the DC and RC [30, 31]. The LC systems for the DC and RC were Vanquish UHPLC (Thermo Fischer Scientific) and 1290 Infinity Binary UPLC (Agilent Technologies), respectively. Both systems utilized two chromatographic techniques: reversed-phase (RP) (Zorbax Eclipse XDB C18, 2.1 × 100 mm, 1.8 μm, Agilent Technologies, Palo Alto, CA, USA) and hydrophilic interaction chromatography (HILIC) chromatography (Acquity UPLC® BEH Amide 1.7 µm, 2.1 × 100 mm, Waters Corporation, Milford, MA, USA). The injection volume was 1 µL for each sample. A pooled sample from all biological samples per experiment was injected at the beginning and after every 12 samples throughout LC–MS run for quality control and drift correction.
The MS systems used Q Exactive Focus Orbitrap MS (Thermo Fischer Scientific) for DC and Agilent 6540 Q-TOF (Agilent Technologies) for RC [30, 31], both with high resolution and accuracy. The data were acquired in both positive (ESI+) and negative (ESI−) electrospray ionization modes. At the end of the analysis, data-dependent MS2 were acquired for each mode. Further information about the LC–MS instruments setup and data acquisition parameters can be obtained from the previous publications [30, 31].
Discovery cohortPeak-picking was performed using MS-Dial version 4.20 [36] after converting the raw files to.abf format using Abf Converter. The data were collected with a tolerance of 0.01 Da for MS1 and 0.025 for MS2. Peak detection was performed with a minimum peak height of 10,000 for DC and 1000 for RC due to the different detection units. Preliminary identification was performed in MS-DIAL [36] against the uploaded in-house library with an identification score cutoff of 70% and accurate mass tolerance of 0.015 Da for MS1 and 0.05 for MS2. The tolerance for peak alignment was 0.015 Da and 0.15 min. After alignment, the raw peak area from each mode was then exported to .xlsx files. This data matrix contained 36,584 features from RP−, 30,607 from RP+ , 25,871 from HILIC−, and 15,095 from HILIC+ , which then underwent data preprocessing.
All features were preprocessed using the R package notame (https://github.com/antonvsdata/notame) as previously described [21, 35]. The procedures allow correction of drift due to long LC–MS run sequence, missing values imputation, and removal of low-quality signals [35]. Following this procedure, we retained 2829 and 1438 features from HILIC, and 6260 and 6957 features from RP, in ESI + and ESI−, respectively. Thus, the combined data matrix comprised 17,484 features from 364 participants in DC. Before statistical analyses, the peak areas of the features were transformed using log-transformation, followed by normalization by mean-centering and scaling to unit variance.
Replication cohortThe metabolomics data of the RC underwent a similar preprocessing procedure as DC described above. One data file from RP+ was corrupted during the peak-picking procedure, so the feature alignment of RP+ was based on 199 samples. The removal of low-quality features yielded 14,110 features from 200 participants in RC, which underwent the same normalization procedures as in DC.
Statistical analysisDiscovery cohortThe selection of features for the identification step employed both multivariate and univariate approaches. Random Forest (RF) using the R package MUVR (https://gitlab.com/CarlBrunius/MUVR) that incorporates a repeated double cross-validation scheme was applied to unbiasedly select a set of molecular features ranked based on their importance to predict the total WG intake. Permutation tests (n = 40, p difference between actual and permutation models = 1.21e−14) were performed to ascertain that modeling results were not due to overfitting [37]. This variable selection procedure maximized the selection of all relevant features (max model), resulting in a selection of 130 metabolic features. These features were then fitted to a linear regression model (using the built-in lm function in R) with WG intake as the independent variable and the normalized metabolite feature as the dependent variable, followed by correction for multiple testing by false discovery rate (FDR). FDR < 0.05 was considered significant.
In addition to the feature selection using random forest, we also performed a partial Spearman correlation test to capture additional features that may not be selected by RF. The correlation test was performed between WG intake and peak area of all features after first regressing both WG intake and peak areas with confounders (age, BMI, leisure-time physical activity, smoking, and intake of alcohol and energy) using the built-in lm function. Residuals were then correlated using the built-in cor.test function in R. The cutoff of FDR < 0.005 was used to limit the annotation and discussion to a reasonable shortlist of likely relevant metabolites.
Replication cohort143 annotated metabolites in the DC (Supplementary Table 1) were checked if they were also detected in the RC. To estimate the RT of those features in RC, 46 metabolites with confirmed identity based on the mass-to-charge ratio (m/z), retention time (RT), and MS2 spectra from both DC and RC were fitted to a locally estimated scatterplot smoothing (LOESS) (Supplementary Table 2) using the built-in loess function in R. This number included some metabolites eluting at the range of RT uncovered by the relevant features as anchor points, although they were outside the scope of interest of the current study (Supplementary Table 2). The fitted LOESS was then used to predict (using the built-in predict function in R) the RT of the shortlisted features from DC without MS2 spectra in the replication cohort (RC).
Features with m/z tolerance of 5 ppm and RT tolerance of 0.5 min from either the RT in the discovery cohort (DC) or LOESS-predicted RT were added to the list of validated metabolites. In total, 61 metabolites with tolerance of mass-to-charge ratio (m/z) 5 ppm and retention time (RT) 0.5 min (Supplementary Table 2, Supplementary Methods) were found in the RC. Random forest was not applied to the RC, because RF did not seem to fit the current subset (Q2 = 0.03). The reason could be the selection criteria of the study population which were based on egg intake [31] and were not related to WG intake. Hence, these metabolites were then subjected to the same Spearman correlation and linear regression models as in the DC (Supplementary Table 3, Supplementary Methods).
Adjustment for potential confoundersBased on presumed causal relationships depicted in a directed acyclic graph [38] (Supplementary Fig. 1), variables associated with both WG intake as exposure and blood metabolome as outcome were identified as potential confounders. These selected confounders were age, BMI, leisure-time physical activity (kcal/day), smoking (estimated as cigarette packs per day multiplied by years of smoking), and intake of and alcohol (gr/week) and energy (kcal/day). In particular, energy intake was included as a standard multivariate model [39]. These confounders were adjusted for in partial Spearman correlations between WG intake and metabolic features and in adjusted linear models in DC. Both were followed by FDR adjustment. FDR < 0.005 for correlation analysis and FDR < 0.05 for the linear models were considered significant.
The same set of confounders were also adjusted for in the Spearman correlation and linear regression model in the RC, except for smoking, since only one RC participant smoked. FDR < 0.05 for either correlation or linear models was considered significant in the RC. All statistical analyses were performed using R version 4.0.3 [40].
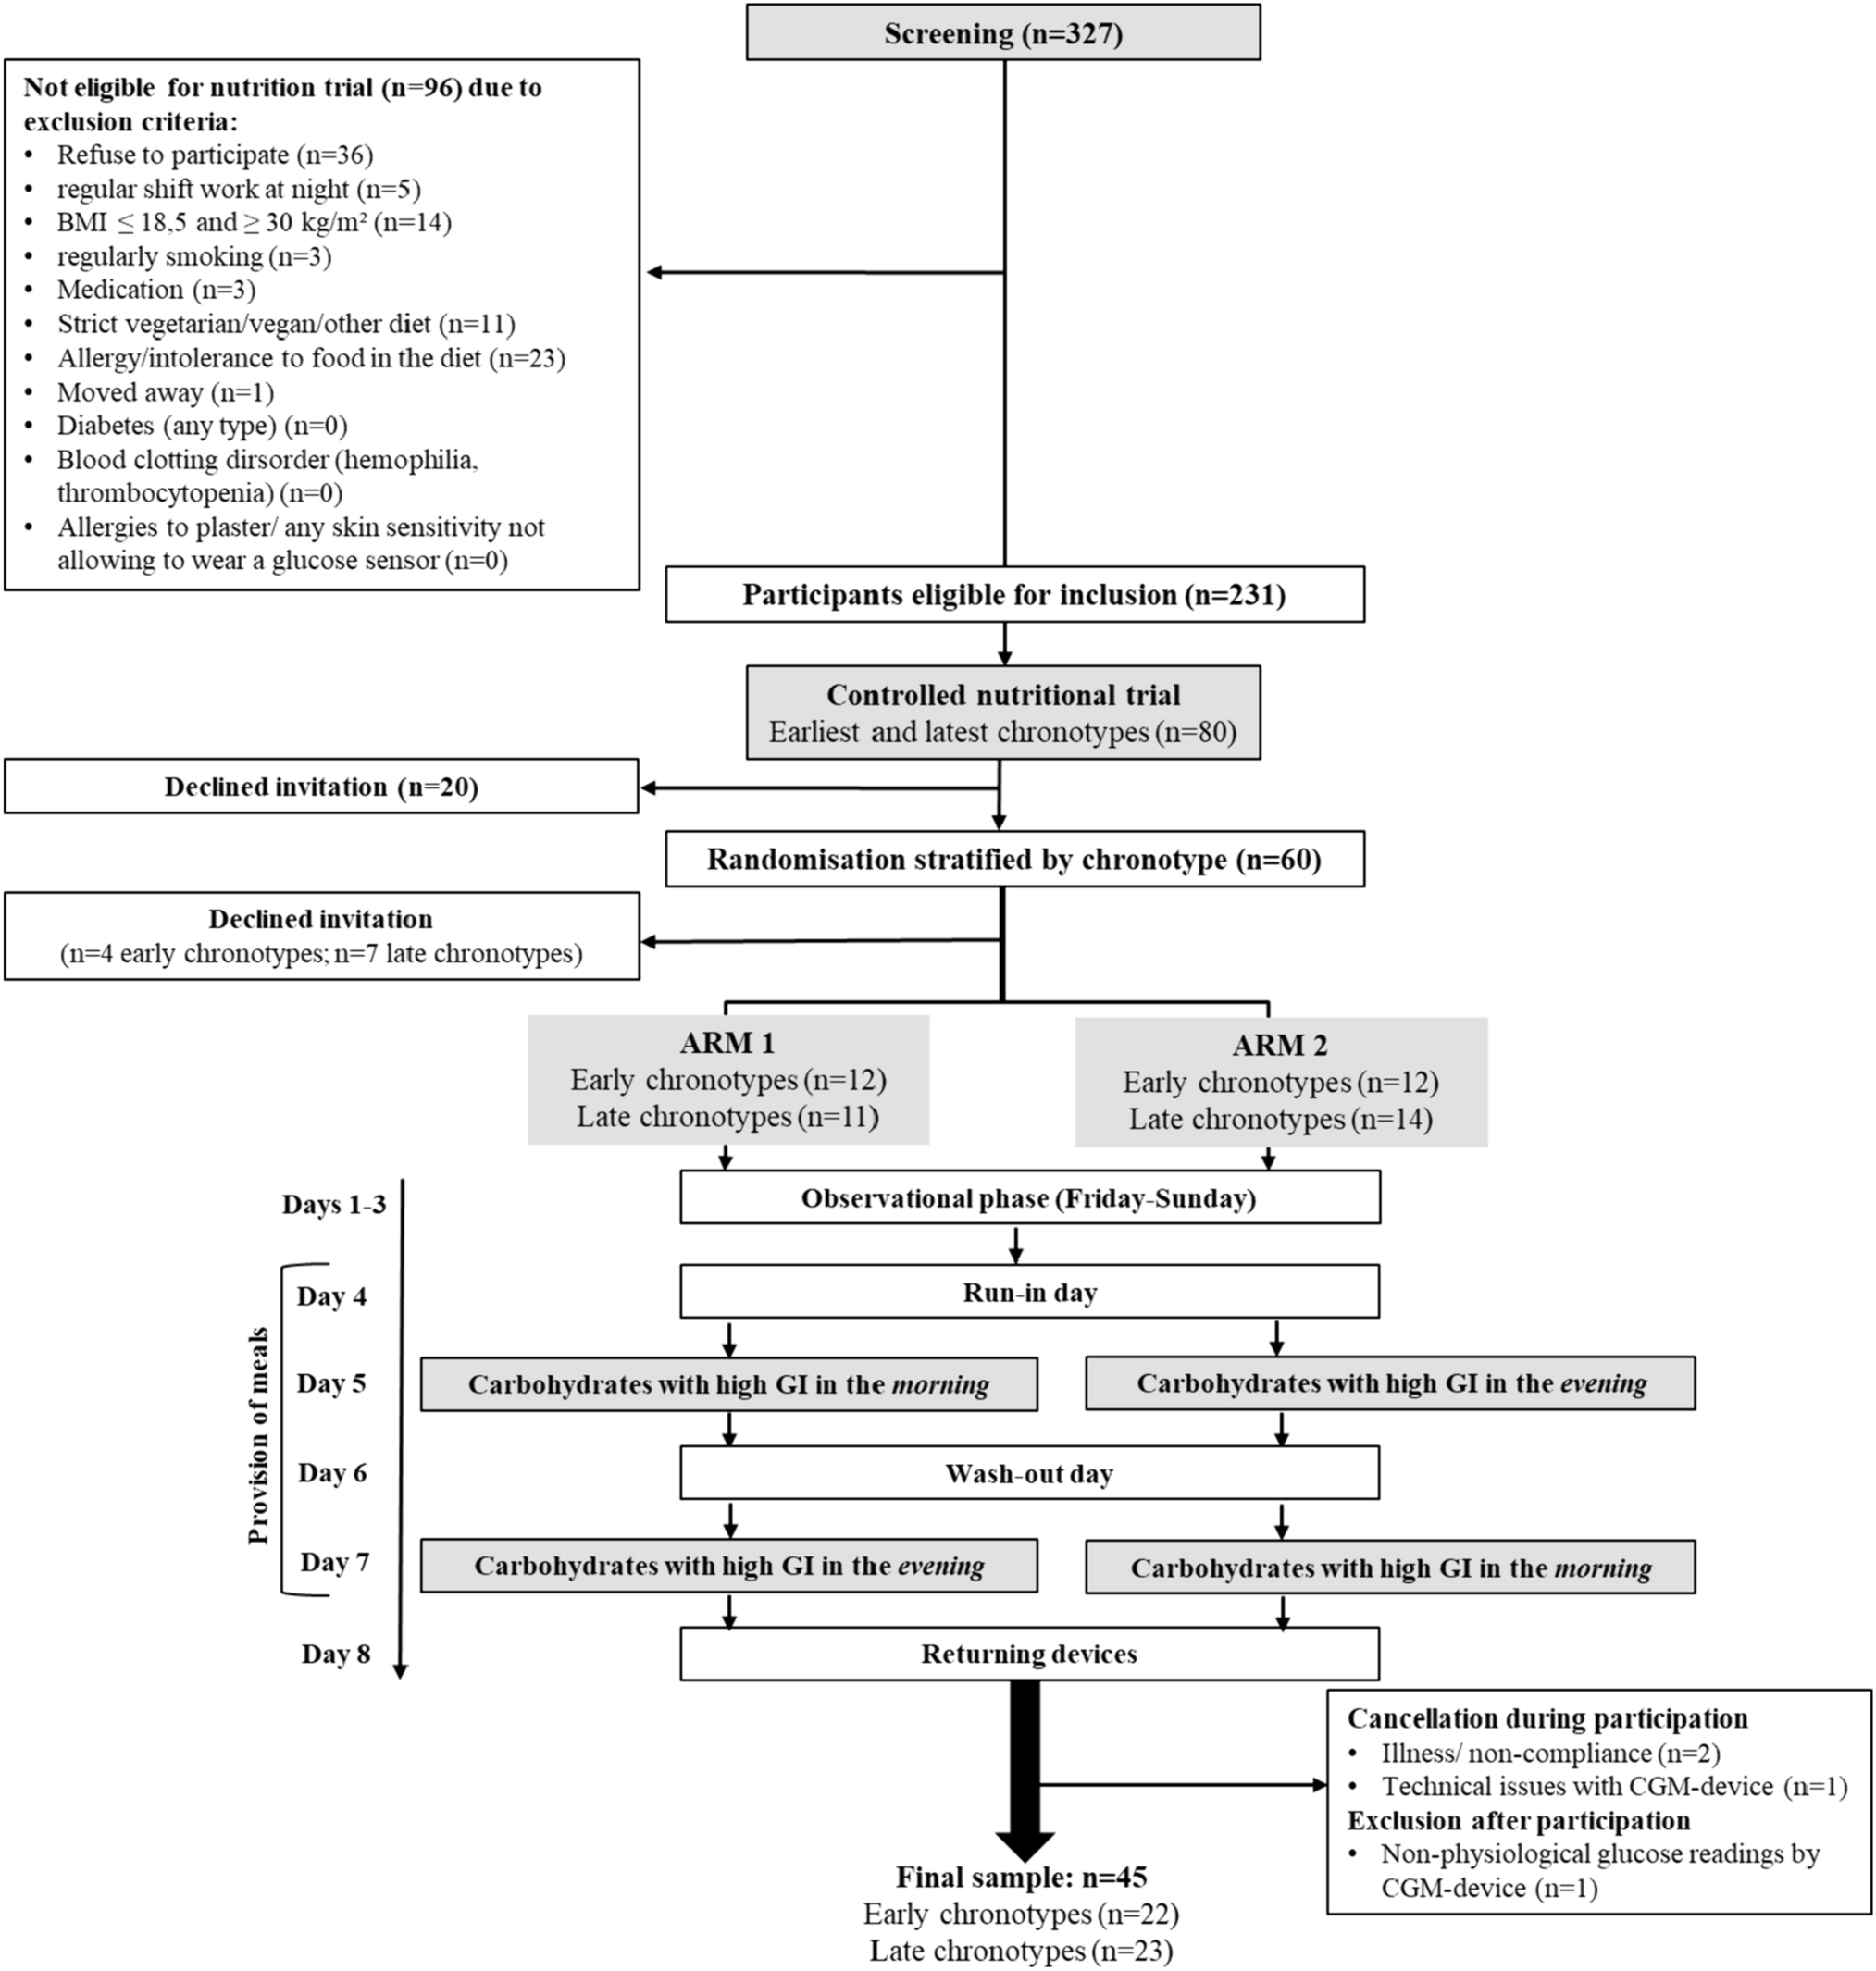
Compound annotationFeatures in the DC with FDR < 0.05 in linear modeling (n = 112) or FDR < 0.005 in correlation analysis (n = 245) were added to the shortlist for compound annotation (Fig. 1). The list was further narrowed down by limiting molecular mass < 1000 Da, RT 1–12 min for HILIC and 1–15.5 min for RP modes, leaving 270 features for annotation.
Fig. 1
Study flowchart. BMI body mass index, CHD coronary heart disease, DAG directed acyclic graph, DC discovery cohort, FDR false discovery rate, KIHD Kuopio Ischaemic Heart Disease Risk Factor Study, LC–MS liquid chromatography–mass spectrometry, LM linear regression model, LTPA leisure-time physical activity, MS2 tandem mass spectrometry, DC discovery cohort, RF max random forest with maximum variable selection, RT retention time, T2D type 2 diabetes, RC replication cohort, WG whole grain. *Sample selection criteria have been reported in previous publications according to a healthy Nordic dietary pattern, the incidence of coronary artery disease for DC and egg intake, and incidence of type 2 diabetes for RC [30, 31].
Extracted ion chromatograms and MS2 spectra of differential metabolites were visualized using Freestyle 1.3 (Thermo Fisher Scientific) for annotation purposes. Metabolite annotation was performed based on matching mass, isotopic pattern, and MS2 spectra against existing libraries, either in-house for level I (together with matched RT with pure commercial compound run in the same platform) or online spectral databases (Supplementary Methods) for level II according to the guidelines from the Metabolomics Standard Initiative [41]. The utilized reference libraries for level II identification were MassBank [42, 43], METLIN [44], HMDB version 4.0 [45], and Mass Bank of North America (MoNA). Lipophilic compounds were matched against the in-house library or built-in MS-DIAL library [36] and LIPID MAPS [46]. Phospholipids [47, 48], dihydroxybenzoic acid [49, 50], betaines [51, 52], and alkylresorcinols [12, 49] were annotated based on previously reported MS2 fragments. Features without data-dependent MS2 were subjected to targeted MS2 analysis using the previously described method [30]. Metabolites with compound class annotation based on the fragmentation patterns were reported as level III. Completely unknown compounds with unavailable MS2 data or lacking MS2 interpretation were reported as level IV [41].
Reproducibility study of metabolites previously associated with wg intakeBesides annotating metabolites from the discovery and replication strategies described above, we further annotated metabolites previously associated with WG intake [10, 12, 13, 49, 52, 53] from the data. This list of metabolites included ARs, betaines, and other metabolites (Supplementary Table 4). In addition, due to the potential interaction between WG, endogenous metabolism, and gut microbiota [54, 55], we also investigated the association between WG intake and some microbial metabolites (Supplementary Table 5) previously reported from gut microbiota or linked to the metabolism of benzoxazinoid or phenolic compounds [54, 56,57,58,59].
留言 (0)