
記住我


The upper esophageal sphincter (UES) is the high-pressure zone anatomically located between the pharynx and the proximal esophagus. Normally, it is tonically active and remains closed to protect the airway from acidic stomach contents and to avoid air passage into the digestive tract.[1] During deglutition, as the food bolus approaches the esophagus, laryngeal excursion occurs and the UES opens transiently for bolus transportation.[2] The duration of UES relaxation has to be long enough for complete transfer of bolus from the pharyngeal cavity to the proximal esophagus. Decreased UES relaxation duration reduces the passage of bolus passing into the esophagus, resulting in retention of pharyngeal residue and aspiration after swallowing and ultimately aspiration pneumonia.[3,4] UES dysfunction is a treatable cause of oropharyngeal dysphagia through botulinum injection, balloon dilatation, or surgical myotomy.[5,6] Therefore, diagnosis of UES dysfunction by measuring UES relaxation duration is critical.
UES relaxation duration can be measured by high-resolution manometry (HRM) or videofluoroscopic swallow study (VFSS).[7–10] The majority of recent studies measured UES relaxation duration and diagnosed UES relaxation dysfunction using HRM.[9,11,12] However, HRM has several shortcomings such as patient discomfort due to catheter insertion,[13,14] fasting for a few hours before exam[15] and the need for a trained gastroenterologist to interpret the manometric data. Moreover, as HRM is an emerging technique, it is not yet widely available and difficult to use in patients at primary-care hospitals that lack the appropriate equipment.
VFSS is the most widely used tool and is considered the gold standard for evaluating swallowing function.[16,17] VFSS provides direct visualization of the laryngo-pharyngeal structures during deglutition from the moment the UES opens until it closes. It can be used to measure the UES relaxation duration, pharyngeal residue, penetration and/or aspiration. However, VFSS is commonly used as a qualitative and perceptual tool rather than as a quantitative measure using binary present/absent ratings or a categorical grading system. Even though some studies explored quantitative analysis in VFSS,[13,18–20] this technique is not routinely performed in clinical practice and previous studies did not concentrate on the diagnosis of UES dysfunction. The optimal time threshold for diagnosing UES dysfunction in VFSS was not determined either.
There has been no trial to compare HRM and VFSS in terms of diagnostic ability to evaluate UES relaxation duration in patients with oropharyngeal dysphagia. The purpose of this study was to compare 2 methods of UES relaxation measurement and determine which method has better diagnostic value in UES relaxation impairment.
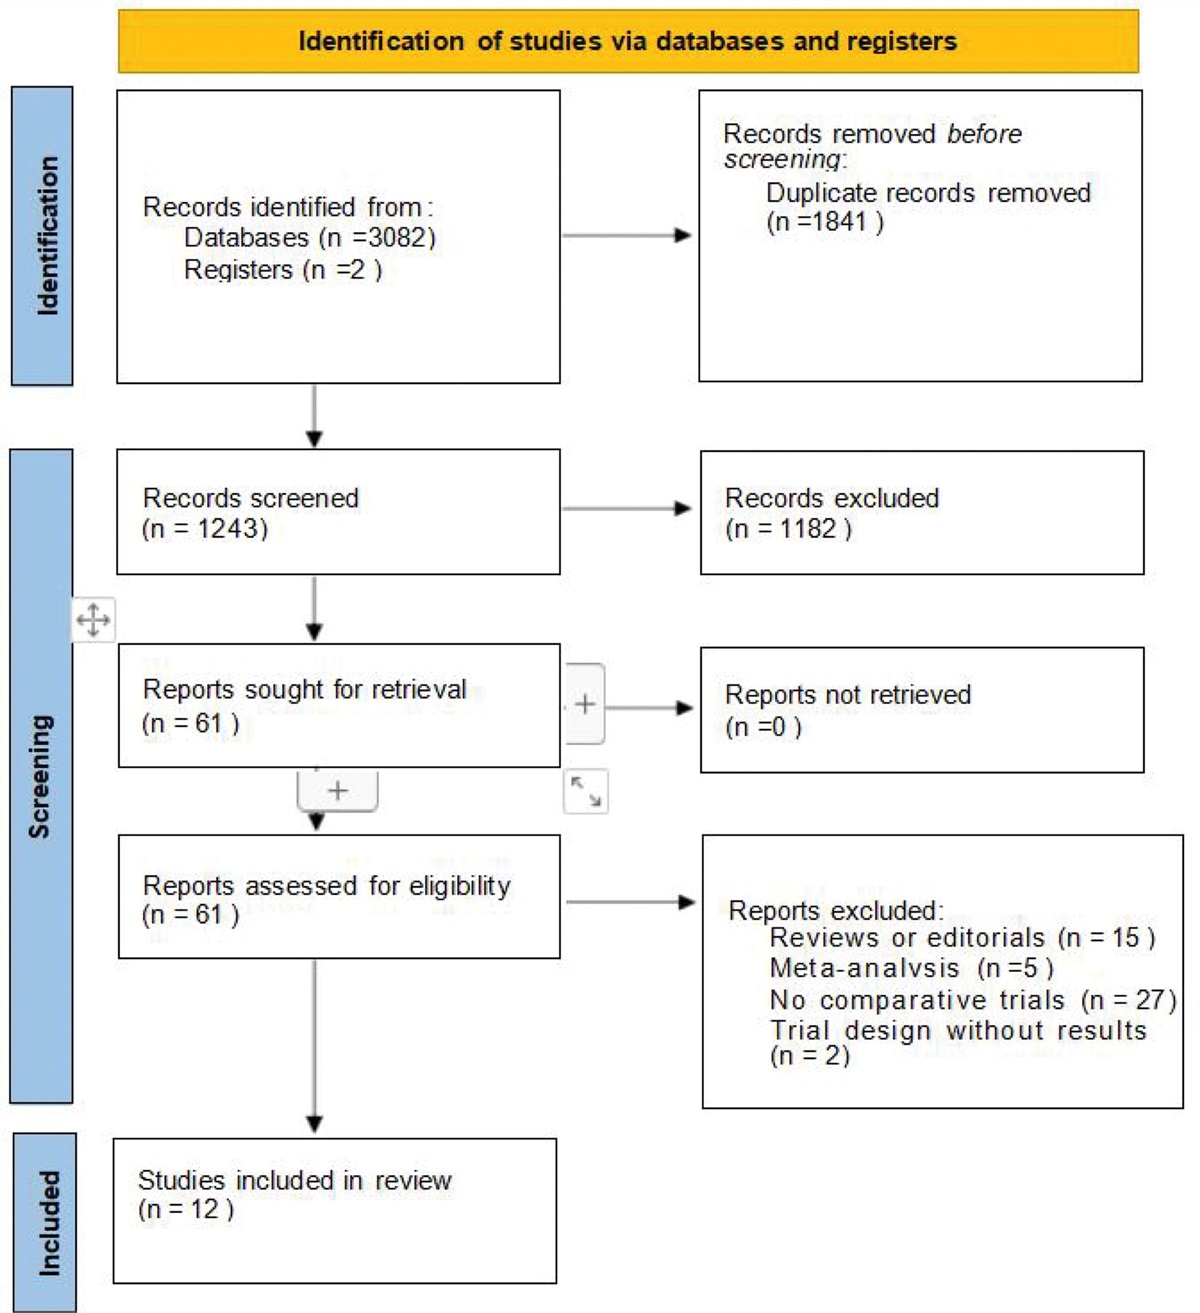
2. Methods 2.1. SubjectsA total of 181 patients with clinical symptom of oropharyngeal dysphagia who visited the dysphagia clinic at one tertiary referral hospital and underwent both HRM and VFSS from November 2012 to June 2019 were included. Patients were excluded if they had any of the following: age < 18 years, interval between the date of VFSS and HRM greater than 1 week, poor visualization of VFSS video clips, did not complete the full VFSS or HRM evaluation due to several reasons (e.g., severe dysfunction in the oral phase prohibiting transmission of the bolus into the pharynx). A total of 41 patients were excluded and 140 patients ultimately were enrolled in the study (Fig. 1). All patients signed an informed consent prior form to VFSS and HRM. This study was approved by the Institutional Review Board of Kangbuk Samsung Hospital (Institutional Review Board No. 2020-06-022).
 Figure 1.:
 Flowchart of patients with oropharyngeal dysphagia. DOSS = dysphagia outcome and severity scale, HRM = high-resolution manometry, VFSS = videofluoroscopic swallow study.
2.2. Swallowing function assessmentEach subject’s swallowing function was assessed using the 7-point dysphagia outcome and severity scale (DOSS) developed by O’Neil et al[21] This scale assesses a patient’s dysphagia severity and classifies patients into 7 categories according to oral stage transfer, pharyngeal stage retention, and presence of aspiration or penetration based on VFSS findings. Feeding method was determined according to the level of DOSS. Patients classified as level 1 and level 2 based on the DOSS were assigned into the non-oral feeding group, and levels 3, 4, 5, 6, and 7 were included in the oral feeding group. In this study, 37 patients were included in the non-oral feeding group and 103 patients were in the oral feeding group (Fig. 1).
2.3. Evaluation of UES opening on VFSsFor VFSS, we used fluoroscopy (ZEN2060; Genoray Corporation; Korea)a with the X-ray tube and detector positioned laterally relative to the patient. The location of the fluoroscope was adjusted appropriately to fully visualize the patient’s oral cavity, pharynx, larynx, and UES in sagittal plane. External materials that could affect the fluoroscopy image were removed (e.g., earrings, necklace, previous L-tube, etc). In an upright sitting position, patients swallowed a 5-mL bolus of a mixture of barium sulfate and water (barium:water = 1:10). The entire swallowing process was recorded and digitized as video clips. Video clips from VFSS were transferred to a computer and analyzed to determine the UES relaxation duration (URD_V). UES relaxation duration was defined as the duration from the moment the UES began to open and bolus passage through the UES area, until the moment UES closed and the bolus tail passed the UES area (Fig. 2).[7] Each liquid swallow was analyzed by picture frame, and the time difference between the consecutive frames was 0.033 seconds. These processes were measured by a blinded physician.
 Figure 2.:
 Procedure of VFSS measuring UES relaxation duration. (A) Oral phase. (B) Initial opening of the UES when the beginning of UES distension was observed. (C) The UES remains open and the bolus passes through the UES. (D) Closure of the UES when the bolus tail passes. UES = upper esophageal sphincter, VFSS = videofluoroscopic swallow study.
2.4. Evaluation of UES relaxation on HRMFor HRM, we used a solid-state manometric catheter composed of 36 circumferential sensors (1-cm spacing) (Given Imaging). Studies were done after at least 8 hours of fasting. Before each study, the manometric system was calibrated at zero and 300 mm Hg using externally applied pressure. The manometric catheter was inserted through the patient’s nose and positioned to record from the distal pharynx to the esophagus. The catheter was secured to the patient’s nose using tape. Each patient swallowed a 5 mL bolus of water while in a sitting position. Five swallows were performed and the mean value was calculated. Manometric data was transformed into a digital format and analyzed by a trained gastroenterologist using ManoView analysis software, as in previous studies.[22,23] The UES zone was defined as the stable high pressure zone just proximal to the low pressure area of proximal esophagus, specifically located between the low baseline pharyngeal pressure zone and low esophageal pressure zone.[22,23] We drew an isobaric contour pressure plot using MATLAB (MathWorks; Natick, MA)c. UES relaxation duration on HRM (URD_H) was defined as the time-interval from the point of departure from 50% of baseline pre-swallow UES pressure to the point of return to 50% baseline UES pressure on the isobaric contour pressure plot (Fig. 3) as previously described by Castell et al[24] and Park et al[8] If study subjects had a baseline UES pressure > 70 mm Hg, we set the maximum limit of half baseline pressure as 35 mm Hg.[8]
 Figure 3.:
 HRM data during swallow. (A) Spatiotemporal plot. The zone of UES was defined as the stable high-pressure zone between the low esophageal pressure zone caudally and the low baseline pharyngeal pressure zone rostrally. (B) Isobaric contour plot formulated using MATLAB. UES relaxation duration was defined as the duration of time from onset at the point of departure from half of the baseline to the offset at the return to half baseline pressure. HRM = high-resolution manometry, UES = upper esophageal sphincter.
2.5. Statistical analysisWe analyzed data by dividing patients into oral feeding and non-oral feeding groups. The χ2 test was used to identify differences in demographic characteristics between the 2 groups. The URD_V and URD_H was compared between groups by the Student t test. Receiver operating characteristic curve analysis was conducted to validate the cutoff value for UES relaxation duration between the non-oral feeding group and the oral feeding group. Based on the cutoff value, each method’s sensitivity and specificity for oral feeding or non-oral feeding were calculated, respectively. A Bland-Altman plot was created to show agreement between URD_V and URD_H. For VFSS intra-rater and inter-rater reliability, the investigator randomly selected and reanalyzed 50% of the patients’ VFSS clips (70 subjects), and the second rater re-analyzed the same 70 subjects. The intra-rater and inter-rater correlation coefficients (ICCs) between the measurements were calculated. The level of statistical significance was fixed at P < .05. Data analyses were performed using the IBM SPSS version 25.0 (IBM Corp, Armonk, NY) and STATA version 16.1 (STATA Corp, College Station, TX).
3. Results 3.1. Demographic characteristics in the non-oral and oral feeding groupsDemographic characteristics for the non-oral and oral feeding groups are shown in Table 1. There was no significant difference in age, proportion of hypertension, diabetes mellitus, chronic obstructive pulmonary disease, and underlying dysphagia etiologies. The proportion of male and patients who had pneumonia was higher in the non-oral feeding group than in the oral feeding group.
Table 1 - Demographic characteristics in the non-oral and oral feeding groups (n = 140). Variables Non-oral feeding group (n = 37) Oral feeding group (n = 103) P value* Demographic characteristics Age (yrs), mean ± SD 71.59 ± 10.98 69.58 ± 12.95 .401 Sex (male), % 91.9 64.0 .001 Hypertension, % 48.6 39.8 .224 Diabetes mellitus, % 43.2 33.0 .265 COPD, % 16.2 10.7 .376 Previous pneumonia history, % 62.2 39.8 .016 Etiologies of dysphagia Ischemic stroke, % 40.5 35.9 .618 Hemorrhagic stroke, % 8.1 8.7 .907 Traumatic brain injury, % 8.1 2.9 .188 Neurodegenerative disease, % 13.5 15.5 .768 Head and neck cancer, % 13.5 13.6 .237 Others†, % 10.8 17.5 .339 Unknown, % 5.4 5.8 .136 DOSS level Level 1, n 9 - Level 2, n 28 - Level 3, n - 22 Level 4, n - 35 Level 5, n - 27 Level 6, n - 13 Level 7, n - 6COPD = Chronic obstructive pulmonary disease, DOSS = Dysphagia outcome and severity scale, HRM = High-resolution manometry, SD = Standard deviation.
*P value for Student’s t test or χ2 between the non-oral and oral feeding groups.
†Others included patients with vocal cord palsy, hypertrophic spur of the cervical spine, multiple sclerosis, or Guillain–Barre syndrome.
The mean URD_V was 0.54 seconds in the oral-feeding group, with a standard deviation of 0.15 seconds (Table 2). The mean URD_V was 0.42 seconds in the non-oral feeding group, with a standard deviation of 0.14 seconds. URD_V was significantly higher in the oral feeding group than in the non-oral feeding (P < .001). The mean URD_H was 0.50 seconds in the oral feeding group and 0.41 seconds in the non-oral feeding group, with standard deviations of 0.20 and 0.21 seconds, respectively. URD_H measured in the oral feeding group was significantly higher than that in the non-oral feeding group (P = .023).
Table 2 - Upper esophageal sphincter relaxation duration on videofluoroscopic swallow study and High-resolution manometry in the oral and non-oral feeding groups. Oral feeding Non-oral feeding P value URD_V 0.54 ± 0.12 0.42 ± 0.25 <.001 URD_H 0.50 ± 0.11 0.41 ± 0.21 .023Data are presented as mean ± standard deviation.
URD_H = UES relaxation duration on HRM, URD_V = UES relaxation duration obtained on videofluoroscopic swallow study.
Receiver-operating characteristic analysis revealed that the optimal UES relaxation duration cutoff value of URD_V was 0.42 seconds, and that of URD_H was 0.44 seconds (Fig. 4). The sensitivity and specificity of URD_V were 0.835 and 0.486, respectively (AUC = 0.716), and the sensitivity and specificity of URD_H were 0.709 and 0.541, respectively (AUC = 0.637).
 Figure 4.:
 ROC curve analyses for differentiating the non-oral feeding group from the oral feeding group. The optimal cutoff values, sensitivities, and specificities of (A) URD_V and (B) URD_H are demonstrated on the graph. AUC = area under the ROC curve, CI = confidence interval, ROC = receiver operating characteristic, URD_H = upper esophageal sphincter relaxation duration on high-resolution manometry, URD_V = upper esophageal sphincter relaxation duration on videofluoroscopic swallow study.
3.3. Intra- and inter-rater reliability for URD_VBoth intra- and inter-rater reliability for URD_V were applied with ICC. The intra-rater reliability was 0.901 (95% confidence interval [CI] 0.820–0.981). The inter-rater reliability was 0.810 (95% CI 0.701–0.918).
3.4. Agreement between URD_V and URD_HA Bland-Altman plot was used to evaluate the difference between URD_V and URD_H. This plot showed a moderate degree of variability (Fig. S1, Supplemental Digital Content, https://links.lww.com/MD/H394). The mean difference was 0.030 (95% CI 0.002–0.058).
4. DiscussionOur study is the first to compare 2 methods of UES relaxation measurement and identify which method has better diagnostic value in UES impairment. There are 2 major findings of our study. First, we compared diagnostic values of UES relaxation duration on VFSS and HRM for determining feeding method. Second, we set the optimal cutoff value of UES relaxation duration on VFSS and HRM for determining feeding method.
VFSS had higher sensitivity (83.5%) than HRM (70.9%). When measuring UES relaxation duration on HRM, the decline in UES pressure is interpreted as UES relaxation. However, UES relaxation determined by manometry does not equate to UES opening during swallow.[8,9] Even if the UES pressure on HRM is lowered during deglutition, UES opening may still be insufficient and the bolus may not effectively pass through the UES. The extent of UES opening is also dependent upon the pharyngeal contractility, external traction force generated by the suprahyoid muscles and the volume of the bolus being propelled.[8,25] Conditions such as decreased pharyngeal contractility and nasopharyngeal regurgitation can give rise to temporal mismatch between bolus passage and UES relaxation. These conditions can explain the reason why HRM had lower sensitivity than VFSS.
On the other hand, VFSS allows direct visualization of the bolus as it passes over the UES as well as UES opening. A reduction in UES “opening” on VFSS means there was poor bolus passage through the UES. Therefore, patients who did not have a decrease in UES relaxation duration on VFSS could be considered candidates for oral feeding, which can explain its higher sensitivity than HRM.
In our study, the mean UES relaxation duration was similar between the 2 methods. However, in a previous study, Ryu et al[13] reported that UES relaxation duration was shorter on VFSS compared to HRM. In their study, healthy subjects were recruited for comparing UES relaxation duration and a relatively small number (10 people) was evaluated. In our study, we measured UES relaxation duration in 140 dysphagic patients. Additionally, The previous study[13] defined UES relaxation duration on HRM as the interval between pre- and post-UES peak (“UES activity time”), which is longer than with ours. Our method for measuring UES relaxation duration was based on the protocol used in previous well-designed studies,[8,24] in which UES relaxation duration was defined as duration of time from onset at the point of departure from half of the baseline to the offset at return to half baseline pressure on the isobaric contour plot. When compared by Bland-Altman plot, UES relaxation duration measured by VFSS and HRM showed moderate degree of variability and the mean difference was 0.030. Therefore, our method for measuring UES relaxation duration on HRM seemed be consistent with actual UES opening on kinematic analysis. However, the method for measuring UES relaxation duration on HRM is not yet standardized across centers, and further studies are needed to establish the optimal methodology for demonstrating UES relaxation impairment.
This is the first study comparing methods for measuring UES relaxation duration for differentiating appropriate feeding methods in patients with dysphagia. VFSS showed higher sensitivity and lower specificity than HRM. Neither method proved to be superior, however, we suggest that VFSS and HRM can be used as complementary modalities in the evaluation of UES relaxation duration in patients with swallowing difficulty.
Although have been several studies of UES opening duration on VFSS,[13,18–20] the optimal cutoff value for diagnosis of UES dysfunction on VFSS has not been established. The present study sets a cutoff value of UES opening duration on VFSS as 0.42 seconds for determining appropriate feeding method in patients with oropharyngeal dysphagia. This threshold could be applied to determine oral feeding or non-oral feeding in patients with dysphagia.
UES opening is crucial for safe swallowing. If the UES does not remain open long enough, part or all of a bolus will be unable to pass into the esophagus. This can result in pharyngeal residue and/or aspiration during or after the swallow. UES opening dysfunction has been reported in dysphagic patients with numerous neurological diseases such as brainstem strokes, Parkinson’s disease, motor neuron disease, and inclusion body myositis.[5] The prevalence of UES dysfunction is relatively high in neurological oropharyngeal dysphagia, ranging from 15% to 45%. Impaired UES opening could be caused by many different conditions such as cricopharyngeal fibrosis, insufficient CP muscle relaxation, suboptimal anterior or superior hyolaryngeal excursion, weak pharyngeal muscle constriction, and low hydrostatic pressure of the bolus. Once an abnormality in UES relaxation is diagnosed as the cause of oropharyngeal dysphagia, specific treatment such as balloon dilatation, botulinum toxin injection or surgical myotomy can be applied.[6–9] Therefore, measuring UES relaxation duration not only provides information on the patient’s swallowing function, but also diagnoses oropharyngeal dysphagia related to UES dysfunction and helps in the planning of treatment strategies.
There is some concern about the subjectivity of measuring UES opening duration using VFSS, and we calculated both intra- and inter-rater reliability with intra-class correlation coefficients in this study to address this. The average intra-rater reliability was excellent (ICC 0.901, 95% CI 0.820–0.981). The inter-rater reliability for 2 raters was 0.810 (95% CI 0.701–0.918). Consistent with our findings, Kim et al[7] used the same method to obtain UES relaxation duration on VFSS, and showed reproducibility (intra- and inter-judge reliability: R = 0.88 and 0.90, respectively).
Our study has several limitations. First, the number of patients in the non-oral feeding group (37 patients) was smaller than that of the oral feeding group (103 patients). The relatively small sample size of the non-oral feeding group might have influenced the results. Second, UES opening width or coordination was not considered in UES dysfunction. UES opening may be reduced in duration, but it may also be reduced in width or delayed in opening onset. All of these may result in the impairment of bolus transfer into the esophagus. Third, UES parameters can vary according to the amount, viscosity and consistency of food swallowed.[13,25] We investigated UES relaxation duration only using a 5 ml bolus of water. Further studies to evaluate the bolus amount and viscosity are required.
5. ConclusionUES relaxation duration measured by VFSS and HRM have complementary ability in evaluating swallowing function in patients with oropharyngeal dysphagia. Additionally, we set a cutoff value for the diagnosis of UES relaxation impairment on VFSS in patients with oropharyngeal dysphagia.
Data from this study are available upon reasonable request and approval by the corresponding author.
Author contributionsConceptualization: Chul-Hyun Park, Kunwoo Kim.
Data curation: Jin-Tae Hwang, Jae-Hyung Choi.
Formal analysis: Chul-Hyun Park, Kun-Woo Kim.
Methodology: Jung Ho Park.
Supervision: Yong-Taek Lee, Young Sook Park.
Writing – original draft: Chul-Hyun Park, Kunwoo Kim.
Writing – review & editing: Jung Ho Park, Kyung Jae Yoon.
References [1]. Sivarao DV, Goyal RK. Functional anatomy and physiology of the upper esophageal sphincter. Am J Med. 2000;108(Suppl 4a):27s–37s. [2]. Kahrilas PJ, Dodds WJ, Dent J, et al. Upper esophageal sphincter function during deglutition. Gastroenterology. 1988;95:52–62. [3]. McClave SA, DeMeo MT, DeLegge MH, et al. North American summit on aspiration in the critically Ill patient: consensus statement. JPEN J Parenter Enteral Nutr. 2002;26:S80–5. [4]. Rosenbek JC, Robbins JA, Roecker EB, et al. A penetration-aspiration scale. Dysphagia. 1996;11:93–8. [5]. Regan J, Murphy A, Chiang M, et al. Botulinum toxin for upper oesophageal sphincter dysfunction in neurological swallowing disorders. Cochrane Database Syst Rev. 2014;5:Cd009968. [6]. Moerman MB. Cricopharyngeal Botox injection: indications and technique. Curr Opin Otolaryngol Head Neck Surg. 2006;14:431–6. [7]. Kim Y, Park T, Oommen E, et al. Upper esophageal sphincter opening during swallow in stroke survivors. Am J Phys Med Rehabil. 2015;94:734–9. [8]. Park CH, Lee YT, Yi Y, et al. Ability of high-resolution manometry to determine feeding method and to predict aspiration pneumonia in patients with dysphagia. Am J Gastroenterol. 2017;112:1074–83. [9]. Omari TI, Wiklendt L, Dinning P, et al. Upper esophageal sphincter mechanical states analysis: a novel methodology to describe UES relaxation and opening. Front Syst Neurosci. 2014;8:241. [10]. Kahrilas PJ, Lin S, Rademaker AW, et al. Impaired deglutitive airway protection: a videofluoroscopic analysis of severity and mechanism. Gastroenterology. 1997;113:1457–64. [11]. Blais P, Patel A, Sayuk GS, et al. Upper esophageal sphincter (UES) metrics on high-resolution manometry (HRM) differentiate achalasia subtypes. Neurogastroenterol Motil. 2017;29:e13136. [12]. Benjamin T, Zackria S, Lopez R, et al. Upper esophageal sphincter abnormalities and high-resolution esophageal manometry findings in patients with laryngopharyngeal reflux. Scand J Gastroenterol. 2017;52:816–21. [13]. Ryu JS, Park D, Oh Y, et al. The effects of bolus volume and texture on pharyngeal pressure events using high-resolution manometry and its comparison with videofluoroscopic swallowing study. J Neurogastroenterol Motil. 2016;22:231–9. [14]. Knigge MA, Marvin S, Thibeault SL. Safety and tolerability of pharyngeal high-resolution manometry. Am J Speech Lang Pathol. 2019;28:43–52. [15]. Park JH, Lee H, Rhee PL, et al. Effects of viscosity and volume on the patterns of esophageal motility in healthy adults using high-resolution manometry. Dis Esophagus. 2015;28:145–50. [16]. Sorin R, Somers S, Austin W, et al. The influence of videofluoroscopy on the management of the dysphagic patient. Dysphagia. 1988;2:127–35. [17]. Gayler BW. Fluoroscopic equipment for video swallowing studies: current state of technology and future trends. Dysphagia. 2007;16:2–6. [18]. Molfenter SM, Steele CM. Kinematic and temporal factors associated with penetration-aspiration in swallowing liquids. Dysphagia. 2014;29:269–76. [19]. Lee SI, Yoo JY, Kim M, et al. Changes of timing variables in swallowing of boluses with different viscosities in patients with dysphagia. Arch Phys Med Rehabil. 2013;94:120–6. [20]. McCullough GH, Kamarunas E, Mann GC, et al. Effects of Mendelsohn maneuver on measures of swallowing duration post stroke. Top Stroke Rehabil. 2012;19:234–43. [21]. O’Neil KH, Purdy M, Falk J, et al. The dysphagia outcome and severity scale. Dysphagia. 1999;14:139–45. [22]. McCulloch TM, Hoffman MR, Ciucci MR. High-resolution manometry of pharyngeal swallow pressure events associated with head turn and chin tuck. Ann Otol Rhinol Laryngol. 2010;119:369–76. [23]. Takasaki K, Umeki H, Enatsu K, et al. Investigation of pharyngeal swallowing function using high-resolution manometry. Laryngoscope. 2008;118:1729–32. [24]. Castell JA, Castell DO. Modern solid state computerized manometry of the pharyngoesophageal segment. Dysphagia. 1993;8:270–5. [25]. Cook IJ, Dodds WJ, Dantas RO, et al. Opening mechanisms of the human upper esophageal sphincter. Am J Physiol. 1989;257:G748–59.
留言 (0)