
記住我


Coronavirus disease 2019 (COVID-19) is an infectious disease caused by the SARS-CoV-2 virus. In December 2019, the first case of COVID-19 was reported in the South China Seafood Market in Wuhan, Hubei Province, China. The World Health Organization (WHO) declared COVID-19 a public health emergency of international concern (PHEIC) on January 30, 2020.[1] On March 12, 2020, the World Health Organization declared the COVID-19 outbreak a global pandemic.[2] The coronavirus pandemic has been wreaking havoc across the globe, straining health facilities in many countries, and increasing the number of infections and deaths every day. According to official statistics from the WHO, on February 14, 2022, there were 1,570,734 new confirmed cases and 6417 new deaths on a single day.[3] Countries are taking preventive measures to contain the spread of the virus, reduce the overall infection and mortality rates, and improve public health.
The WHO has provided specific guidelines, including wearing surgical masks, keeping people apart, and isolating infected or close contacts as requested by the government.[4] By maintaining the necessary social distancing and enforcing stricter segregation policies, people were making fewer unnecessary outings and staying at home longer. These measures reduced the amount of time individuals spent in physical activity, which had adverse effects on all systems and organs, and these effects were more pronounced and difficult to reverse in patients with chronic diseases and the elderly.[5] Most people infected with coronavirus are the elderly, those with underlying diseases, those lacking exercise, and those with poor living habits. Studies have shown that moderate-intensity exercise can have a wide range of health benefits, such as reducing inflammation, enhancing immunity, and reducing respiratory viral infections.[6] A study of the early effects of the COVID-19 pandemic on physical activity and sedentary behavior in children living in the USA has shown that pandemic prevention measures have led to a decrease in physical activity and a significant increase in sedentary time among American children, with the negative effect of individuals’ weakened immunity and increased vulnerability to the virus.[7]
Bibliometric analysis is a method of statistical analysis of the research results. This research method has been applied in several fields. Through the analysis of authors, institutions, keywords, countries, cited authors, cited journals, etc., it provides users with research information and ideas. Researchers have a clear understanding of the past and present of the field, which helps them master hot issues and cutting-edge trends in the field.[8] While there were publications on COVID-19 and physical activity, including meta-analyses, to our knowledge, none of these publications used visualization methods for analysis. The current bibliometric analysis software includes Citespace[9] (Drexel University, Philadelphia, PA) and VOSviewer[10] (Leiden University, Leiden, Netherlands). We want to investigate recent hot topics and research hotspots in the years to come. Guiding researchers in the field of sports medicine to intervene in changing levels of physical activity in the context of the COVID-19 pandemic, providing people with better exercise guidance and advice, and identifying potential collaborators and collaborating institutions.
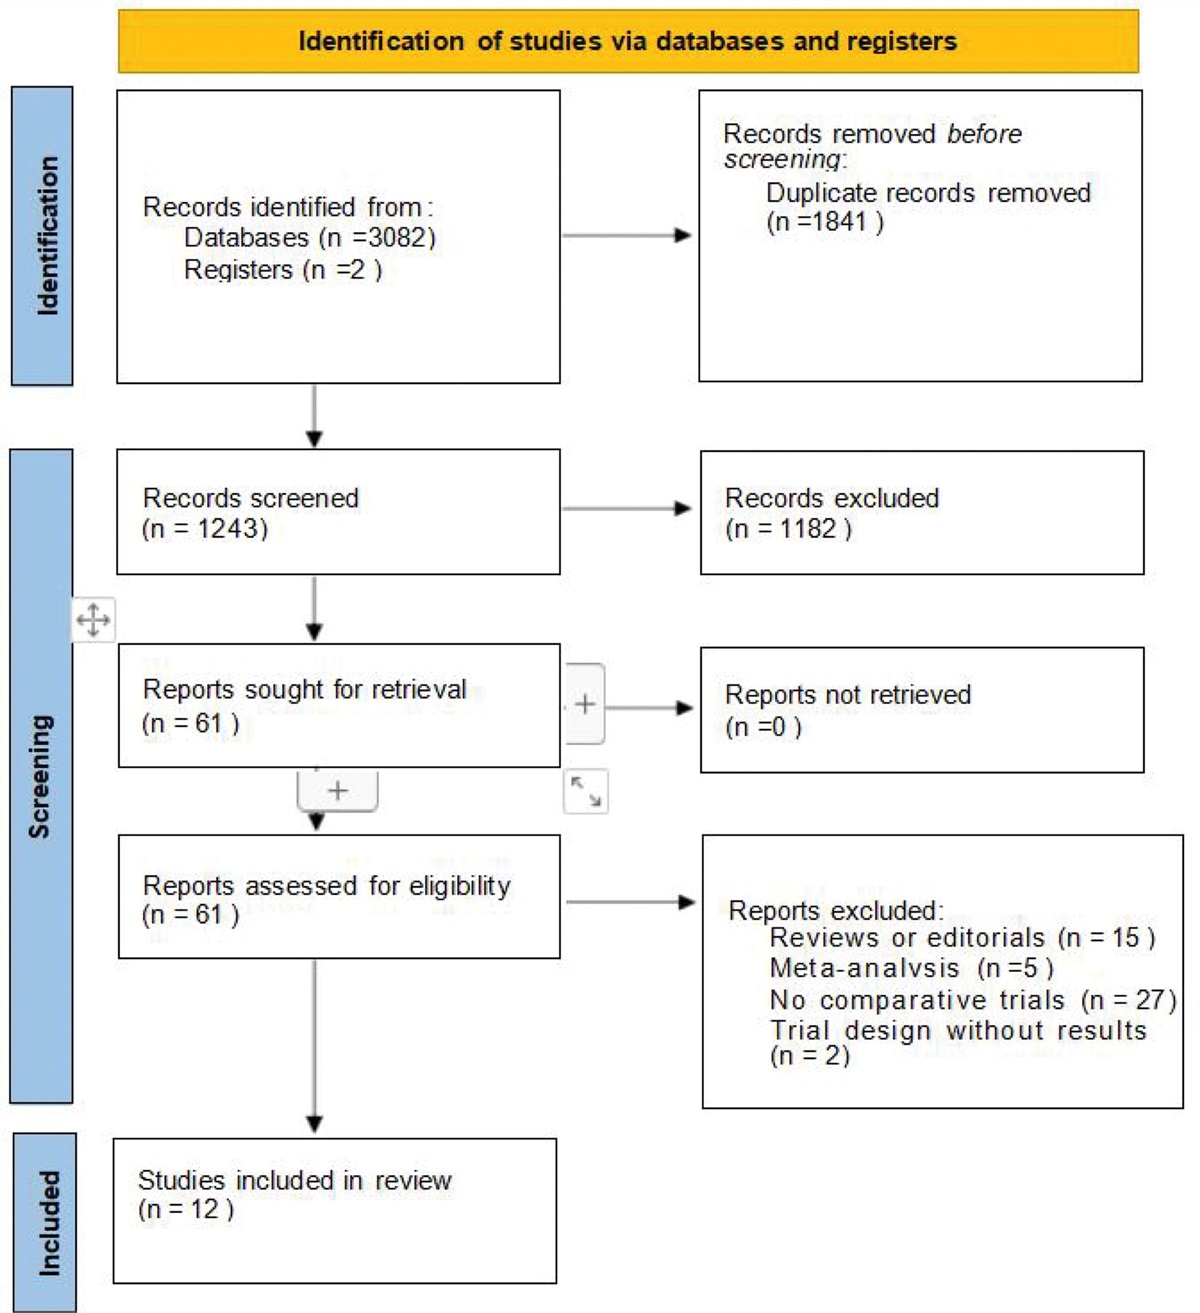
2. Materials and Methods 2.1. Data source and search strategyAll publications were searched using the Web of Science core collection database. We also used the Science Citation Index Expanded (SCI-Expanded) database of Web of Science (WOS) as the source of the available databases. We set the period of publication paper retrieval from January 1, 2020, to February 14, 2022. The search strategy was set as the title= (((TI = (exercise* OR kinesitherapy OR training OR “physical activit*” OR sport* OR fitness OR walk* OR run* OR swim* OR jog* OR cycling OR pilates* OR yoga OR qigong OR “tai chi”)) AND TI=(“COVID 19” OR “COVID-19” OR “SARS-CoV-2 Infection*” OR “SARS CoV 2 Infection*” OR “2019 Novel Coronavirus Disease” OR “2019 Novel Coronavirus Infection” OR “2019-nCoV Disease*” OR “2019 nCoV Disease” OR “COVID-19 Virus Infection*” OR “COVID 19 Virus Infection” OR “Coronavirus Disease 2019” OR “Coronavirus Disease-19” OR “Coronavirus Disease 19” OR “Coronavirus 2 Infection” OR “SARS Coronavirus 2 Infection” OR “COVID-19 Virus Disease*” OR “COVID 19 Virus Disease” OR “2019-nCoV Infection*” OR “2019 nCoV Infection” OR “COVID-19 Pandemic*” OR “COVID 19 Pandemic”)) AND DT = (Article OR Review)) AND LA = (English). The inclusion criteria are shown in Figure 1. The language was restricted to English, and 28 non-English papers were excluded. Document types were limited to articles and reviews, excluding letters, meeting abstracts, published editorials, materials, book reviews, conference presentations, news items, and corrections. After excluding 839 studies, 1331 studies were finally included.
 Figure 1.:
 The flow chart.
2.2. Data analysisCiteSpace 5.8.R3 was used to extract and analyze the number of publications (including outputs, authors, journals, countries, and institutions), citation frequency (including co-cited authors, co-cited journals, and co-cited references), and co-occurring keywords to track research trends and hotspots. The larger the size of the nodes in the map generated by the software, the higher the number of publications or frequency of citations, and the lines between nodes represent cooperative connections. The thicker the lines, the closer the connections. Centrality measures the importance of a node in the overall map-network structure. Centrality > 0.1 is considered an important node. Microsoft Excel 2019 was used to generate line charts of the number of publications and citations. A bibliometric visualization map with a timeline was generated using VOSviewer 1.6.17.
2.3. Visual analysis processThe analysis of the diagrams created by the software follows the principles of quantitative before qualitative, holistic before partial and chronological development, in terms of structure, time, and content. The content of the analysis includes: Illustration of the diagram. It explains the properties of the objects represented by the nodes and connecting lines; The overall structure of the diagram and the clustering analysis; and The analysis of high-frequency nodes and high centrality nodes.
2.4. Research ethicsThe research was conducted as a bibliometric analysis. All data sources were available on the Internet, and no animal or human subjects were involved. Therefore, permission was not required from the ethics committee.
3. Results 3.1. Analysis of publications outputs and citationsSince January 1, 2020, to February 14, 2022, 1331 studies met the inclusion criteria, including 1184 articles and 147 reviews. We imported the data into Microsoft Excel to obtain a histogram of the annual output distribution (Fig. 2). The histogram shows that the number of studies published in 2021 increased from 334 in 2020 to 932 in 2021, and the number of studies published in 2021 was nearly three times that in 2020. The retrieval date was February 14, 2022, and the number of studies published in two months reached 65. We believe that with the development of the epidemic and deepening novel coronavirus research, more novel coronavirus studies will be published in the future.
 Figure 2.:
 The number of annual publications and annual citations.
Figure 2 shows that 1331 studies were cited 12086 times. Through the line chart of annual citations, we found that the studies in 2021 were cited 9975 times, the highest in the previous two years. The number of co-citations in 2020 was 1146, while the number of co-citations in the first two months of 2022 reached 965. Therefore, we estimated that this line chart will show a straight upward trend by the end of 2022.
3.2. Analysis of authors and co-cited authorsVisualizations can provide information about influential authors and potential collaborators and can help researchers build collaborative relationships. From 2020 to 2022, 8548 authors published 1331 studies on COVID-19 and physical activity. To summarize the collaboration between the authors, we created a network map (Fig. 3A). The author’s cooperation map was generated using CiteSpace with 158 nodes and 360 links (Fig. 3A). The network density was 0.029. The top 10 active authors (Table 1) who has published articles related to COVID-19 and physical activity were SMITH L, SEKULIC, GILIC B, MAKIZAKO H, NAKAI Y, CHAMARI K, ARAI H, LOPEZ-BUENO R, AMMAR A, and VANDONI M. SMITH L ranked first with 11 publications, followed by SEKULIC D (8 publications). This figure shows that there are three main research teams in this field. The team represented by SMITH L[11–14] focused on changes in adults’ physical activity levels and mental health during COVID-19 confinement, whereas SEKULIC D’s team[15,16] focused on the effects of different environmental factors on adolescents’ physical activity during confinement. MAKIZAKO H’s team[17–21] studied changes in physical activity, pain management, sleep quality, and health in older people affected by the pandemic. At the same time, the author’s collaboration network diagram also shows that there was little collaboration between different research teams due to differences in geography and institutions.
Table 1 - Top 10 active authors, co-cited authors. Rank Author Published article Co-cited author Cited times Co-cited author Centrality 1 SMITH L 11 **WORLDHEALTHORGANIZATION 214 DING D 0.43 2 SEKULIC D 8 AMMAR A 135 NIEMAN DC 0.37 3 GILIC B 7 WHO 115 BULL FC 0.37 4 MAKIZAKO H 6 BROOKS SK 110 XIANG M 0.28 5 NAKAI Y 5 CHEN PJ 103 DUNTON GF 0.26 6 CHAMARI K 5 CRAIG CL 79 CHEN PJ 0.25 7 ARAI H 5 HUANG CL 78 DWYER MJ 0.25 8 LOPEZ-BUENO R 5 TISON GH 76 AMMAR A 0.24 9 AMMAR A 5 NIEMAN DC 68 DUNCAN GE 0.24 10 VANDONI M 5 HALL G 68 KNELL G 0.21 Figure 3.:
 (A) Map of authors of publications. (B) Map of co-cited authors of publications.
A total of 1331 papers was published, and 484 authors were cited. Pruning the map using Pathfinder results in a simplified network structure diagram. There were 484 nodes and 576 connecting lines (Fig. 3B). By hiding anonymous authors, we can see that the top 5 authors cited were: **WORLDHEALTHORGANIZATION (214 times), Ammar A (135 times), WHO (115 times), Brooks SK (110 times), and CHEN PJ (103 times). The high number of co-citations indicates that the work of these authors also contributed to the development of related disciplines. Among all co-cited authors, DING D had the highest centrality (0.43), followed by Nieman DC and Bull FC (0.37). Based on the number of co-citations and centrality analysis, AMMAR A of Germany, CHEN PJ of Taiwan and China, and NIEMAN DC of the USA were the core researchers in this field. Their research focuses on life sciences and sports medicine, and their research has had a significant impact in this field.
3.3. Distribution of journals and co-cited journalsThe nodes in the map represent journals and the lines between nodes represent relationships. The greater the node area, the more co-citations that occur. The purple rings represent centrality, and the nodes with high centrality are key points on the map. The top 10 journals that published research papers related to COVID-19 and physical activity are shown in Table 2. Among these, International Journal of Environmental Research and Public Health was the most productive, with 179 publications. Figure 4 shows a dual map obtained using CiteSpace. The citing journals are on the left side of the dual-map, the cited journals are on the right side, and the lines on both sides represent the citation relationship. It can be seen from the figure that a large number of papers were published in “neurology, sports, ophthalmology” journals, most of which cited journals in the fields of “health, nursing, medicine” journals. Figure 5 and Table 3 show the co-cited times and centralities. Lancet had the highest co-cited count (527) and International Journal of Clinical Practice had the highest centrality (0.09). Based on a comprehensive analysis of journal citations and centrality, Lancet (IF = 79.323), International Journal of Environmental Research and Public Health (IF = 3.39), and International Journal of Behavioral Nutrition and Physical Activity (IF = 6.457) had the value of quickly understood basic principles and tracked trends.
Table 2 - Top 10 academic journals. Rank Publications Journal IF (2020) 1 179 International Journal of Environmental Research and Public Health 3.39 2 44 Sustainability 3.251 3 27 Medicine 1.889 4 23 BMC Public Health 3.295 5 22 Nutrients 5.719 6 19 Frontiers in Public Health 3.709 7 19 PLoS One 3.24 8 16 BMC Medical Education 2.463 9 16 Healthcare 2.645 10 12 BMJ Open 2.692 Figure 4.:
 The dual-map overlay of journals.
 Figure 5.:
 A map of co-cited journals of publications.
3.4. Analysis of co-cited referencesA total of 38266 references was generated from the 1331 records. The study period was from 2020 to 2022, and the time slice was 1. Table 4 lists the top five co-cited references for counts and Table 5 lists the top five co-cited references for centrality.
Table 4 - Top 5 co-cited references in terms of co-citation counts. Rank Co-citation counts Cited reference Representative author (publication year) 1 117 Effects of COVID-19 Home Confinement on Eating Behaviour and Physical Activity: Results of the ECLB-COVID19 International Online Survey Ammar A (2020) 2 98 Coronavirus disease (COVID-19): The need to maintain regular physical activity while taking precautions Chen PJ (2020) 3 90 The psychological impact of quarantine and how to reduce it: a rapid review of the evidence. Brooks SK (2020) 4 76 Worldwide Effect of COVID-19 on Physical Activity: A Descriptive Study Tison GH (2020) 5 64 The Impact of COVID-19 on Physical Activity Behavior and Well-Being of Canadians Lesser IA (2020)The article with the highest co-cited counts (Table 4), published in 2020, was found by Ammar et al[22] (counts were 117) that home quarantine measures were necessary to protect public health during the COVID-19 pandemic, but most people exhibit decreased levels of physical activity and unhealthy eating patterns that lead to an increased risk of disease and death. The researchers also suggested that using ICT to support exercise at home, maintain healthy eating habits, and add beneficial social factors are important for maintaining health. The article with the highest centrality (Table 5) was published by Chen PJ et al[23] in 2020 (with a centrality of 0.11), indicating that long-term family confinement would change people’s lifestyles and lead to psychological problems such as anxiety and depression.
As can be seen from the co-cited references in Tables 4 and 5, the level of physical activity of the public decreased to varying degrees during the COVID-19 pandemic. Therefore, maintaining physical activity through various means is of great significance in maintaining physical health.
3.5. Analysis of countries and institutionsThe map of the country was generated using VOSviewer. The 1331 studies were published in 110 countries. For a better visualization, we selected 49 countries with more than 10 studies each. The top five countries (Table 6) with the most published papers was the USA (344), followed by the United Kingdom (168), Italy (137), China (130), and Spain (117). Of the top five countries, only China is a developing country. It can be seen that developed countries are devoting more resources to this area. However, since the epidemic was first reported in China, the Chinese government has mobilized a large amount of human and material resources to prevent its spread, which has also provided a reference for global epidemic prevention and control. Figure 6 shows the connections between countries. There is a cooperative relationship between the countries. We used CiteSpace to calculate the centrality of each country. Centrality means that a node establishes a bridge between two unrelated nodes. A high intermediate centrality convex indicates the importance of the nodes in the structure. In addition, the United Arab Emirates ranked first with a centrality of 0.69, followed by Oman and Iran.
Table 6 - Top 10 countries. Rank Country Publication Country Centrality 1 USA 344 U ARAB EMIRATES 0.69 2 UNITED KINGDOM 168 OMAN 0.28 3 ITALY 137 IRAN 0.27 4 CHINA 130 GERMANY 0.23 5 SPAIN 117 CHILE 0.22 6 BRAZIL 86 LIBYA 0.22 7 CANADA 82 YEMEN 0.21 8 AUSTRALIA 81 MEXICO 0.20 9 GERMANY 74 PERU 0.19 10 FRANCE 56 SINGAPORE 0.17 Figure 6.:
 A map of countries.
We used VOSviewer to obtain a collaborative map of the institutions (Fig. 7). Totally, 2881 institutions made contributions to COVID-19 and physical activity. To obtain a better visualization, we included 57 institutions that had published at least eight times. The top five institutions are Harvard Medical School (21), the University of São Paulo (19), Stanford University (16), the University of Washington (15), and the University of British Columbia. Table 7 shows the top 10 institutions in terms of several publications. Similarly, we used CiteSpace to analyze the centrality of the institution. Combined with publications (21) and centrality (0.36), Harvard Medical School contributed the most in this area. As the coronavirus pandemic has spread across the globe, countries have stepped up vaccine development and have become more connected to each other. Countries and regions are presented on the world map in Figure 8.
Table 7 - Top 10 institutions. Rank Institution Publication Institution Centrality 1 Harvard Med Sch 21 Harvard Med Sch 0.36 2 Univ Sao Paulo 19 Emory Univ 0.33 3 Stanford Univ 16 Univ Basel 0.31 4 Univ Washington 15 Univ Politecn Madrid 0.30 5 Univ British Columbia 15 Univ Jyvaskyla 0.26 6 Univ Valencia 14 Loughborough Univ 0.24 7 Univ Politecn Madrid 13 Univ Rome Foro Italico 0.22 8 Univ Milan 13 Univ Colorado 0.21 9 UCL 13 Boston Childrens Hosp 0.21 10 Univ Queensland 12 Univ Queensland 0.20 Figure 7.:
 A map of institutions.
 Figure 8.:
 The distribution of countries/region.
As COVID-19 spread worldwide, the USA and Harvard Medical School were at the center of high-level collaboration with countries and institutions. Collaboration helped researchers share resources and exchange experiences, which were critical for the further development of COVID-19 and physical activity research.
3.6. Analysis of co-occurring keywordsThe co-occurrence keyword map reflects the prevalence of COVID-19 research and its physical activity. Nodes represent keywords and lines between nodes represent co-occurrence relationships. The larger the node area, the higher the frequency. Nodes with high centrality were the focus of publications. The map was constructed with 336 nodes and 1365 links (Fig. 9). According to the analysis of the frequency and center of comorbidity (Table 8; Fig. 9), the frequency of “physical activity” was the highest (330 times), and the center of “fatigue” was the highest (0.10), indicating that since COVID-19 swept the world, the level of physical activity of the public had a greater impact, and the public attached more importance to physical exercise. “Fatigue” refers to fatigue as a major symptom of the COVID-19 pandemic or physical and mental fatigue among members of the public who are not sick due to social restrictions and decreased levels of physical activity.
Table 8 - Top 10 co-occurring keywords. Rank Frequency Keyword Centrality Keyword 1 330 physical activity
留言 (0)