
記住我


Intricate brain networks are derived from sophisticated but organized connections between neuronal cells that evolve during brain development (Bassett and Sporns, 2017; Kriegeskorte and Douglas, 2018). Structural and functional remodeling of brain circuits are driven by a complex interplay of genetic and epigenetic programs (Tau and Peterson, 2010). These changes in the shape and activity emerge naturally during a predictable developmental timeline (Stiles and Jernigan, 2010; Gozdas et al., 2019; Martinez and Sprecher, 2020; Kim and Paredes, 2021). One of the challenging scientific endeavors in neuroscience is to decipher the process of functional development and network organization (Sporns, 2013; Rosenthal et al., 2018; van Atteveldt et al., 2021). In this regard, studies on human and animal models have extensively explored neuronal networks, providing substantial understanding of their self-assembling and their function in vivo (Tau and Peterson, 2010; Bassett and Gazzaniga, 2011; Latifi et al., 2020; Huber et al., 2021; Levakov et al., 2021; Li et al., 2021).
Neurodevelopmental research in humans is mostly limited to postmortem and neuroimaging techniques, hindering detailed developmental studies using electrophysiology tools (Manzini et al., 2021; Mezinska et al., 2021). The human brain develops through proliferation and differentiation of neuronal progenitor cells, migration of immature neurons, axonal elongation and pathfinding, dendrite growth and arborization and synaptogenesis (Raybaud et al., 2013; Budday et al., 2015; Jiang and Nardelli, 2016; Silbereis et al., 2016). This leads to an overconnectivity phase that is followed by a critical period of synapse pruning to establish organized brain circuits (Craig et al., 2006; Craik and Bialystok, 2006; Budday et al., 2015; Silbereis et al., 2016). In mammals, excitatory neurons mature at earlier embryonic stages while GABAergic neurons develop later (Warm et al., 2022). Structural and functional maturation of excitatory and inhibitory circuits emerge as distinct activity patterns during cortex development (Luhmann et al., 2016; Teppola et al., 2019). Network-wide synchronized burst activity attributed to glutamatergic synapses appears midterm, develops until birth and then decreases by maturation of the GABAergic system (Corlew et al., 2004; Kirwan et al., 2015). The GABAergic system first emerges as neurons with excitatory synaptic transmission, however, upon maturation in the early postnatal period it switches to inhibitory neurotransmission (Ganguly et al., 2001; Zafeiriou et al., 2020).
As an alternative approach, in vitro neuronal culture systems are used to scale down network complexity to study functional features of developing neuronal networks under precise experimental conditions (Pastrana, 2013; Hattori, 2014; Paşca, 2018; Ndyabawe and Kisaalita, 2019). Human stem cell derived neuronal networks offer the potential to recapitulate developmental features of brain circuits in vitro (Odawara et al., 2014; Sasaki et al., 2019; Schmieder et al., 2020, 2022; Ronchi et al., 2021). Rapid progress in human-derived stem cell technology facilitated the generation of in vitro culture systems as an important complementary platform to animal models (Ardhanareeswaran et al., 2017). From a biomedical perspective, human-derived in vitro models offer the potential to reduce the translational gap from bench-to-bedside by allowing an early incorporation of human disease models bearing disease-causing mutations (Nikolakopoulou et al., 2021). Two- or three-dimensional human neuronal cultures are largely engineered using neuronal cells derived from human embryonic (hESCs) (Ilic and Ogilvie, 2017) or human induced pluripotent stem cells (hiPSCs) (Hockemeyer and Jaenisch, 2016; Shi et al., 2017). Multiple steps of differentiating stem cells into postmitotic neurons often demand weeks or months of cell culture (Zhang et al., 2013; Canals et al., 2018). This has been simplified by single-step induction of neurogenic transcription factor expression (Pang et al., 2011; Zhang et al., 2013; Busskamp et al., 2014). An example of a well-established transgenic hiPSC is the inducible neurogenin (iNGN) cell line, in which the overexpression of neurogenin-1 and neurogenin-2 can be induced by the TetOn promoter system (Busskamp et al., 2014; Lam et al., 2017; Kutsche et al., 2018; Ng et al., 2021). These cells are differentiated into postmitotic neurons within 4 days post induction (dpi) (Busskamp et al., 2014) but require additional time for functional maturation subsequently (Lam et al., 2017; Schmieder et al., 2022).
Human-derived neuronal networks require comprehensive and long-term electrophysiological validation and characterization to serve as a reliable platform for addressing biomedical questions or modeling neurodevelopment in vitro (Mossink et al., 2021; Habibey et al., 2022; Schmieder et al., 2022). Patch-clamp recordings have been used to characterize the functional properties of iNGN-derived neurons at different time points over 100 dpi (Lam et al., 2017). However, in order to study the same neuronal circuit over months it is necessary to record from multiple neurons simultaneously without damaging or contaminating them (Habibey et al., 2020, 2022). Standard micro-electrode arrays (MEAs) are used to non-invasively measure activity from networks of primary neurons (Habibey et al., 2015a,2017; Latifi et al., 2016), stem-cell derived neuronal networks (Odawara et al., 2014; Habibey et al., 2022; Schmieder et al., 2022), and neuronal tissue slices (Steidl et al., 2006; Mannal et al., 2021) but offer limited spatial resolution of network activity. High-density MEAs (HD-MEAs) are based on complementary-metal-oxide-semiconductor (CMOS) technology (Ballini et al., 2014) and became available during the past decade. These devices significantly improve the spatial resolution of electrophysiology readout and enable single neuron and sub-cellular recordings (Berdondini et al., 2009; Ballini et al., 2014; Müller et al., 2015). Standard and HD-MEAs advanced electrophysiological research and are a suitable tool for long-term investigation of developing neuronal networks (Berdondini et al., 2009; Ballini et al., 2014; Müller et al., 2015; Habibey et al., 2022). They also have been used to characterize the electrophysiological properties of primary or iPSCs-derived neuronal circuits (Amin et al., 2016; Matsuda et al., 2018; Ronchi et al., 2021).
Cultured hiPSC-derived neuronal networks on HD-MEAs have shown an increase in neuronal firing rates and synchronized burst activity by culture age (Lu et al., 2019). These basic electrophysiological features have been extracted from networks of different cell lines, e.g., diseased cell lines, to reveal their functional phenotype (Ronchi et al., 2021). Such data are of great value to investigate self-assembling neuronal networks in vitro over time. This is especially useful for studying the functional features of such networks (Akarca et al., 2022) and their capability of recapitulating developing brain circuits. To date, there are only few studies that have aimed to characterize long-term functional features from developing primary (Habibey et al., 2015a,b) and stem cell-derived neuronal networks (Odawara et al., 2014, 2016; Amin et al., 2016; Lu et al., 2019). In this study we investigated long-term activity features of iNGN-EGFP-derived neuronal networks using HD-MEAs and revealed large-scale changes of their network morphology over time. We discovered wide-range shifts in neuronal cell position and network morphological transformation from homogenously distributed single neurons in earlier days to robustly clustered networks after 3 months. We found dynamic network location and activity shifts of neuronal cells and clusters on the sensor area (network activity image). Our data suggest that structure-dependent shifts in the network activity should be taken into consideration when measuring the functional phenotype of the developing networks in vitro. We revealed emerging and evolving features of burst activity comparable to the development of network bursts in the pre- and postnatal human brain.
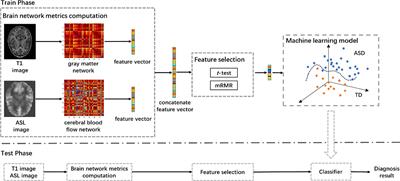
Materials and methods Long-term neuronal culture on high-density micro-electrode arraysA two-step cell-seeding protocol that has been developed for standard low-density MEA devices (Habibey et al., 2022) was adapted to generate long-term neuronal cultures within HD-MEA chips (Figure 1). In the first step, iNGN-EGFP cells were differentiated to neurons and then neurons were detached and reseeded on PDL-laminin coated MEA devices.
FIGURE 1
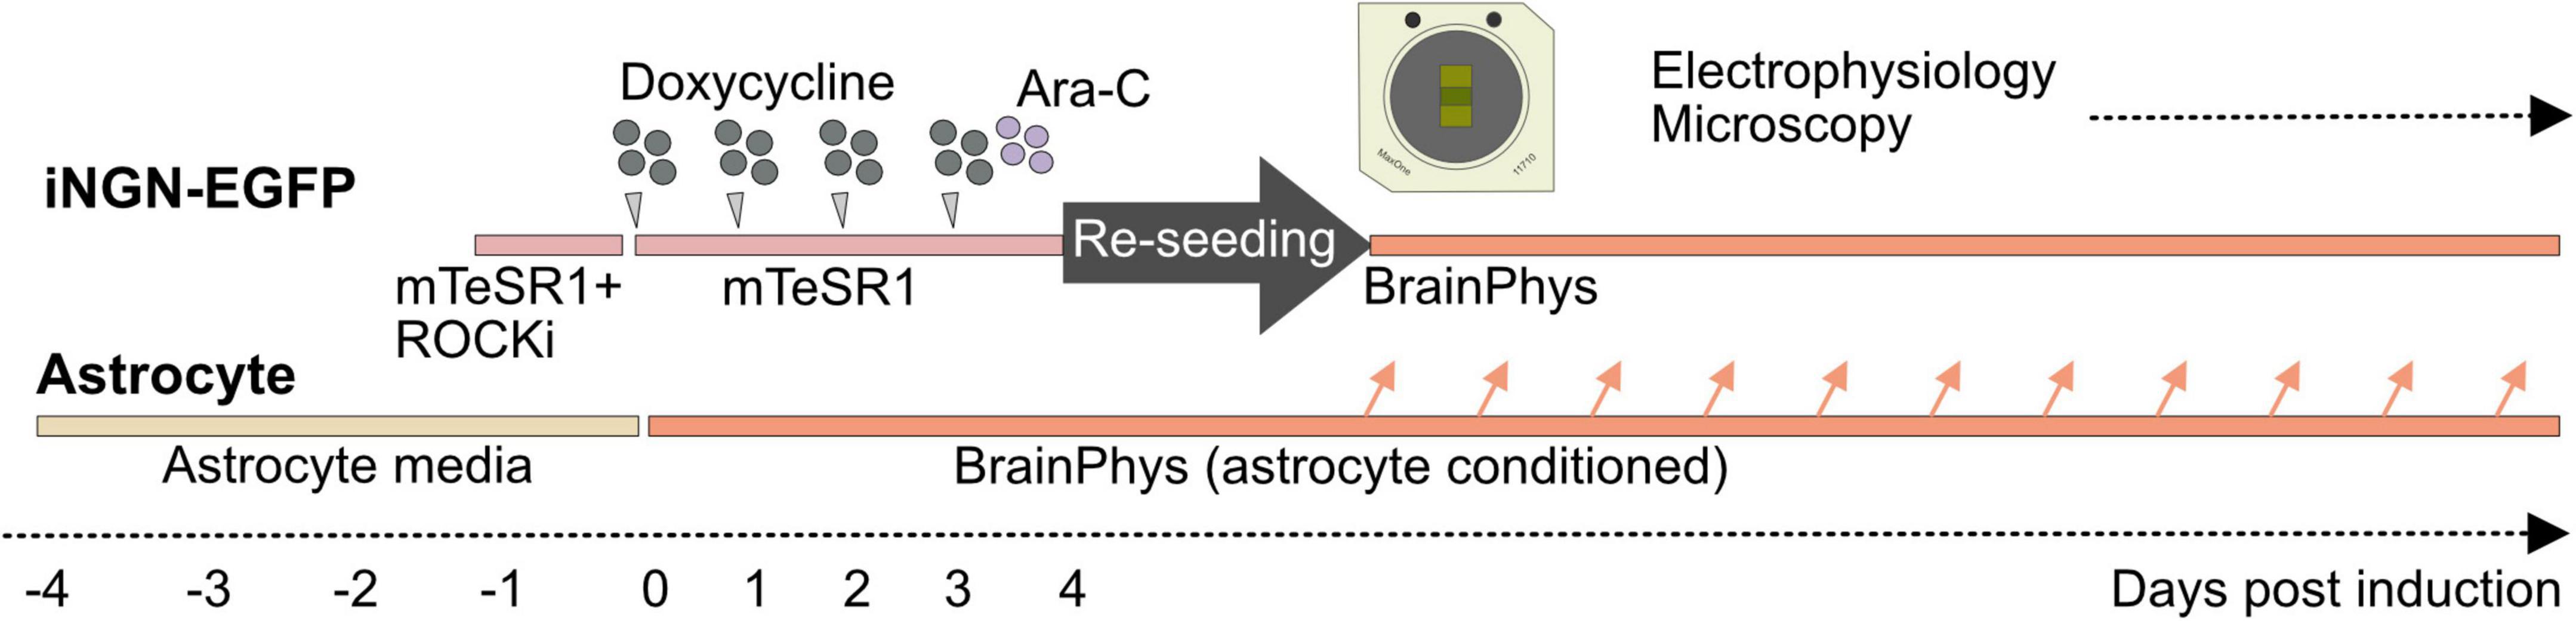
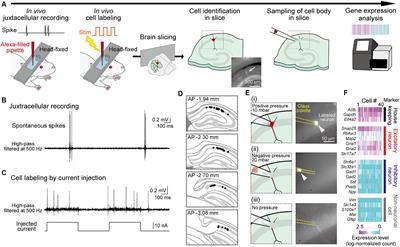
Figure 1. Seeding iNGN-EGFP cells in two step and supporting them with astrocyte-conditioned medium. iNGN-EGFP cells were differentiated for 4 days on a Matrigel coated plate. Ara-C was applied on 3 dpi to remove undifferentiated cells. On 4 dpi iNGN-EGFP cells were dissociated and seeded on a PDL-laminin coated HD-MEA chip. Parallel astrocyte culture on PDL-laminin coated glass coverslips was used to provide astrocyte-conditioned medium for neuronal cultures.
Preparation of HD-MEA chips and coating with PDL-laminin: Sterile HD-MEA chips (MaxOne, MaxWell Biosystems, Switzerland) were plasma treated for 2 min (Diener Electronics, Germany; ambient air, 0.3 mbar) to improve the surface hydrophilicity. A PDL (0.1 mg/ml, 200 μl, Merck) coating was added (50 μl) to cover the sensor area and its surrounding regions inside the chip. The PDL coating was incubated for 24 h, then HD-MEA chips were washed with ultrapure water (3x) and dried under laminar flow. Laminin (50 μl, 0.05 mg/ml concentration, Sigma, Germany) was added to the sensor area and incubated for 3 h directly before reseeding.
Differentiation of iNGN-EGFP cells to neurons on Matrigel-coated plates: Human-derived iNGN-EGFP cells (Busskamp et al., 2014) were differentiated for 4 days in a Matrigel (Corning)-coated 6-well plate. For 4 days differentiation, iNGN-EGFP cells were kept in mTeSR1™ medium (mTeSR1™) Basal Medium with mTeSR1™ 5 × Supplement (Stemcell Technologies, Germany) and 1% penicillin-streptomycin (P/S; Thermo Fisher Scientific, Germany). The mTeSR1™ media was exchanged every day. For neuronal induction, iNGN-EGFP cells were treated with 0.5 μg/ml doxycycline per day (Sigma, Germany) for 4 consecutive days (Figure 1). Ara-C (5 μM; cytosine β-D-arabinofuranoside hydrochloride, Sigma, Germany) was applied at 3 dpi to remove undifferentiated cells before re-seeding.
Reseeding differentiated neurons on HD-MEA devices: Differentiated iNGN-EGFP neurons were dissociated by Accutase (Sigma, Germany), centrifuged at 359 g for 4 min, and after removing the supernatant, the cell pallet was resuspended in complete BrainPhys™ [BrainPhys™ Neuronal Medium (Stemcell Technologies, Germany) + 1% P/S + NeuroCult™ SM1 Neuronal Supplement (Stemcell Technologies, Germany) + N2 Supplement-A + 20 ng/ml recombinant human BDNF (Peprotech, Germany) + 20 ng/ml recombinant human GDNF (Peprotech, Germany) and 200 nM ascorbic acid (Sigma, Germany)]. Cells were reseeded on the sensor area (around 30,000 cells per sensor area).
Supporting long-term cultures with astrocyte-conditioned media: To support neurons with astrocyte-secreted factors, we prepared rat primary astrocyte cultures (Thermo Fisher Scientific, A1261301, Germany) 4 days before neuronal induction (Figure 1). Astrocytes were seeded on PDL (0.1 mg/ml), and laminin (0.05 mg/ml) coated 18 mm coverslips. Astrocytes were kept in astrocyte medium (DMEM + 4.5 g/l d-glucose + pyruvate plus N2 Supplement, 10% One Shot™ fetal bovine serum and 1% P/S (all provided by Thermo Fisher Scientific, Germany). Four days before reseeding, the astrocyte medium was drained, cells were washed with warm PBS without calcium and magnesium (Thermo Fisher Scientific, Germany) and fresh complete BrainPhys medium was added. Astrocyte-conditioned complete BrainPhys™ media was mixed with fresh complete BrainPhys™ (1:3) to replace half of the medium in HD-MEAs once every week.
MicroscopyMicroscopy images from each culture were prepared at different days using an upright fluorescent microscope (Olympus SliceScope Pro 6000, Scientifica, UK). Cultures were placed on a temperature controller top plate (Tokai Hit, Inu-Kiw-F1, Japan) during imaging. A custom made thin and transparent cell culture lid was fabricated from Polydimethylsiloxane (PDMS) to prevent evaporation and allow upright microscopy of the samples in sterile conditions. For fluorescent imaging, a pE-300ultra system (CoolLED, UK) was used to generate blue excitation light. It was guided through a liquid light guide and a pE-Universal Collimator (CoolLED, UK) to the epifluorescence port of the microscope. A GFP filter set (SCI-49002s, Scientifica, UK), including 470/40x, 495LP, 525/50 m filters, was used for fluorescent imaging of the sample. Emitted light was detected by a CCD camera (SciCam Pro, 100918 Scientifica, UK) and processed in Ocular software (Scientifica, UK). To image the whole network on the sensing area, 40 mosaic images were prepared from each network (10x, OLY-N1215800 objective). These images were later stitched together using the ImageJ software and the Grid/Collection stitching plugin (Preibisch et al., 2009) to visualize the overall network morphology at each specific day post induction. Morphology images prepared from three HD-MEA cultures in 9 subsequent weeks from 22 to 76 dpi were used to generate time-lapse videos to show changes in network structure (Figure 2 and Supplementary Figure 1). A manual tracking plugin was used for tracking the movement trajectories of the neuronal cells and clusters over 2 months. Sequences of network images at different days were imported into ImageJ and neurons were selected and tracked individually in 3 MEAs. For neurons that joined clusters we tracked the clusters. Movement trajectories of all tracked neurons were saved as images and video files (Figure 2 and Supplementary Figures 2, 3) and AVI format. Neuronal cell and cluster displacement data (N = 3 MEAs and n = 904 neurons) on the sensor area were extracted as CSV file and used to measure the movement per week or overall displacement during the months.
FIGURE 2
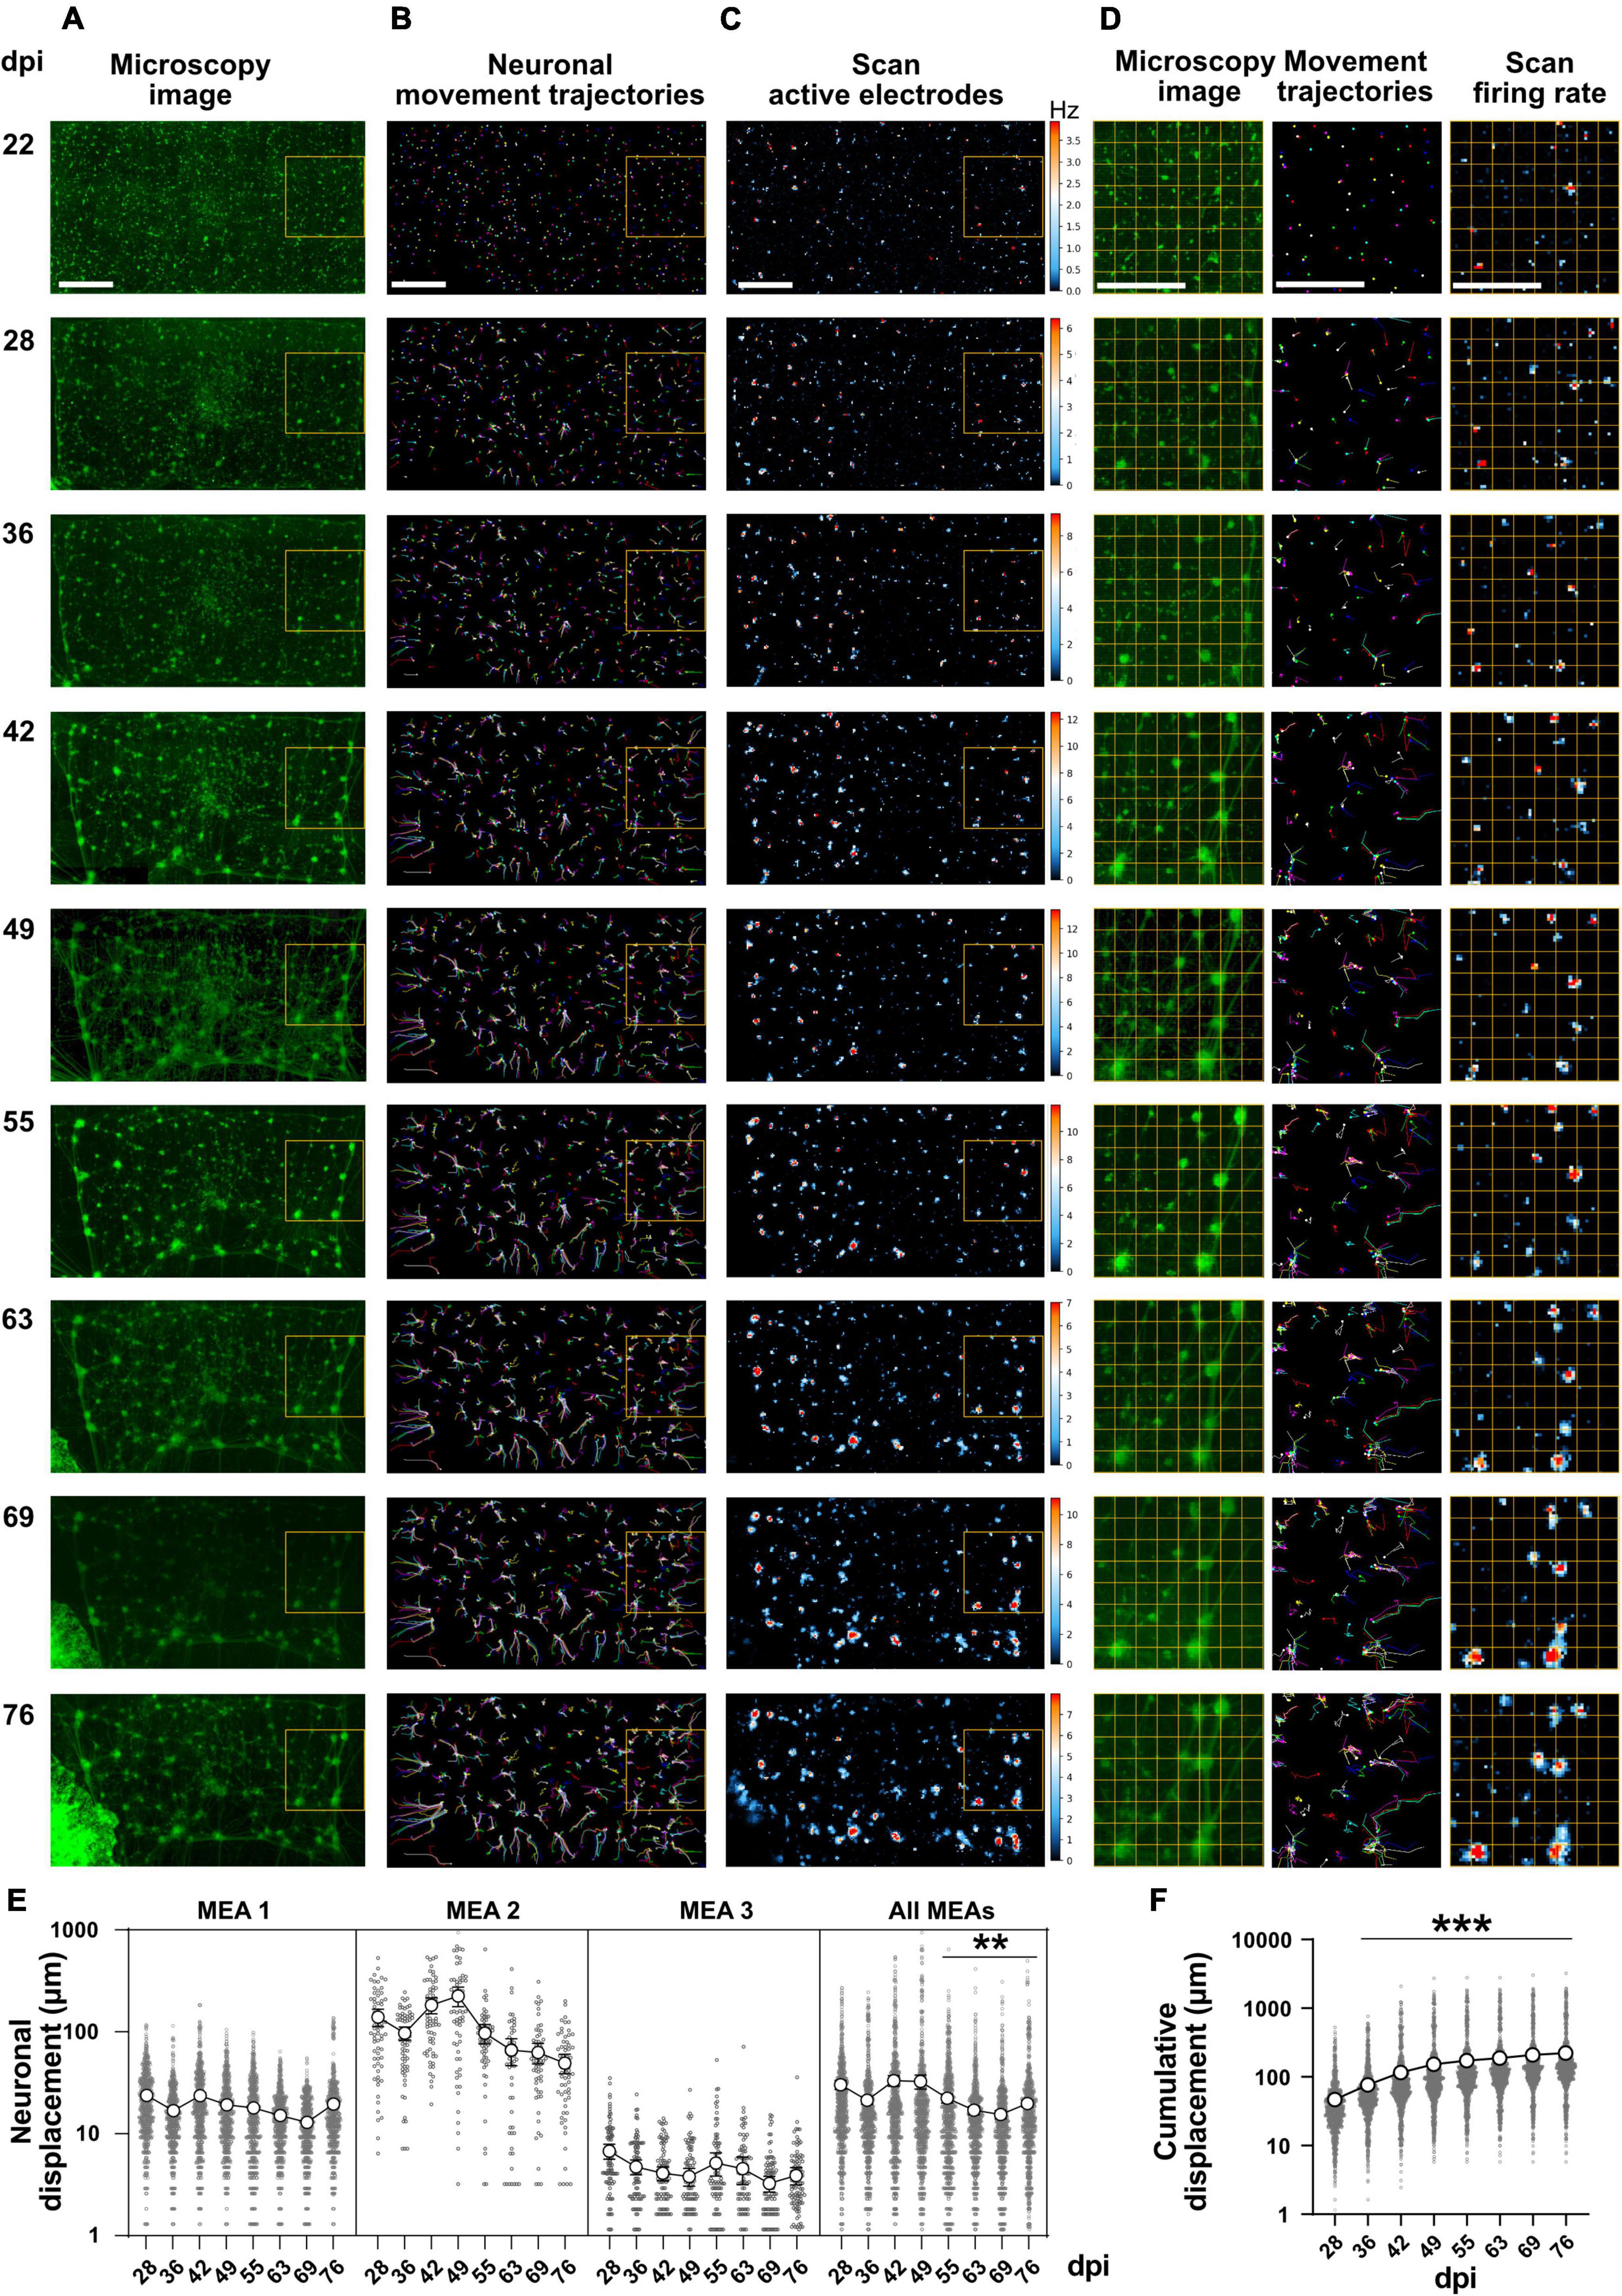
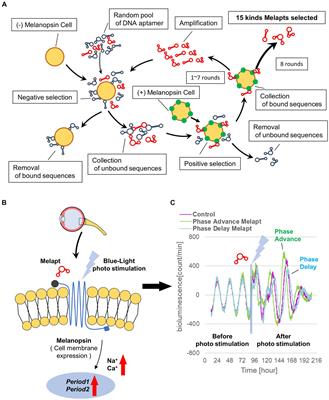
Figure 2. Network morphology and activity images at different days post induction. (A) Fluorescence microscopy images from whole networks were prepared by stitching 40 images at each time point. Magnified view of network morphology on 22, 28, and 63 dpi are illustrated in Supplementary Figure 1. Scale bar is 500 μm. (B) Neuronal movement trajectories were extracted from morphology image sequences at different weeks. A magnified view of the trajectories is shown in Supplementary Figure 2. Scale bar is 500 μm. (C) Network activity image based on firing rates. Each day, a full Activity Scan was performed that included 30 s recording from each electrode. Electrodes that showed activity are represented by blue color. The color code indicates firing rates from no activity as black, to medium activity as blue and maximum firing rates as red (firing rates have not been normalized across different days and color coding represents different scales of the activity between frames). Scale bar is 500 μm. (D) Magnified view of a network region (left column), neuronal movement trajectory (middle) and activity image of the same region (right column) at different days post induction (marked by yellow rectangles in A–C). Each image in (D) represents a sensor area including approximately 56 × 56 electrodes and each small square with yellow border represents a sensor area of approximately 7 × 7 electrodes. Scale bar is 500 μm. (E) Neuronal displacement at different days during network development in 3 individual HD-MEAs with 721, 68, and 115 neurons tracked in each MEA, respectively, and all MEAs together (N = 3 MEAs). Each circle represents the distance that a neuron shifted from the previous time point (dpi). Average displacement (n = 904 neurons) is represented as big circles with lines (**p < 0.01 vs. 28 dpi. F). Cumulative displacement of neuronal soma position between 22 and 76 dpi for 904 neurons of 3 HD-MEAs (***p < 0.001 vs. 28 dpi). Data have been collected from 904 neurons in 3 HD-MEAs at 8 time points between 28 and 76 dpi and were compared using Kruskal-Wallis test followed by Dunn’s multiple comparison test. Percentage of neurons showed specific measure of displacement have been represented in Supplementary Figure 4.
Electrophysiology recordingsSingle-well HD-MEAs (MaxOne, MaxWell Biosystems, Switzerland) were used for plating neurons and recording from developing networks. MaxOne MEAs consist of 26,400 electrodes that have been arranged in a 120 × 220 configuration with 17.5 μm center-to-center electrode pitch (Ballini et al., 2014; Müller et al., 2015). These electrodes cover a large sensor area (3.85 × 2.10 mm2). A MaxOne HD-MEA system (MaxWell Biosystems, Switzerland) was used to readout electrophysiology data from MaxOne chips. The MaxOne HD-MEA system was placed in a digital mini-incubator (VWR, Germany) to provide stable temperature conditions (37°C) during the recording. For all recordings we used the MaxLab Live software (MaxWell Biosystems, Switzerland). In all recording sessions, first, an Activity Scan Assay was performed in full scan mode to extract the active electrodes and activity image (or activity map) of the active electrodes based on their firing rate. Activity scans in the full scan mode provides the highest possible scanning solution. To this end, scanning starts automatically by recording from around 1,000 electrodes for a selected time period (e.g., 30 s) and then moves to the next set of electrodes. This process iterates 29 times to capture activity of electrodes over the entire sensor area. Based on scan results, the software calculates the activity parameters (e.g., firing rate and spike amplitude) for each electrode. Electrodes that showed more than 0.1 Hz AP frequency and average AP amplitude more than 20 μV were considered as active electrodes. A color-coded map of the whole sensor area indicating the activity level in each electrode was created (activity image/activity map). Then, we selected up to 1,024 of the most active electrodes and ran a Network Assay to simultaneously record from these electrodes for 5 min. Recorded files were used for activity analysis, burst analysis, and measurement of instantaneous firing rate. Network activity data of three HD-MEA cultures were recorded on 11 subsequent weeks between 22 and 90 dpi for measuring long-term changes in activity and burst features. Overall, the activity scan and follow up simultaneous recordings from selected neurons required around 45 min. To limit the recorded file size and recording time we had to limit the scanning time for each electrode to 30 s (which has been also proposed by the vendor). As an inevitable drawback of this method if an electrode was not active during that short period of scanning time it was excluded from analysis. The experiment was started with six HD-MEA chips of which three HD-MEAs showed stable network structure and activity for more than 3 months. The networks of the excluded MEAs have been detached in the first 3 weeks of culture and were excluded at 35 dpi.
Application of glutamatergic and GABAergic synapse blockers: Two HD-MEA cultures were used to test the inhibition of excitatory glutamate receptors and inhibitory GABAergic receptors on 118 and 120 dpi, respectively. To block glutamatergic receptors (AMPA receptors: The α-amino-3-hydroxy-5-methyl-4-isoxazolepropionic acid receptors, and NMDA receptors: N-methyl-D-aspartate receptors), a combination of 2,3-dihydroxy-6-nitro-7-sulfamoyl-benzo[f]quinoxaline (NBQX; an AMPA receptor antagonist) and (2R)-amino-5-phosphonopentanoate (APV; a selective NMDA receptor antagonist) were applied to each culture (Schmieder et al., 2022). First, 500 μl of the culture medium in each HD-MEA was drained and kept for later use. Then, Activity Scan and Network Assay were performed to record spontaneous network activity before applying NBQX+APV. Thereafter, NBQX (10 μM) and APV (50 μM) were added to each HD-MEA culture and incubated for 5 min in 37°C. Activity Scan and Network Assay were performed in the presence of NBQX+APV. The medium inside the HD-MEA was drained and cells were washed twice with warm complete BrainPhys™ medium. Pre-used medium was mixed with fresh BrainPhys™ medium (1:1), added to the HD-MEA culture and incubated for 30 min. Activity Scan and Network Assay were performed again after washout. The same steps of experiment and recording were applied for GABA-A receptor inhibition by Gabazine (10 μM) on 120 dpi.
Spike sortingTo identify individual neuronal units from extracellular recordings, all signal traces of the electrodes were spike sorted. Spike sorting was performed on the 5 min Network Assay data. All sorting steps including the pre- and postprocessing of the data were performed with the SpikeInterface framework (Buccino et al., 2020) and the Kilosort3 algorithm (Pachitariu et al., 2016). Preprocessing of the data consisted of applying a 2nd order Butterworth high pass filter with a cutoff frequency of 100 Hz and a common mean referencing step. Sorting was performed with default parameters, except that batch size was decreased to NT = 16,448 to avoid memory issues. The processed output of the spike sorting was automatically curated and units satisfying at least one the following conditions were removed: interspike interval (ISI) violation rate above 0.2, signal to noise ratio smaller than 5 and firing rate below 0.1 Hz.
Action potential frequency, instantaneous firing frequency and burst featuresExtracted time stamps from sorted data were imported into NeuroExplorer software (version 5) for analysis. AP and burst parameters were measured in 3 HD-MEA chips at 11 different time points from 22 to 90 dpi. AP frequency is calculated by dividing the total number of recorded APs by recording duration in seconds. Instantaneous firing rates capture the firing frequency of individual APs based on their interspike intervals (ISI). It is calculated by taking the inverse value of the ISI using instant frequency algorithm in Neuroexplorer (Wang et al., 2016). Instantaneous frequency was used to calculate following parameters: average instantaneous frequency in each day, percentage of fast firing APs (or spiking events) during the 5 min recording time period, and percentage of neurons that showed fast firing rates. Later we categorize neurons as fast firing neurons (>150 Hz) and slow firing neurons (<150 Hz). To measure the burst activity features we checked available algorithms in Neuroexplorer for detecting the burst events in neuronal data including an interval specification algorithm, a firing-rate-based algorithm and a surprise (probability-based) algorithm. Based on visual inspections, the surprise algorithm worked best on our dataset. The interval specification method included false positive bursts, and the firing rate-based method excluded most of the burst features. Bursts were detected and extracted using the surprise (probability) algorithm with the following parameters: 4 as minimum surprise, 20 ms minimum duration of the burst and 4 as minimum number of APs in the burst (Habibey et al., 2015b).
The Poisson surprise (PS) for a given time T containing N action potentials (APs) is calculated as:
S=-logp
With,
P=exp(-λT∑n=N∞(-λT)nn!)
and λ being the mean AP firing rate. Considering that P is the probability of N or more APs occurring randomly in a time period of T. NeuroExplorer uses a surprise maximization algorithm (Legendy and Salcman, 1985; Cotterill and Eglen, 2019) to find bursts across the AP trains of a single neuron based on following protocol: A burst is identified if three consecutive APs have an ISI of less than half of the average ISI of the spike train. Subsequent APs are added to the initial burst until the ISI becomes larger than the average ISI. For each added AP, the surprise is calculated and at the end the burst length with maximum surprise is selected. Then scanning is moving forward to find another burst.
Burst features including burst frequency, burst duration, and percentage of APs in the burst events were extracted and used for tracking the network activity dynamics during development (Wilk et al., 2016; Habibey et al., 2017). The percentage of APs in burst represents which percentage of overall APs in a neuron happens inside the burst events.
Statistical analysisThe number of active neurons within each HD-MEA device and in each specific culture age was determined based on their AP frequencies. Neurons with more than 0.1 Hz firing rate were considered as active neurons and were included. Data was collected from three HD-MEAs with a minimum of 1,065 sorted neurons in total on 22 dpi to a maximum of 3,076 detected neurons on 69 dpi. The number of sorted neurons at all-time points ranged between these two values. The average AP frequency between different days was compared using the Kruskal-Wallis test followed by Dunn’s multiple comparison test. The same test was applied to compare burst features, instantaneous frequency and neuronal movement between different days. All data are presented as mean ± standard error of mean and p-values less than 0.05 were considered significant. We also applied the Kruskal-Wallis test followed by Dunn’s multiple comparison test to compare baseline and washout conditions with NBQX+APV or gabazine treated conditions on 118 and 120 dpi, respectively.
Results Network morphology and activity images show correlated long-term changesHD-MEAs allow the scanning of all available sensing electrodes to extract a map of active electrodes with their firing rates. We used this advantage to find out how changes of the network structure over time are reflected in changes or shifts of the activity image of the network. Starting from 22 dpi, microscopy images of the whole sensor area (n = 3) were prepared and compared to maps created from Activity Scans (Figure 2). Microscopy images showed that homogenously distributed single neurons across the sensing area tend to cluster together (Supplementary Figure 1). These small clusters (diameter < 50 μm) formed around 30 dpi and are connected through axonal bundles to other clusters (Figure 2 and Supplementary Video 1). Manual tracking of neuronal cell body also confirmed clusterization of the neurons (Supplementary Video 2). As the cultures became older, some of the small clusters merged and formed large clusters (diameter > 100 μm, Figure 2, Supplementary Figure 1, and Supplementary Videos 1, 2). Time lapse images of cultures showed that this mechanical interaction between neurons and clusters constantly shifted their position on the surface of the sensing area (Supplementary Video 1). The distance that a neuron travels in each week or during the whole period of the experiment was calculated for 904 neurons in 3 HD-MEAs based on neuronal tracking data (Figure 2 and Supplementary Video 2). These data showed that at earlier time points and before cluster formation, neuronal displacement was higher compared to later time points (28.04 ± 1.40 μm per week on 28 dpi vs. 19.14 ± 0.75 μm per week on 76 dpi, p < 0.01; Figure 2E). The average displacement of neurons in each chip varied between 35.95 ± 1.96 and 1,027 ± 52.20 μm (Figure 2E). The cumulative displacement of neurons from their original position at 22 dpi showed an average shift of 224.00 ± 10.10 μm after 2 months (Figure 2F). Among all 904 tracked neurons of 3 HD-MEA cultures 76.01% shifted between 50 and 200 μm in 2 months (Supplementary Figure 4). Considering the 17 μm electrode pitch and average displacement of neurons around 224 μm, the center of mass of the activity of a neuron is shifting by more than 12 different electrodes on average. Since one neuron is recorded by several electrodes already without movement, the overall number of electrodes capturing its activity is likely much higher. Extracted activity maps from the same networks over time showed that the active regions were also regularly shifting across the sensor (Figure 2C and Supplementary Video 3). Magnified images and time laps videos revealed that alterations in shape and position of the activity maps were tightly correlated with movements of neurons and neuronal cluster on the sensor surface (Figure 2D and Supplementary Video 4). These data indicated that each network cluster is detected by a different set of electrodes as the network develops over weeks and months. Similar changes in network morphology were observed on standard MEAs with limited number of electrodes in our previous work (Supplementary Video 5; Schmieder et al., 2022).
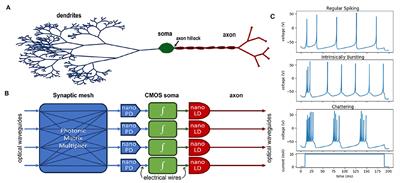
Long-term development of spontaneous activity and burst features in inducible neurogenin-derived neuronal networksData extracted (Figure 3A) from 3 MEAs at different dpi were used for tracking the network functional features. Activity appeared as individual APs in electrodes and corresponding neurons earlier than 22 dpi (Figure 3B). This changed to clear network burst activity around 63 dpi (Figure 3B). Raster plots show local bursts in individual neurons that did not propagate across the network starting from 28 dpi (Figure 3C and Supplementary Video 6). Synchronized network bursts were first detected around 49 dpi and developed into clear and synchronized burst features in later weeks around 63 dpi. These synchronized network bursts appeared with higher frequencies as the network developed further (Figure 3C and Supplementary Video 6).
FIGURE 3
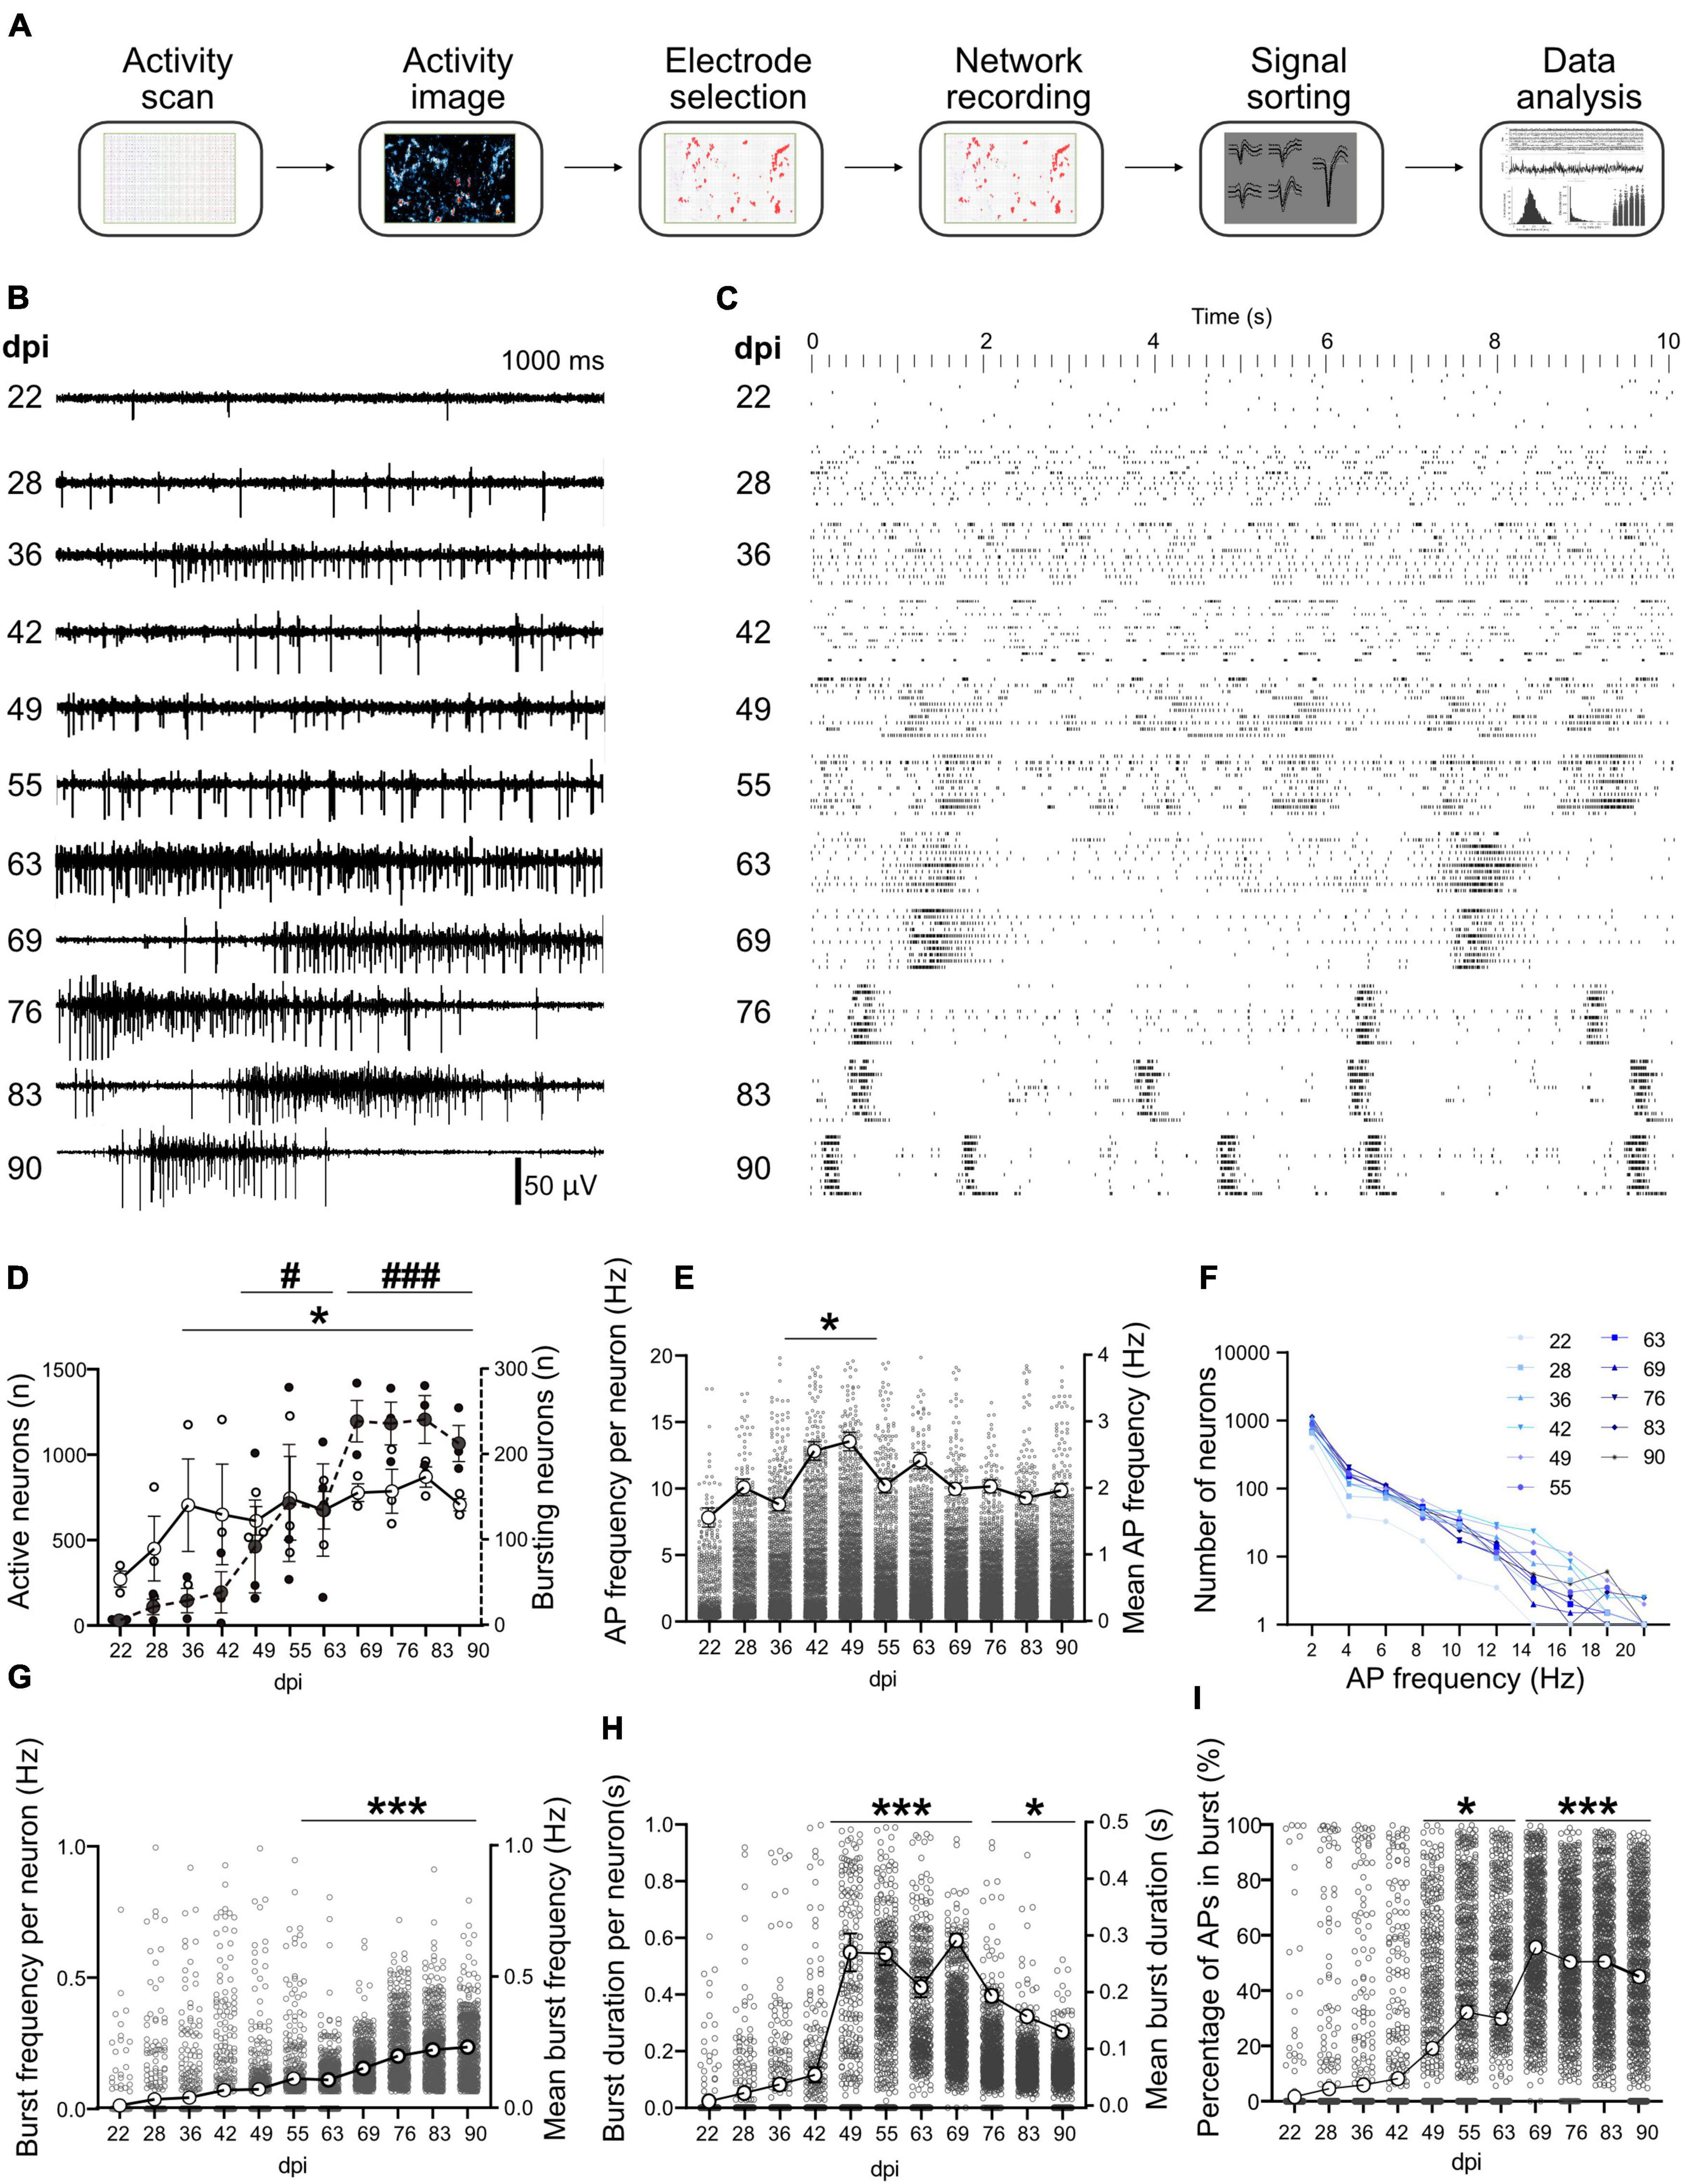
Figure 3. Long-term activity profile of developing hiPSCs-derived networks. (A) Pipeline of data acquisition and analysis. After a full activity scan of the whole array and extracting the activity image, the most active electrodes were selected and used for simultaneous recording for network analysis. Recorded data was spike sorted to identify neurons, then timestamps of neuronal activity were extracted and used for data analysis. (B) Representative signal trace in a selected electrode at different days post induction (dpi). (C) Ten second raster plot profile of detected APs in 10 neurons (aligned in rows) on different dpi. (D) Number of active neurons and number of neurons involved in network burst activity. Neurons that showed more than 0.1 Hz AP frequency were considered as active neurons. (E) Average AP frequency was calculated by dividing the total number of APs to the overall recording period at each dpi. (F) Number of neurons firing in different frequency domains at different days (color-coded). (G–I) Burst frequency, burst duration and percentage of APs that appear inside burst events at different days. Data of N = 3 MEAs with n > 1,065 neurons per day were included in the analysis (D–I) and compared between days based on Kruskal-Wallis test followed by Dunn’s multiple comparison test. *p < 0.05, and ***p < 0.001 vs. 22 and 28 dpi. For the number of neurons that contributed to burst activity #p < 0.05 and ###p < 0.001 vs. 22, 28, and 36 dpi. Each point represents the corresponding activity feature in one neuron.
The number of active neurons increased with culture age (from 272.3 ± 46.51 per HD-MEA on 22 dpi to 613.3 ± 83.32 on 49 dpi, and to its peak on 83 dpi with 870.0 ± 59.73 neurons, p < 0.05 vs. 22 dpi; Figure 3D). The number of neurons that contributed to network burst activity increased with culture age and reached 92.67 ± 21.34 neurons on 49 dpi and 213.3 ± 21.14 neurons on 90 dpi from only 6 neurons on 22 dpi (p < 0.05 and p < 0.001; Figure 3D). The average AP frequency was calculated by dividing the total number of APs to the recording period (Figure 3E). The AP firing rate reached its peak around 49 dpi (2.69 ± 0.07 Hz, p < 0.05 vs. 22 dpi with 1.55 ± 0.073 Hz, Figure 3E) and slightly declined in the following month (1.96 ± 0.05 Hz at 90 dpi, Figure 3E). The analysis of frequency domains for all recording days demonstrated that more than 51.69% of neurons tended to fire an average frequency below 2 Hz, while average firing frequencies of more than 5 Hz were detected only in less than 22.08% of neurons (Figure 3F).
Burst frequency exhibited a steady increase with culture age and reached from 0.01 ± 0.00 Hz on 22 dpi to 0.07 ± 0.01 Hz at 49 dpi and 0.23 ± 0.01 Hz on 90 dpi (p < 0.001 vs. 22 dpi, Figure 3G). Burst duration showed a sharp increase between 42 and 49 dpi (0.05 ± 0.01 s and 0.27 ± 0.02, respectively, p < 0.001; Figure 3H). Burst duration remained higher until 69 dpi (0.29 ± 0.01) and declined in following weeks (0.14 ± 0.01 on 90 dpi; Figure 3H) but were still significantly higher than on 22 dpi (p < 0.05). The percentage of APs that appear inside burst events increased with culture age and reached its peak around 69 dpi (55.51% of all APs, p < 0.001 vs. 22 dpi with 1.6 ± 0.39%, Figure 3I) and remained high for the rest of the study (Figure 3I).
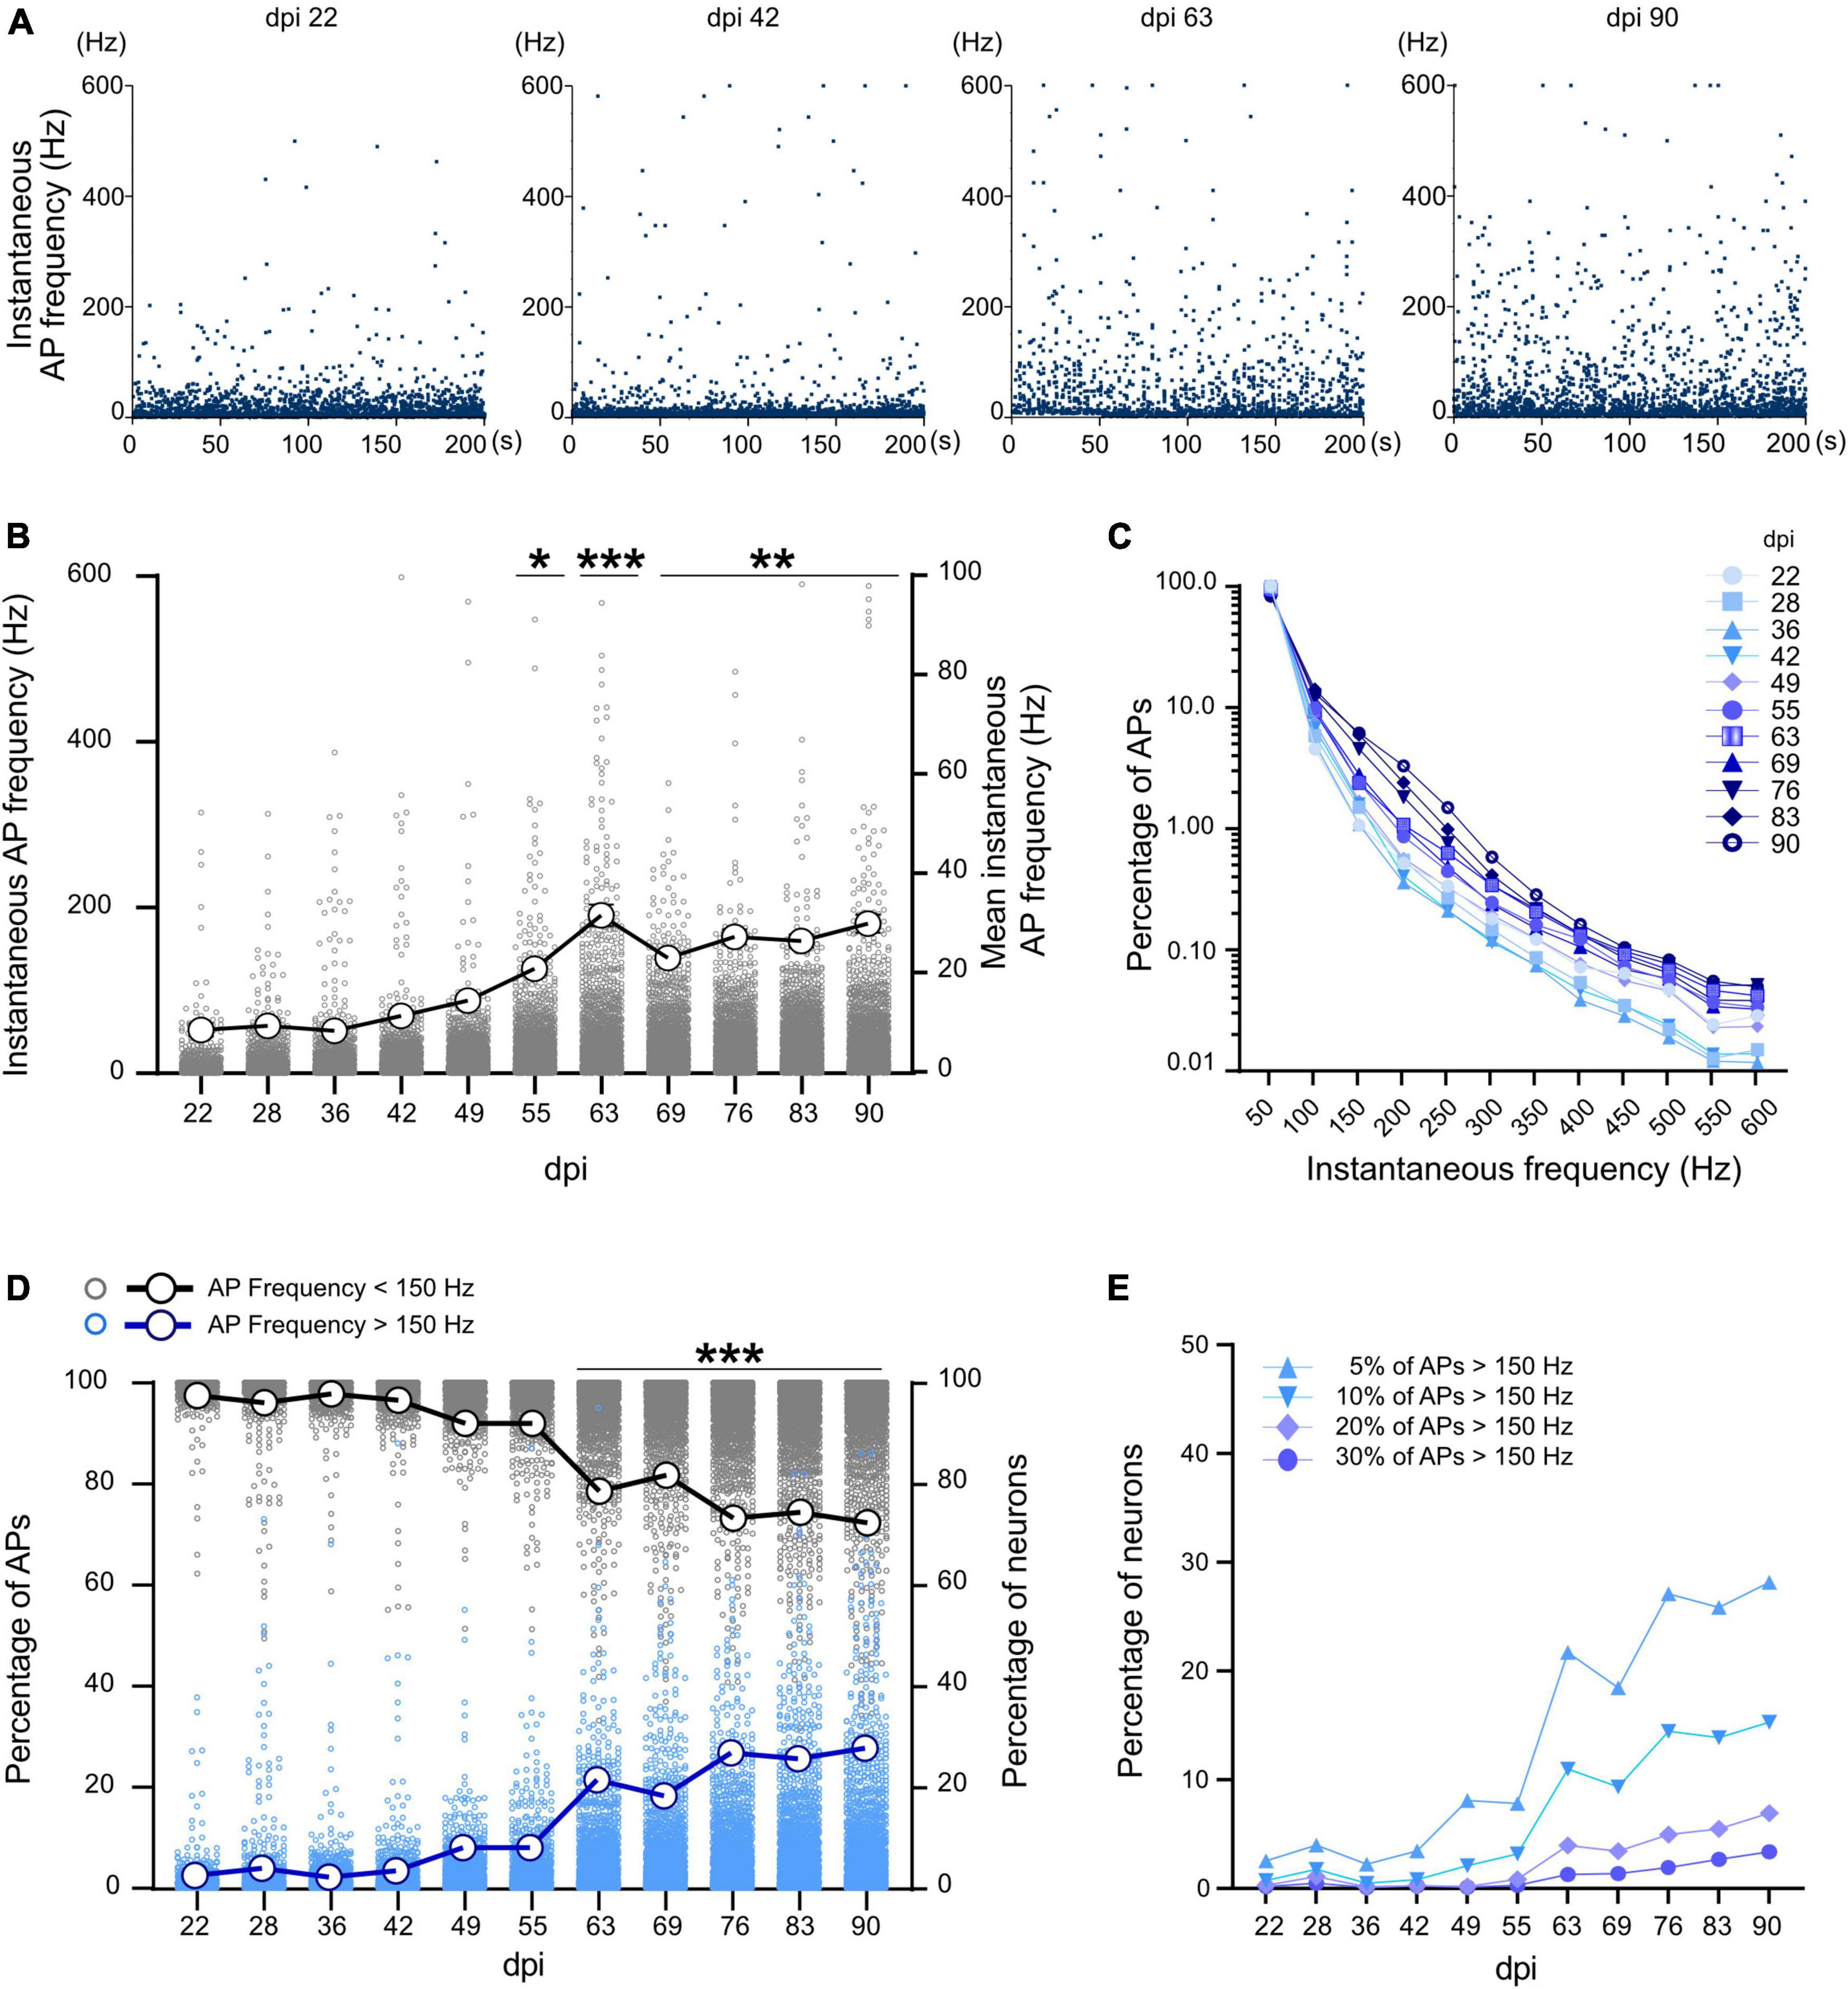
Development of instantaneous firing rate and fast spiking neuronsAs inhibitory neurons are fast-spiking and capable of firing in frequencies above 100 Hz, we extracted the spiking profile of neuronal activity using instantaneous firing rates. The average AP frequency during the whole recording period represents the mixture of active and silent states of neuronal activity (section “Long-term development of spontaneous activity and burst features in iNGN-derived neuronal networks”). The instantaneous firing frequency, on the other hand, is calculated based on individual ISIs between AP pairs, and provides detailed temporal information about neuronal activity. Instantaneous firing rate data enables to identify the maximal firing frequency of neurons. Average and maximum instantaneous frequency (n = 3 MEAs and more than 1,065 neurons) showed an increase during 3 months from 8.44 ± 0.62 Hz and 315 Hz at 22 dpi to 29.88 ± 0.93Hz and 588.1 Hz at 90 dpi, respectively (p < 0.001, Figures 4A,B). A sharp increase in average and maximum instantaneous frequency was observed after 63 dpi (31.57 ± 1.12Hz and 567.9 Hz, respectively, p < 0.001 vs. 22 dpi, Figure 4B). Percentage of high frequency spiking events (150–600 Hz) increased from 2.66% on 22 dpi to 11.33% on 90 dpi (Figure 4C). The percentage of neurons with at least 5% high frequency spiking events (>150 Hz) increased after 63 dpi (reached from 2.52% on 22 dpi to 27.74% on 90 dpi, p < 0.001, Figures 4D,E).
FIGURE 4
Figure 4. Instantaneous firing frequency in developing neuronal networks. (A) Instantaneous frequency of individual APs (spiking events) in a selected neuron at different time points. Each data point represents the instantaneous frequency of specific pair of APs during a 200 s recording period. (B) Average instantaneous frequency at different time points. Each data point represents the average instantaneous frequency of a neuron at particular dpi. Mean of the average frequencies in all neurons represented by large circles and thick line. (C) Distribution of the percentage of spiking events over the instantaneous frequency domains at different days (n > 400,000 events per dpi, N = 3 MEAs). (D) Percentage of APs with more than 150 Hz (blue) and less than 150 Hz (gray) in all neurons (n > 1,064 neurons). The thick blue line represents percentage of neurons with at least 5% of high frequency (>150 Hz) spiking events and the thick black line represents the percentage of the neurons with at least 95% low frequency spiking events (<150 Hz). (E) Percentage of neurons which have 5, 10, 20, or 30% of their spiking events in the high frequency domain (<150 Hz). Data between days were compared based on Kruskal-Wallis test followed by Dunn’s multiple comparison test. *p < 0.05, **p < 0.01, and ***p < 0.001 vs. 22, 28, 36, and 42 dpi.
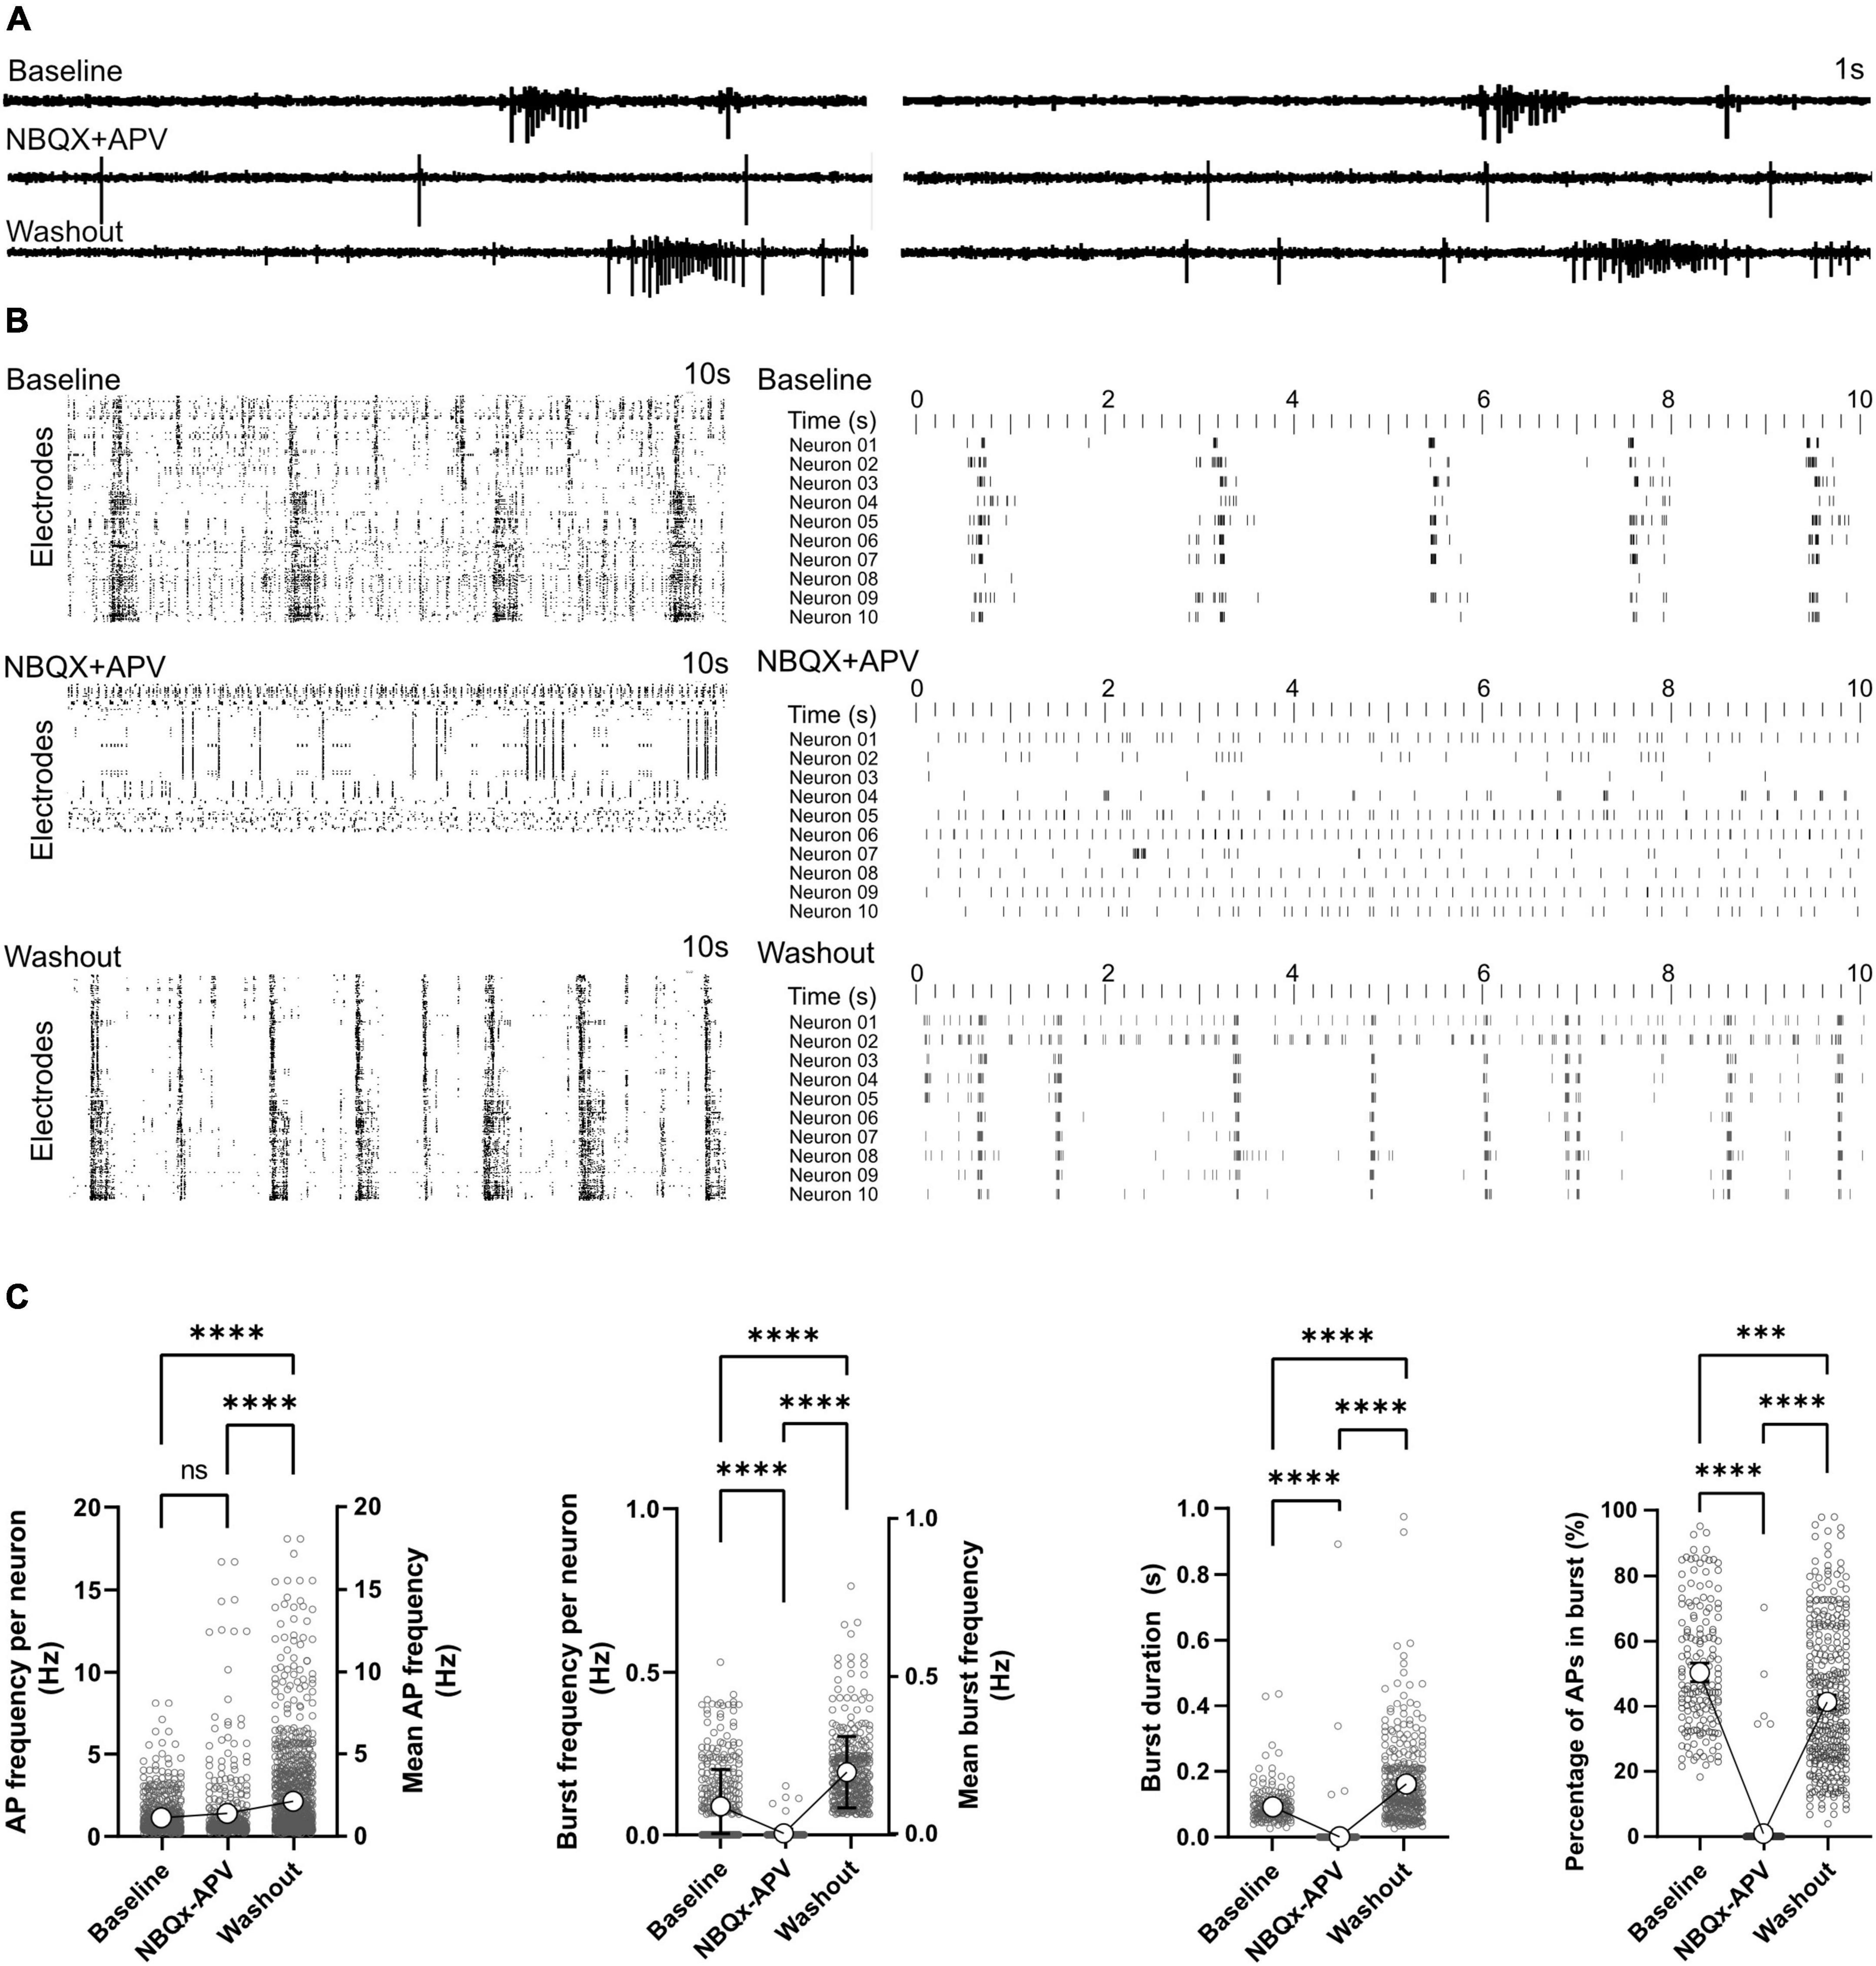
Effect of AMPA and NMDA receptor antagonist on network functionActivity scans and network analyses were performed before, during and after the treatment with glutamatergic synapse blockers (NBQX+APV). Signal traces in electrodes showed that in the presence of the NBQX+APV, synchronized burst features vanished and only individual APs and localized bursts (Figure 5A) were detectable. Raster plots of activity also indicated the lack of synchronized burst activity in NBQX+APV treated conditions (Figure 5B). Burst features re-appeared in the recorded signal profile and raster plots after washing the NBQX+APV out (Figures 5A,B). The number of active neurons decreased from 595 neurons at baseline to 407 neurons in presence of the NBQX+APV (Supplementary Figure 5). AP firing frequency of remaining active neurons was not affected by NBQX+APV treatment (0.13 ± 0.04Hz in baseline and 1.39 ± 0.11Hz in treated condition, p = 0.35; Figure 5C). After washout, AP frequency increased to 2.12 ± 0.09 Hz (p < 0.0001 vs. baseline and treated condition). Only few neurons out of thousands of neurons showed burst activity in the presence of NBQX+APV (Figures 5B,C). Burst frequency, duration and percentage of APs in the burst decreased significantly by NBQX+APV treatment (p < 0.0001 vs. baseline, Figure 5C). Burst parameters increased after washout (burst frequency and duration: p < 0.0001 vs. baseline and percentage of APs in burst: p < 0.001; Figure 5C). It has been shown that media exchange affects the network activity which lasts for approximately 1 day. Unfortunately, in the current experiment design the activity changes related to the washout were inevitable. Whether the activity changes after chemical treatment are a result of releasing inhibitors from synapses or indirectly from the media exchange is hard to explain. However, during the chemical treatment there was no media exchange and effects are directly related to the applied blockers.
FIGURE 5
Figure 5. Effect of AMPA and NMDA receptor antagonists on network function. AMPA and NMDA receptors were blocked by NBQX+APV in two HD-MEAs on 118 dpi. Activity was recorded and analyzed for 5 min in the baseline, treatment and washout conditions. (A) Signal traces in two electrodes at baseline, under NBQX+APV treatment and washout. (B) Ten second raster plot of activity in all active electrodes (left) and 10 selected neurons (right) in the three different conditions with each row representing an electrode or neuron. (C) AP and burst frequency, burst duration and percentage of APs appearing in burst events were compared between the three conditions using Kruskal-Wallis test followed by Dunn’s multiple comparison test. ***p < 0.001 and ****p < 0.0001. Each point represents the corresponding activity feature in one neuron.
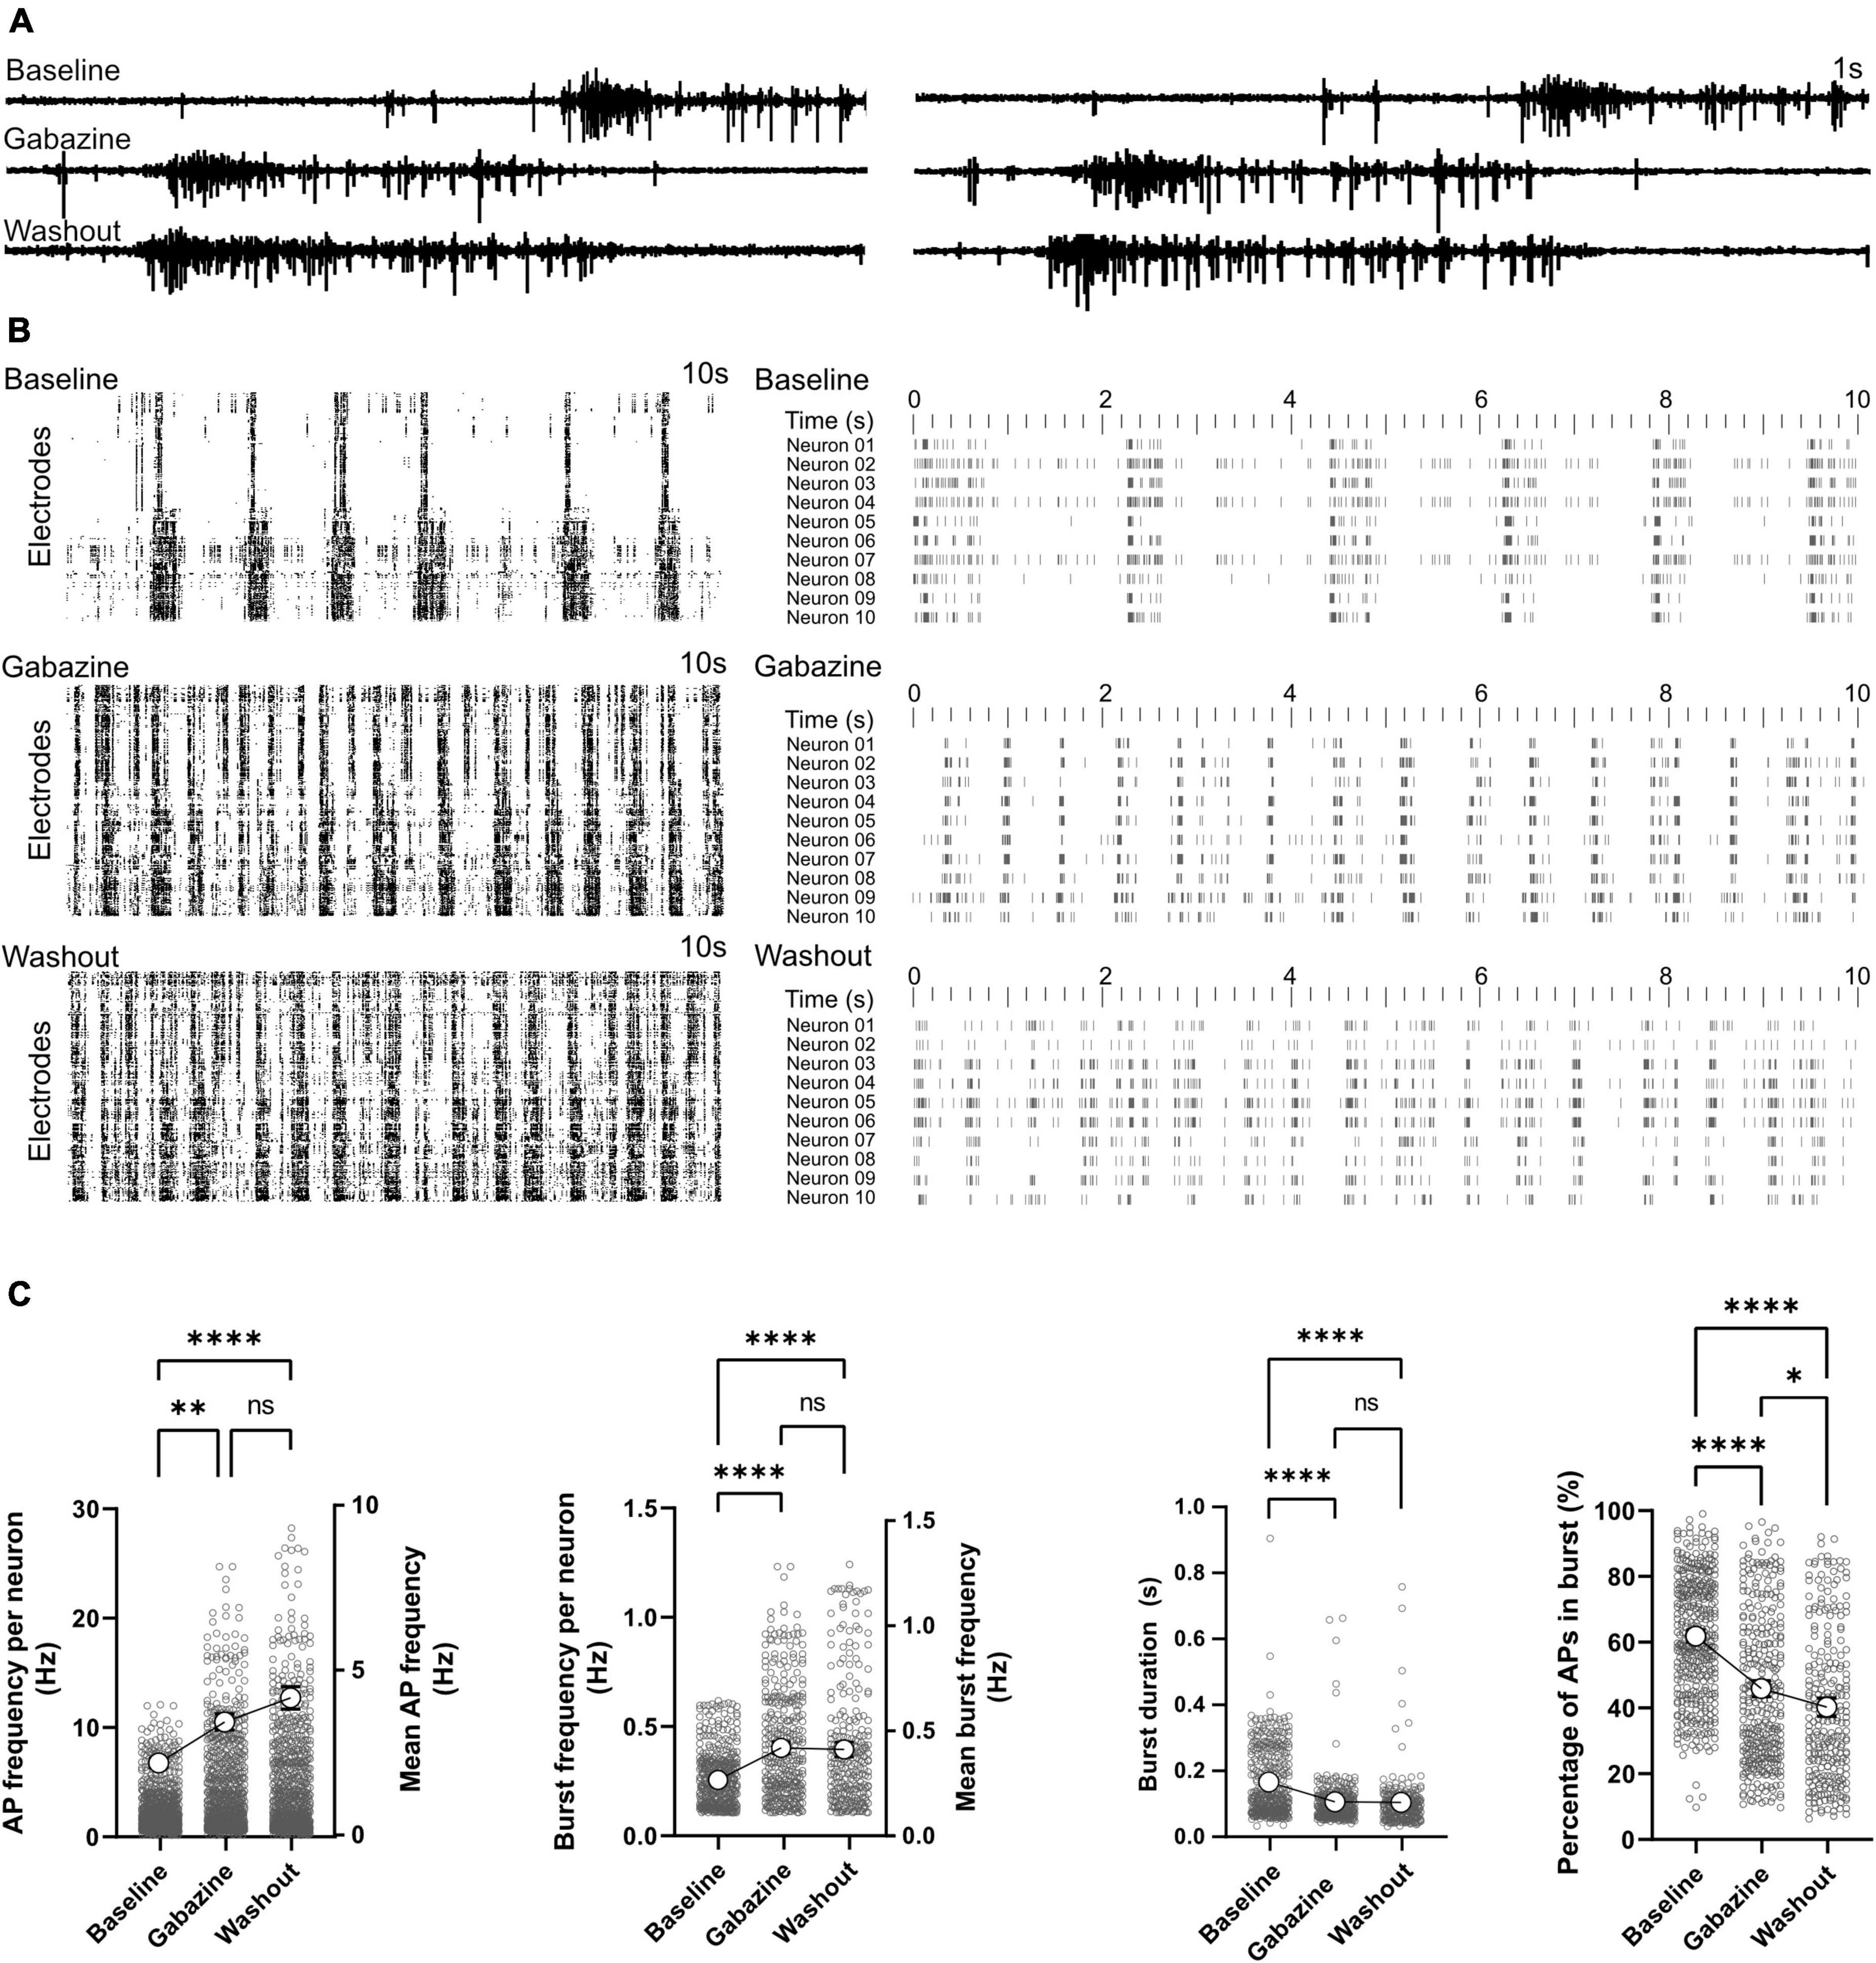
Effect of GABA-A receptor antagonist on network functionActivity scans and network analysis were performed at baseline, during and after treatment with GABAergic synapse antagonist gabazine. Representative signal traces of two electrodes in the presence of gabazine are shown in Figure 6A. Activity raster plots revealed an increase in network burst rate when treated with gabazine (Figure 6B). Based on the raster plot profile, this increase in bursting rate remains stable after washout (Figure 6B). Statistical analysis of our time stamp data showed a significant increase in neuronal AP firing frequencies in the presence of gabazine (2.18 ± 0.07 Hz in baseline and 3.43 ± 0.12 Hz in treated condition, p < 0.01; Figure 6C). Neuronal AP frequencies remained higher after washout and reached 4.16 ± 0.17 Hz (p < 0.0001 vs. baseline and p = 0.36 vs. gabazine treated condition). The burst frequency was elevated by gabazine treatment (0.42 ± 0.01 Hz vs. 0.27 ± 0.01 Hz in baseline, p < 0.0001; Figure 6C) and remained higher after washout (0.41 ± 0.02Hz, p < 0.0001 vs. baseline). The duration of bursts decreased by gabazine treatment from 0.16 ± 0.01s to 0.10 ± 0.01 s (p < 0.0001; Figure 6C). The percentage of APs in bursts also decreased by gabazine treatment (45.25 ± 1.23% vs. 61.33 ± 0.99% in baseline, p < 0.0001; Figure 6C). After washout, burst duration and percentage of APs in bursts remained lower than baseline conditions (p < 0.0001; Figure 6C).
FIGURE 6
Figure 6. Effect of GABA-A receptor antagonist on network function. GABA-A receptors were blocked by gabazine in two HD-MEAs on 120 dpi. Baseline activity, activity under gabazine treatment and activity after washout were recorded. (A) Signal traces recorded from two electrodes at baseline, under gabazine and after washout. (B) Raster plot of activity in individual electrodes (left) and 10 selected neurons (right) in the three different conditions with each row representing an electrode or neuron. (C) AP and burst frequency, burst duration and percentage of APs appearing in burst events were compared between the three conditions using Kruskal-Wallis test followed by Dunn’s multiple comparison test. *p < 0.05, **p < 0.01, ****p < 0.0001, and ns, non-significant. Each point represents the corresponding activity feature in one neuron.
DiscussionA key step to enable hiPSC-derived neuronal cultures as reliable in vitro models of developing brain circuits is to generate functionally robust networks (McCready et al., 2022). This needs to be accompanied by enhanced access to the network activity and morphology data with optimal spatial and temporal resolution at the neuronal cell level (Dragas et al., 2017; Diggelmann et al., 2018; Yuan et al., 2020; Ronchi et al., 2021). Most importantly, these networks require long-term viability to allow proper maturation of the network structure and function, and to measure their developmental features for an extended period (Saalfrank et al., 2015). Previous studies on hiPSC-derived networks were either limited to short-term evaluation of less than a month (Ronchi et al., 2021; Akarca et al., 2022) or probing the activity with conventional MEAs with limited number of electrodes (Odawara et al., 2014, 2016; Hyvärinen et al., 2019; Lu et al., 2019; Schmieder et al., 2022). Here we exploited the advantages of HD-MEAs and our established long-term culturing protocol for hiPSC-derived networks (Klapper et al., 2017; Sauter et al., 2019; Schmieder et al., 2022) to extract functional and morphological data of developing hiPSC-derived networks for 3 months. We constantly applied astrocyte-conditioned medium to the neuronal cultures to improve their functional maturation (Klapper et al., 2017; Taga et al., 2019).
To the best of our knowledge, long-term HD-MEA-based recordings from hiPSC-derived networks have only been studied by Amin et al. (2016), where they reported changes in AP frequency but mainly focused on network responses to electrical stimulation. In our previous work, we generated long-term hiPSC-derived networks on standard MEAs with 60 electrodes (Schmieder et al., 2022). Time-lapse images from these cultures at different weeks revealed large-scale changes in the network morphology (Supplementary Video 4). These inherent changes in developing networks with continuous movement of neuronal cells on low-density MEA substrates can affect the quality of recorded data such that functional neurons are no longer captured since they moved too far from the electrodes to be recorded. Here we tried to overcome this issue by using HD-MEAs, which enable capturing active regions on the whole sensor area with higher spatial resolution. Our data demonstrated that HD-MEAs are capable of tracking dynamic changes in neuronal position and network morphology (Figure 2 and Supplementary Videos 1–3). Therefore, to obtain reliable functional data from long-term networks, a full activity scan prior to the network recording is crucial to get a complete network activity map and identify the position of the neurons and clusters. This enables to record from identical neurons over months and to robustly track their functional phenotype at different culture ages. Nevertheless, limitations of the technology and used scanning assays is that only 1,024 electrodes can be recorded simultaneously thus making it possible to only capture a part of the network. Also, scanning the whole electrode area requires long recording sessions.
Physical expansion of the brain volume during development requires an optimized wiring economy to facilitate communication between neurons in close vicinity or large distance (Wang and Clandinin, 2016; Casanova and Casanova, 2019). This wiring principle leads to modular and clustered network structures in which neurons and regions performing functionally related tasks are typically adjacent to decrease the wiring costs (Bassett and Bullmore, 2006; Wang and Clandinin, 2016; Casanova and Casanova, 2019). Examples of structural clustering are cortical folding and gyrification in order to bring structurally separated regions together (Wang and Clandinin, 2016; Chavoshnejad et al., 2021). Separation of gray and white matter in vertebrates is another example of how local circuits or modules are clustered but connected through long-range axons (Wang and Clandinin, 2016; Richards and Van Hooser, 2018; Martinez and Sprecher, 2020). In the present work, morphological images as well as functional activity maps revealed that individual neurons are pulled together to form small clusters beginning in the second month of culturing. Larger clusters were formed from smaller clusters merging together beginning in the third month (Figure 2 and Supplementary Videos 1, 2). These clusters were connected through axonal bundles, mimicking the primitive regionalization and folding of the developing human brain (Figure 2). In a previous study, Tibau et al. (2020) generated clustered and semi-clustered rat cortical networks and compared their functional features with homogenously distributed cortical networks for 2 weeks. Aggregated circuits showed higher burst rates and functional connectivity features, which emphasizes the influence of neuronal spatial arrangement on network function (Tibau et al., 2020). Modular networks engineered in microfluidic devices with clustered network architecture and controlled connectivity between clusters have also shown an enhanced activity profile (Nam et al., 2004; Levy et al., 2012; Marconi et al., 2012; Yamamoto et al., 2018; Park et al., 2021). These results are in accordance with our long-term data that showed enhanced activity and burst parameters correlating with morphological changes from homogenously distributed to clustered networks. Thus, it can be hypothesized that the observed clustering behavior is a result of the inherent developmental tendency of neurons to form functional clusters in their vicinity and to bundle the axons for long-range communication. Even though the chip surface is prepared to allow good adherence of the cells, migration is still occurring further supporting this hypothesis. Also, clustering and bundle formation is observed in other neuronal in vitro cultures as well (Segev et al., 2003; Tibau et al., 2020; Antonello et al., 2022).
We continuously extracted electrophysiology data of long-term cultures. iNGN cells have been shown to become of neuronal type with a very high efficiency upon doxycycline induction as confirmed by FoxG1 and Map2- staining and RT-qPCR analysis (Lu et al., 2019). We monitored healthy development of the cultures by microscopy. Spike sorting was applied to extract the activity profiles of individual neurons in each recording. These data demonstrated that activity in developing iNGN-EGFP-derived networks evolved from single and sparse APs in the first month post induction to localized burst activity in the second month and developed to synchronized bursts across the network in the third month. Burst features followed separate trajectories during the development. While burst frequency showed a steady increase, burst duration experienced a peak in the second month and slightly declined in the third month. The percentage of APs that occur in burst events remained high after reaching a peak around 69 dpi. Previous studies on developing prenatal and postnatal human and rodent brains, and in vitro primary networks indicated spontaneous synchronized network burst activity as a key functional feature of developing neocortical circuits (Khazipov and Luhmann, 2006; Kilb et al., 2011; Luhmann et al., 2016). Correlated burst activity facilitates functional maturation of the network and is essential for the formation of cortical circuits (Khazipov and Luhmann, 2006). Bursts with a high content of APs reliably cross through weak synapses and trigger postsynaptic activity that is necessary for enhancing neuron-to-neuron synaptic communication (Zeldenrust et al., 2018). Here, we tested the role of excitatory synapses on the presence of burst features by inhibition of the glutamatergic synapses. This erased the synchronized burst features from our recordings and decreased number of the active neurons. Sustained AP firing and a constant frequency in presence of NBQX+APV compared to the baseline suggested that neurons are still active but are effectively blocked from synaptic communication. It can be concluded that excitatory synapses are the main feature through which network bursts are mediated in iNGN cultures.
In contrast to the earlier development of glutamatergic transmission in embryonic stages within rodent and human brains, the GABAergic system requires longer time for maturation (Bagasrawala et al., 2017; Warm et al., 2022). Delayed maturation of GABAergic synapses in the postnatal period overlaps with the emergence of strong burst activity in the developing mammalian brain (Khazipov and Luhmann, 2006; Luhmann et al., 2016; Luhmann and Khazipov, 2018). Lu et al. (2019), have shown that the percentage of GABAergic neurons in developing iNGN-derived networks increases by culture age and reaches 2.3% at 30 dpi. They also showed that GABA receptor antagonist Picrotoxin (PTX) increases the firing rate and burst frequency. Early during brain development, GABAergic synaptic transmission is excitatory and switches to mature inhibitory neurotransmission in the early postnatal period (Ganguly et al., 2001). The GABAergic switch has also been demonstrated in hiPSCs-derived neuronal organoids around day 40 (Zafeiriou et al., 2020). In our study, iNGN-EGFP networks at 120 dpi were used for studying GABA signaling that gave sufficient time for maturation of these synapses. Our results showed that inhibition of the GABA-A receptors induced an increase in AP and burst frequency. These results demonstrated that at 120 dpi the GABAergic system has already switched into inhibitory neurotransmission.
A major part of the cortical inhibitory neurons are fast spiking GABAergic neurons that are functionally critical for modulating excitatory activity (Galarreta and Hestrin, 2002). Normally, these inhibitory neurons are identified by their fast responses to current injection (Damodaran et al., 2014). Maximal firing rates of fast spiking neurons have been determined based on their instantaneous frequency in brain slices of human, monkey, and mouse and as well in behaving monkey and mouse (Wang et al., 2016). In the current work we showed that in a small fraction of neuronal cells instantaneous AP frequency was more than 150 Hz. Percentage of fast spiking events and neurons increased sharply around 63 dpi that coincides with maturation of the burst features. These data together indicated that the emergence of the GABAergic system and its maturation regulates the characteristics of network bursts. This is in line with results obtained from the developing postnatal brain that demonstrate involvement of GABAergic signaling on modulating the spontaneous and sensory-evoked burst activity of neuronal circuits (Bonifazi et al., 2009; Butt et al., 2017; Warm et al., 2022). Other in vitro studies in which different ratios of inhibitory and excitatory neurons in the culture caused changes in bursting and overall network behavior support our findings (Chen and Dzakpasu, 2010). Especially the interplay of excitatory NMDA and inhibitory GABA receptors are essential for the formation of different patterns of synchronized network activity (Teppola et al., 2019). This is in line with our data that suggested an effect of GABAergic system on synchronized network bursts development. Due to the strong influence of GABA antagonists on network activity it can be hypothesized that also network composition and cell identity are changing over time. Moreover, it still must be dissected how the clustering of cells and cell maturation are influencing the network activity or if and how they are connected.
ConclusionOur data indicated the importance of long-term continuous data readouts from developing hiPSC-derived networks to obtain robust results and show functional dynamics of developing networks in detail. Long-term tracking of network morphology revealed constant changes in the position of neuronal cells and clusters that were reflected in network activity images obtained by HD-MEA recordings. Neuronal migration, formation of the clusters and extended axonal bundles for 3 months resemble morphological changes in expanding and folding cortical networks. Such changes in morphology and network coordinates must be taken into account when designing in vitro experiments. This is especially the case when looking at network functional connectivity maps since changes in network morphology directly influence functional connectivity and cannot be assumed as stable parameter over time. Our data exhibited in detail the emergence and maturation of the spontaneous and synchronized burst activity resembling the functional features of the developing brain during the prenatal and postnatal periods. Large variations in burst features during in vitro network development suggested the criticality of selecting limited time points in short-term studies to predict network functional phenotype. This can become even more critical when functional phenotype of healthy or diseased networks are predicted based on snapshots of short-term data without considering long-term network maturation profiles in the analysis. Further analysis is needed to see how closely in vitro network development is following the in vivo states with morphology and potentially cell identity changing simultaneously. It is also noteworthy that iNGN networks functionally mature within 3 months, displaying robust spontaneous activity. As these networks morphologically drift over time, HD-MEA have the resolution to detect these movements as well as have the resolution to facilitate continuous recordings. Therefore, using HD-MEA significantly increases the functional readouts of human stem cell-derived neuronal networks, i.e., one needs less MEA cultures per cell line and experiment.
Data availability statementThe original contributions presented in the study are included in the article/Supplementary material, further inquiries can be directed to the corresponding author.
Author contributionsVB: conceptualization. VB, JC, RH, and JS: methodology. JS, FS, and RH: software and validation. RH and JS: formal analysis, investigation, visualization, and data curation. RH, JS, and VB: writing-original draft. RH, JS, FS, JC, and VB: writing—review and editing. VB and JC: supervision, project administration, resources, and funding acquisition. All authors contributed to the article and approved the submitted version.
FundingVB acknowledges support by the Volkswagen Foundation (Freigeist—A110720), the Paul Ehrlic
留言 (0)