Data Sources
Five clinical studies were utilized in the population pharmacokinetic analyses, namely one phase 1 (NCT02596217 [10], study 1) study in healthy participants, one phase 2 study (NCT02719171 [11], study 2) with an extension study (NCT02986373 [12], study 3), and two pivotal phase 3 studies (NCT03675308/KEEPsAKE 1 [5] and NCT03671148/KEEPsAKE 2 [6], study 4 and study 5, respectively). The latter four studies were all in patients with active PsA. The two phase 3 studies (studies 4 and 5) were utilized in the exposure–response analyses. Safety and efficacy data as well as detailed descriptions of these studies have been reported previously [5, 6]. Brief summaries of these studies with details pertinent to the analyses herein are provided in Supplementary Material (Supplementary Table S1).
All studies were conducted in accordance with Good Clinical Practice guidelines and the ethical principles that have their origin in the Declaration of Helsinki. The protocols and informed consent forms were approved by the ethics committee or institutional review boards at each site, and all participants provided written informed consent prior to any study-related procedures.
Pharmacokinetic Sampling and Analysis
A summary of blood sample collection times for analysis of risankizumab and anti-drug antibody (ADA) concentrations for each study is provided in Supplementary Table S1. Risankizumab plasma or serum concentrations were determined by a validated enzyme linked immunosorbent assay with a lower limit of quantitation (LLOQ) of 5, 10, and 4.34 ng/mL for the phase 1, 2, and 3 studies, respectively [13]. The presence of ADAs to risankizumab was assessed via a tiered approach using a validated electrochemiluminescence assay (screening, confirmatory, and titration analysis as appropriate) [14]. All samples positive for ADA were further characterized in a validated neutralizing antibody (NAb) assay [13, 14].
Population Pharmacokinetics Analyses
A population pharmacokinetic model developed using data from healthy participants and patients with moderate to severe chronic plaque psoriasis [10] was leveraged and refined using data from patients with active PsA.
Comparison of Risankizumab Pharmacokinetics in Psoriasis and Psoriatic Arthritis
To demonstrate the appropriateness of leveraging the psoriasis population pharmacokinetic model in PsA, graphical comparisons were carried out as follows:
The observed risankizumab concentrations in patients with plaque psoriasis treated with the approved clinical regimen of 150 mg SC at weeks 0 and 4, and q12w thereafter (referred to hereafter as “clinical regimen”) in phase 3 psoriasis studies were compared graphically with the observed risankizumab concentrations in patients with active PsA enrolled in phase 2 and 3 studies and treated with the same clinical regimen.
A simulation-based comparison using the parameter estimates from the previously developed psoriasis model [10] and the patient-specific information in PsA phase 2 and 3 studies was performed through simulations of 1000 replicates of the plasma concentration data for the PsA phase 2 and 3 studies based on the actual dose administered and sampling time. Median and 5th and 95th percentiles of the observed data were compared graphically with the 95% confidence intervals (CIs) of the corresponding percentiles of the simulated data.
Population Pharmacokinetic Model Development for Psoriatic Arthritis
The psoriasis population pharmacokinetic model (described as “starting model” hereafter) was fit to the data. This was a two-compartment model with first-order processes describing SC absorption and elimination, and with risankizumab clearance correlated with weight, baseline serum albumin, baseline serum creatinine, baseline high-sensitivity C-reactive protein (hsCRP), and relatively high ADA titers. Model parameters were estimated using the first-order conditional estimation method with interaction between interindividual variability (IIV) and residual variability [FOCE with η–ε INTERACTION].
For each of the covariate effects included in the starting model, the relationship was retained if the 95% CIs did not overlap with 0 and its removal from the model rendered a statistically significant worsening in the model fit (at α = 0.001; similar to the criteria used in the development of the starting model). The resulting “base model” was refined in a stepwise forward inclusion (α = 0.01) and backward elimination (α = 0.001) covariate search [15] as implemented in Perl Speaks NONMEM (PsN Version 4.8.1) to evaluate the statistical significance of other covariates that could be relevant to the PsA population. Covariates tested included: age, sex, race, baseline levels of alanine transaminase, aspartate transaminase, total bilirubin, creatinine clearance, baseline Disease Activity Score in 28 joints (DAS28 score), baseline Health Assessment Questionnaire-Disability Index (HAQ-DI) score, Psoriasis Area Severity Index (PASI) score, duration of disease, presence of axial spondylitis, number of prior biologic therapies, number of prior conventional synthetic disease-modifying antirheumatic drugs (csDMARDs), concomitant use of methotrexate, and immunogenicity. The cutoff value identified in the previous analyses [10] for the ADA effect on risankizumab clearance was adjusted depending on the dilution factor used for the ADA assay in each of the studies.
After establishing the final model structure, the fixed and random effects parameter estimates were updated; goodness-of-fit plots, bootstrap analyses, and visual predictive checks (VPCs) were used to support model evaluation and selection. After identifying statistically significant covariates for risankizumab pharmacokinetic parameters, simulations were carried out for 10,000 virtual subjects, with IIV, without residual error to evaluate their impact on risankizumab steady-state concentration at the end of a dosing interval (Ctrough) and area under the concentration–time curve over a dosing interval (AUCtau).
Risankizumab exposures [maximum concentration (Cmax), AUCtau, and Ctrough] were simulated using the final population pharmacokinetic model for virtual subjects with active PsA who were administered the clinical regimen. Exposures were summarized over the first (weeks 0–4), second (weeks 4–16), and third (weeks 16–28, representing steady-state values) dosing intervals.
Exposure–Response Analyses for Efficacy and Safety
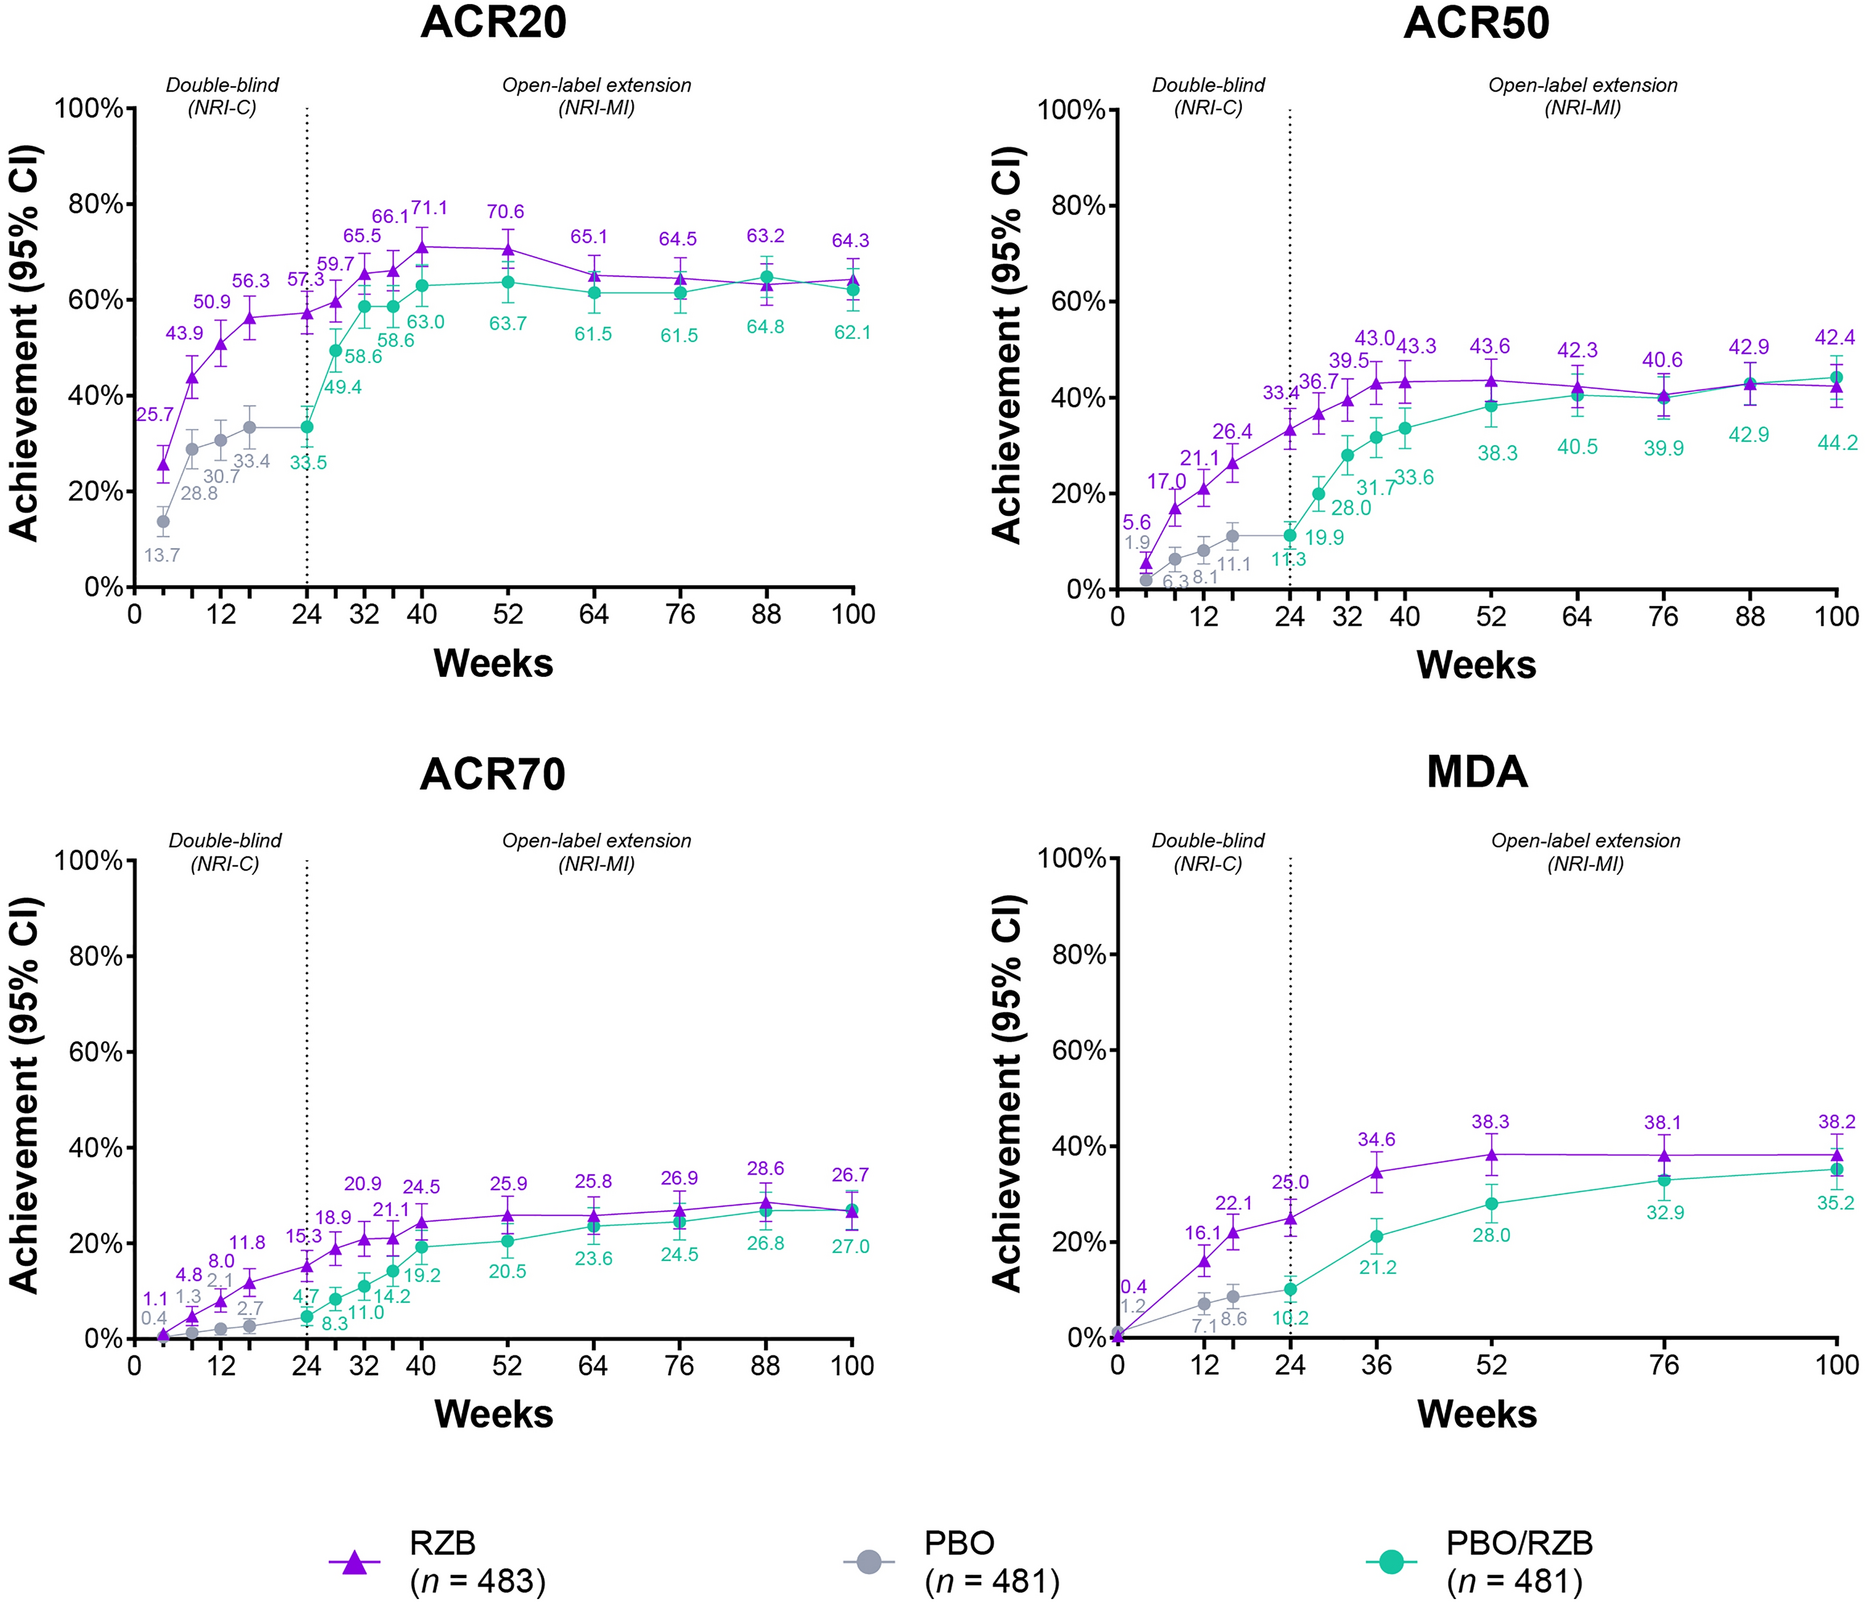
The exposure–response analyses for efficacy evaluated the following endpoints: proportions of patients with PsA achieving American College of Rheumatology (ACR) 20, ACR50, and ACR70 responses at week 24, PASI75 [for patients with ≥ 3% body surface area (BSA) psoriasis at baseline] at week 24, and minimal disease activity (MDA) evaluated at week 24, in the phase 3 studies (studies 4 and 5).
Since pharmacokinetic samples for phase 3 studies were collected predose in week 28 only, post-hoc individual pharmacokinetic parameter estimates were not used to simulate individual exposure predictions for patients enrolled in phase 3 studies because of the limited information available on an individual level. Given that risankizumab reaches steady state by week 16 for the approved clinical regimen [9], observed Ctrough at week 28 for patients who received risankizumab from the beginning of the phase 3 studies was assumed to be correlated with exposure levels at week 24, and therefore was used to assess relationships with efficacy endpoints evaluated at week 24. The correlation between observed concentrations at week 24 and week 28 for the phase 2 study was evaluated (correlation coefficient 0.961) to confirm the appropriateness of the assumption. The relationships between efficacy endpoints at week 24 and observed risankizumab Ctrough at week 28 for phase 3 studies were evaluated graphically using exposure-quartile plots. In these plots, patients who received placebo in period 1 (weeks 0–24) of either phase 3 study were binned together. Patients who received risankizumab were binned into quartiles according to their individual observed exposures, and vertical bars represented the percent of responders for a given efficacy endpoint per quartile for ACR20/50/70, PASI 90/100, and MDA responses.
For each of the efficacy endpoints at week 24, logistic regression models with treatment effect (yes/no) and exposure effect (observed Ctrough at week 28) were first evaluated and compared after accounting for stratification factors. An exposure and/or a treatment effect were included in the model only if proven to be statistically significant (α = 0.01). For patients who received placebo at the beginning of each study, concentrations were assumed to be zero for the exposure–response analyses. The logistic regression models were constructed as follows:
$$}\left( = 1} \right)}} = 1} \right)}}} \right) = \alpha + \beta_}}} C_}i}} + \beta_}}} }_ + \mathop \sum \limits_ \left( x_ } \right)$$
(1)
where P(Yi = 1) is the probability that the observation Y from subject i is equal to 1, with 1 indicating the event of interest occurred, α is the intercept parameter (reflecting placebo response), βCtrough is the slope for Ctrough at week 28, Ctrough,i is the observed risankizumab concentration in subject i. βTRT is the estimated magnitude of treatment effect, RZBi is an indicator of receiving risankizumab in subject i (yes = 1/no = 0). The βj are the coefficients for prespecified stratifying factors (and potential additional covariates) with respective values xj,i in subject i.
For the phase 3 studies, stratification factors used for randomizations and accounted for in the models included: number of prior biologic therapies (0 versus ≥ 1, study 5), number of csDMARDs (0 versus ≥ 1, studies 4 and 5), psoriasis surface area (PSA; ≥ 3% BSA versus < 3% BSA, studies 4 and 5) at baseline, presence of dactylitis (yes versus no, study 4), and presence of enthesitis (yes versus no, study 4) at baseline. Only efficacy endpoints exhibiting a statistically significant exposure (Ctrough) effect (p value < 0.01 for βCtrough) were evaluated further for identification of additional covariates. If a statistically significant exposure effect was observed for an endpoint, the potential effect of the demographic covariates of body weight, age, sex, and race was tested as well as the disease covariates of extent of disease at baseline (DAS28 and PASI), duration of PsA, with or without axial spondylitis at baseline and concomitant use of methotrexate.
Exposure–response analyses for safety evaluated the following safety variables graphically: any adverse event (AE), any serious AE (SAE), any infection, and any serious infection. Proportions of patients who experienced these safety events across period 1 (weeks 0–24) of phase 3 studies were determined among patients who received placebo and in each observed risankizumab exposure quartile at week 28.
Software
The population pharmacokinetic model was developed using nonlinear mixed-effects modeling based on NONMEM (Version 7.4.4) compiled with the GNU Fortran compiler (Version 7.5.5). R (Version 3.6.3) was used for the exposure–response analyses.

留言 (0)