
記住我


Acute myeloid leukaemia (AML) is a genetically and clinically heterogeneous disease characterized by clonal expansion, differentiation arrest, and evasion of apoptosis. Despite recent advances in chemotherapy, immunotherapy, and bone marrow transplantation, large numbers of AML patients still have a dismal prognosis, with a 5-years survival rate of only approximately 20% (Chen et al., 2019). The development of personalized biomarker-targeted therapies in AML has improved the efficacy of systemic therapies and prolonged patient survival to some extent. However, the lack of biomarkers hinders further improvements in accurate diagnosis and prediction of efficacy. Thus, it is extremely important to discover novel diagnostic and prognostic biomarkers for targeted therapy in AML.
In this research, various comprehensive bioinformatics and statistical methods were used to explore independent prognostic factors in AML. Differentially expressed gene (DEG) analysis, Kaplan-Meier analysis and Cox regression analysis helped us screen out Solute Carrier Family 25 Member 21 (SLC25A21) as an AML-specific prognostic marker. SLC25A21, also called ODC, is a metabolism-related gene located on chromosome 14q13.3, and it encodes a protein known as mitochondrial 2-oxodicarboxylate carrier (Fiermonte et al., 2001). The SLC25A21 protein not only facilitates the counterexchange of the oxodicarboxylates 2-oxoadipate and 2-oxoglutarate but also plays an essential role in the metabolism of several amino acids (Fiermonte et al., 1998; Kunji et al., 2020). Germline SLC25A21 deficiency in humans causes the depletion of mitochondrial DNA and spinal muscular atrophy-like disease (Fiermonte et al., 1998; Boczonadi et al., 2018). Metabolic reprogramming is a hallmark of cancer, and targeting metabolic factors is an emerging therapeutic modality (Chen et al., 2020a; Bosc et al., 2020; Forte et al., 2020; Pei et al., 2020). Interestingly, a recent study showed that SLC25A21 is a key tumor suppressor gene in bladder cancer (Wang et al., 2021). However, the potential role of SLC25A21 in AML and whether it could serve as a novel target for metabolic therapy remain completely unknown.
Hence, we used GO and KEGG analyses, GSEA, PPI network construction, immune infiltration and immune checkpoint correlations, and drug sensitivity analysis to explore the underlying molecular pathological mechanisms of SLC25A21 in AML. Based on the above results, we confirmed the prognostic value of SLC25A21 and identified it as a potential therapeutic target for AML.
Material and methodsData sourceWe included 804 samples from three independent cohorts in this study: the TCGA LAML cohort (RNA-seq, n = 132) (Cancer Genome Atlas Research et al., 2013), the GSE13159 microarray dataset (n = 573) (Haferlach et al., 2010) and the GSE12417 dataset (RNA-seq, n = 163) (Metzeler et al., 2008). The matrix of mRNA expression in normal samples (n = 70) was extracted from the GTEx project (Consortium, 2020). The RNA-seq and clinical information from the TCGA LAML and GTEx datasets were acquired using the UCSC XENA browser (https://xenabrowser.net/datapages/) (Vivian et al., 2017; Consortium, 2020; Goldman et al., 2020). The microarray dataset GSE13159 and RNA-seq dataset GSE12417 were downloaded from the GEO database (https://www.ncbi.nlm.nih.gov/geo/). To maintain the comparability of data from different databases, TPM values from RNA-Seq were determined for intrasample comparison after log2 transformation. In our study, specimens with no survival data were excluded.
Gene expression profilingTo analyse the gene expression profiles of AML, 705 bone samples from the GSE13159 and LAML datasets were used. The GSE13159 dataset was collected from the Microarray Innovations in Leukaemia Study. The DEGs were predicted using the limma package in R, with an adjusted p value <0.05 and |log2FC| ≥ 0.15 (Ritchie et al., 2015). A list of 14 common differentially expressed AML-specific genes was obtained from the above databases by using the Venn online tool (https://bioinfogp.cnb.csic.es/tools/venny/).
Identification of overall survival-related genesThe LAML cohort was used to investigate the potential prognostic significance of the selected genes in AML patients. OS-related genes with a p value <0.05 were selected using univariate Cox hazard regression analysis for further research. The external cohort GSE12417 (n = 163) was used to validate our results (Metzeler et al., 2008).
Human subjects and quantitative real-time PCRBone marrow samples were collected from 20 patients with AML diagnosis according to the 2016 WHO criteria. We also collected 10 bone marrow samples from healthy donors. The individuals in both cohorts were aged 18–70 years. All patients signed the informed consent form, and the study protocol was approved by the Ethics Committee of our hospital. The patient information collected is listed in Supplementary Table S3. Isolation of mononuclear cells was performed using standard Ficoll standard procedure. Total RNA was isolated with TRIzol reagent (Life Technologies) and then reverse transcribed to cDNA using the ImProm-II™ Reverse Transcription Kit (Promega, Madison, United States). For gene expression analysis, cDNA samples were mixed with SYBR reagent using a 7900 real-time PCR system (Applied Biosystems), and the data were normalized to GAPDH. The primer sequences are available in Supplementary Table S4.
Differentially expressed genes analysisBased on the median SLC25A21 expression level, patients in the LAML cohort were divided into two groups of low and high expression. A list of DEGs was obtained using DESeq2 with an adjusted p value < 0.05 and |log2FC| ≥ 1 (Love et al., 2014).
Gene ontology and kyoto encyclopedia of genes and genomes enrichment analysis of differentially expressed genesBy using the R package clusterProfiler, we carried out functional annotation analysis to investigate the underlying functions of DEGs in AML (Yu et al., 2012; Gene Ontology, 2021; Kanehisa et al., 2021). A Benjamin–Hochberg adjusted p value <0.05 was interpreted as statistically significant. Heatmap of clustered DEGs was generated using ClustVis software (Metsalu and Vilo, 2015).
Gene set enrichment analysisGSEA was conducted by using the clusterProfiler package in R and hallmark signatures (h.all.v7.2. symbols.gmt) from MsigDB (Subramanian et al., 2005; Yu et al., 2012). Results were considered significant when |NES | >1, normalized p value <0.0523.
Comprehensive protein‒protein interaction analysisAssociations between SLC25A21 and the expression of other genes were assessed using the LinkedOmics database (http://www.linkedomics.org/login.php). We derived the PPI network from the STRING database (https://string-db.org/) to estimate the interactional correlations of the DEGs (Szklarczyk et al., 2019). A confidence score >0.4 was considered significant. Hub proteins and key nodes in the constructed PPI network were identified using the Cytoscape plugin CytoHubba (Shannon et al., 2003). We investigated the association of SLC25A21 expression with hub genes through correlation heatmaps by using the R package ggplot2.
Immune infiltrate analysisBy using Single Sample GSEA (ssGSEA) in the R package gsva, Spearman correlation coefficients were computed between the expression level of SLC25A21 and ssGSEA-based immune cell infiltration levels (Bindea et al., 2013; Hanzelmann et al., 2013). The involved immune cells were of 22 immune cell subtypes, including B cells, monocytes, macrophages, neutrophils, NK cells, DC cells and all subtypes of T-cells. The relationships between SLC25A21 expression and the expression of immune checkpoint molecules, including PDCD1, CD274, CTLA-4, LAG-3, TIGIT, and HAVCR2, were identified through correlation heatmaps by using the R package ggplot2.
Drug sensitivity predictionThe half-maximal inhibitory concentration (IC50), calculated using the pRRophetic package in R (Geeleher et al., 2014; Ding et al., 2021), was used for drug sensitivity prediction.
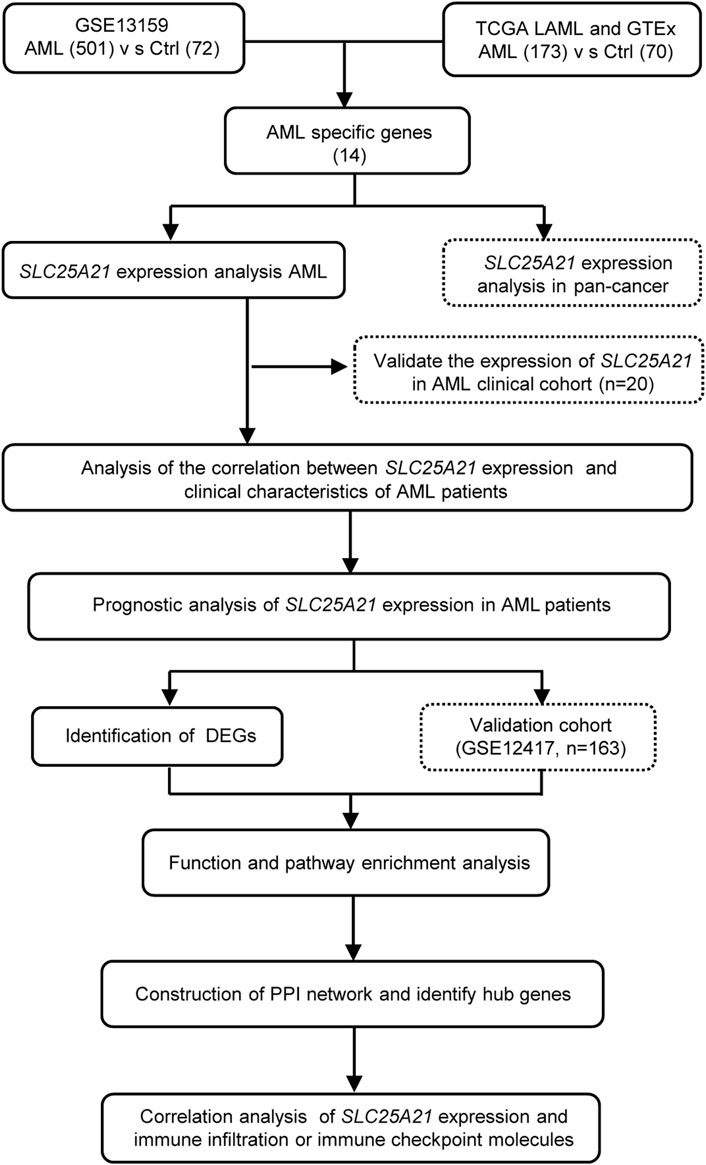
Survival and statistical analysisAll statistical analyses were performed with R, version 4.1.3 (https://www.r-project.org/). The Wilcoxon rank-sum test and Kruskal–Wallis test were used to detect differences among continuous variables. The correlation of clinical features with low and high SLC25A21 expression were analysed with Pearson’s correlation χ2 test. For survival analysis, Cox proportional hazards analysis was conducted by using “survival” and “survminer” in R. Variables significant in Cox univariate analysis were selected for multivariate analysis. The Kaplan-Meier method was used for univariate analyses of OS. Receiver operating characteristic (ROC) curves and AUC values were generated by pROC in R to assess the diagnostic efficacy of SLC25A21 for AML. All tests were two-sided, and a p value < 0.05 was considered to indicate statistical significance. A flow chart of the analyses is presented in Figure 1.
FIGURE 1
FIGURE 1. Flow chart of the study.
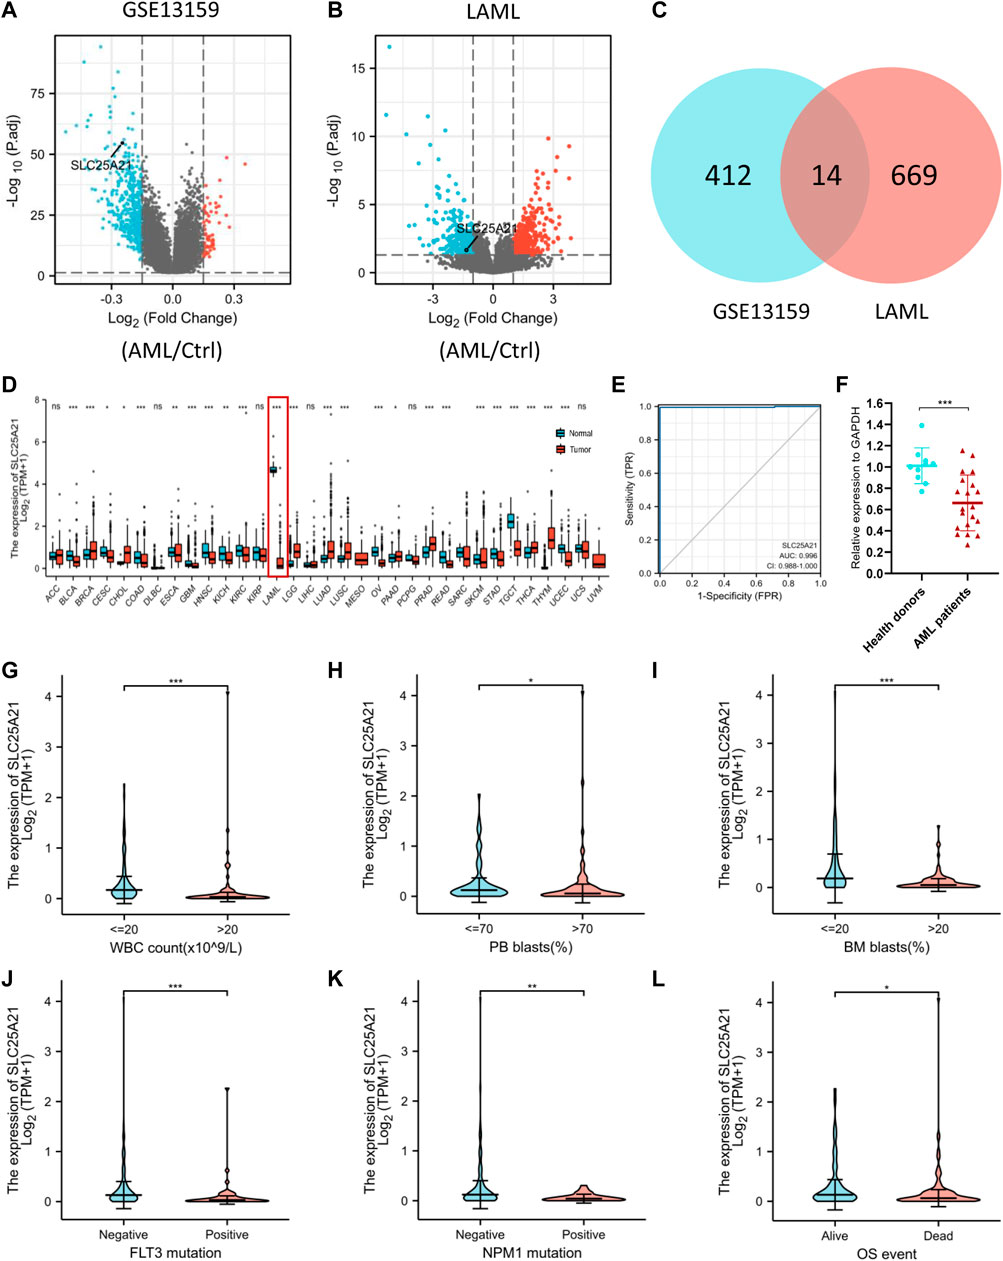
ResultsAcute myeloid leukaemia-specific genes identified with screening datasetsWe analysed the TCGA LAML database and the GEO dataset GSE13159 to understand the potential molecular changes in AML. For GSE13159, gene expression analysis was performed on bone marrow samples from 501 AML to 72 control samples (nonleukaemia and healthy donors). We identified 61 upregulated and 365 downregulated DEGs in the AML group (|log2FC| ≥ 0.15, adjusted p value < 0.05) by using the limma package in R. The volcano plots are shown in Figure 2A. By screening the TCGA LAML datasets (|log2FC| ≥ 1, adjusted p value < 0.05) with DESeq2, a total of 683 differentially expressed genes were obtained, which are shown in Figure 2B. Venn diagram software was used to obtain a common DEG list. A list of 14 intersectional genes was extracted, of which 11 were upregulated and 3 were downregulated in GSE13159 and TCGA LAML (Figure 2C), including IL1R2, MMP8, FGF13, SLC25A21, etc. In pan-cancer analysis, we determined the expression profiles of these genes in normal and malignant samples. Remarkably, SLC25A21 was downregulated in multiple malignancies, especially in AML (Figure 2D). Furthermore, we performed receiver operating characteristic (ROC) curve analyses, and the area under the curve (AUC) was used to evaluate the discriminatory capacity. The calculated AUC value was 0.996 (95% confidence interval, CI = 0.988–1.0, Figure 2E), which means that SLC25A21 has excellent discrimination power to distinguish AML patients from normal controls. Finally, we validated the expression of SLC25A21 in AML patient bone marrow samples collected in our centre. We compared the mRNA expression level of SLC25A21 between AML patients (n = 20) and healthy donors (n = 10) by qPCR. SLC25A21 was significantly downregulated in AML samples, with a p value of 0.0007 (Figure 2F). Therefore, SLC25A21 could be a specific factor to distinguish AML from normal samples.
FIGURE 2
FIGURE 2. Identifying AML-specific genes and the association of SLC25A21 expression with clinical characteristics. (A) Volcano plot displaying DEGs between AML and control bone marrow samples in the GSE13159 dataset. Each point represents the average value of one transcript. (B) Volcano plot of DEGs between AML and normal samples in the TCGA-LAML and GTEx datasets. (C) Venn diagram of differential gene expression. Selected genes for further analysis based on the intersections of DEGs. (D) The level of SLC25A21 expression in different tumor from TCGA and GTEx database. (E) Receiver operating characteristic (ROC) analysis of SLC25A21 in AML. The analysis was performed with the TCGA-LAML and GTEx dataset. (F) Differential expression of SLC25A21 between AML patients and healthy donors by qPCR analyses. The results were expressed as the fold change of AML patients relative to healthy donors. Clinical characteristics included (G) WBC count, (H) PB blasts abundance, (I) BM blasts abundance, (J) FLT3 mutation, (K) NPM1 mutation, (L) OS evens. Data are presented as the mean ± SD, and represent triplicate wells from one of two independent experiments. *p < 0.05, **p < 0.01, ***p < 0.001. Analysis between two groups of unpaired samples: Wilcoxon rank-sum test, analysis among multiple groups: Kruskal‒Wallis test (ns p ≥ 0.05, *p < 0.05, **p < 0.01, ***p < 0.001).
Low levels of SLC25A21 are associated with adverse clinical features in acute myeloid leukaemiaTo investigate the clinical significance of SLC25A21, we analysed the TCGA LAML cohort, which includes 132 AML patients with clinical information. As shown in Figures 2F–K, low SLC25A21 expression was associated with higher WBC counts (p value <0.001, Figure 2G), higher PB blast abundance (p value <0.05, Figure 2H), higher BM blast abundance (p value < 0.001, Figure 2I), FLT3 mutation (p value < 0.001, Figure 2J), NPM1 mutation (p value < 0.01, Figure 2K), and death evens (p value < 0.001, Figure 2L); however, no association was found with cytogenetic risk or French–American–British (FAB) classifications (Supplementary Figures 1A–B). In addition, similar trends were observed when patients were grouped by low or high SLC25A21 expression; more details are shown in Table 1.
TABLE 1
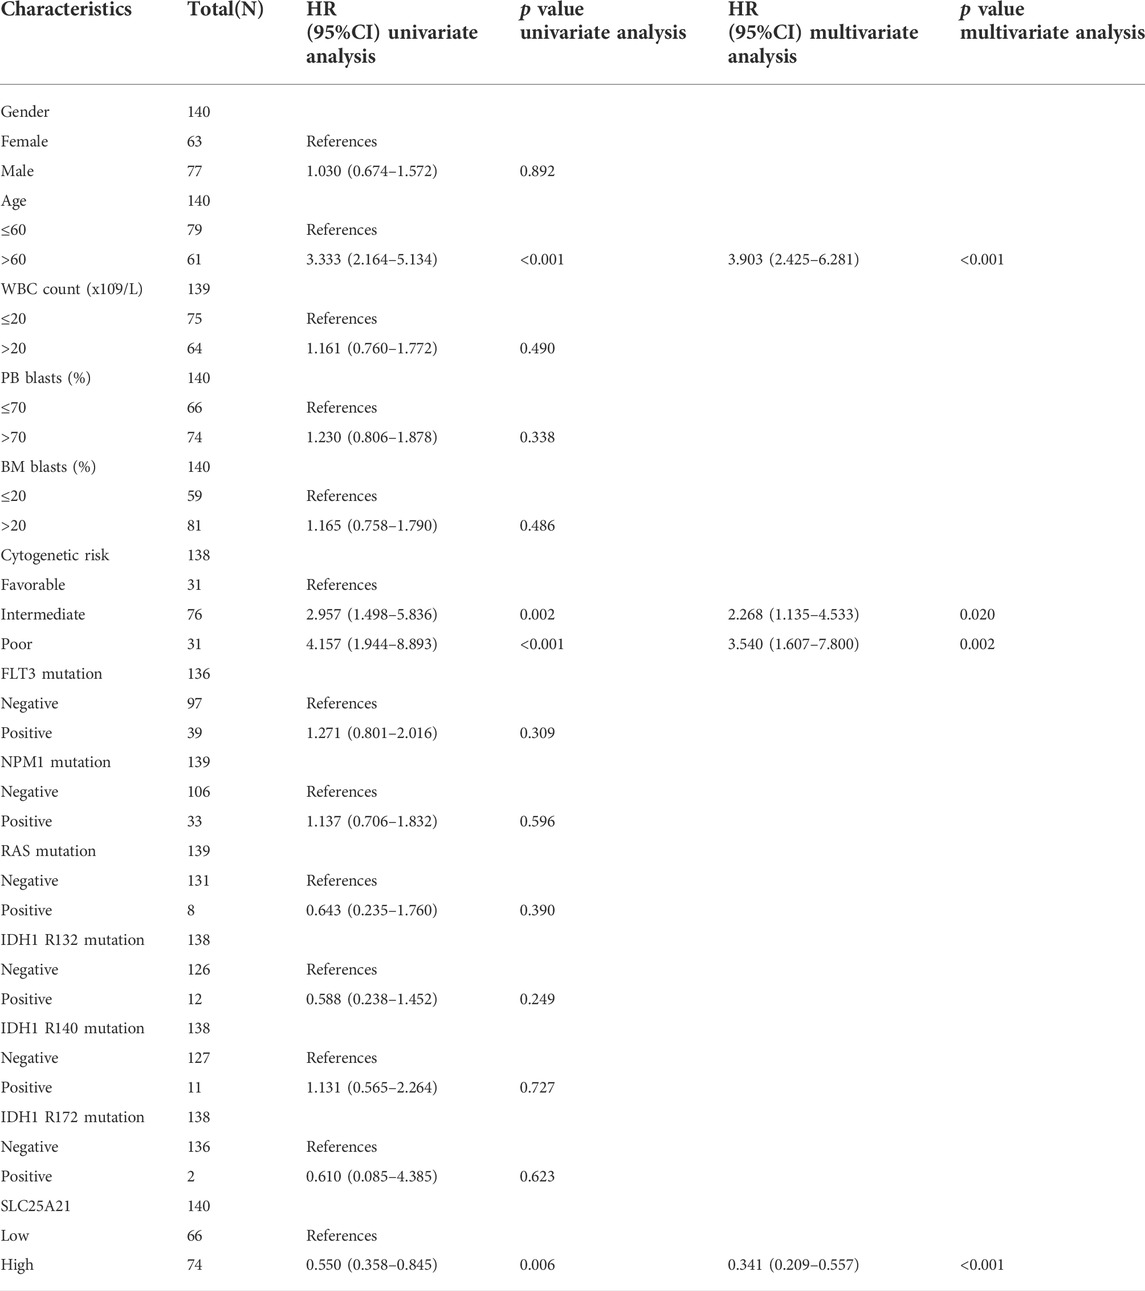
TABLE 1. Clinical characteristics of AML patients with differential SLC25A21 expression levels.
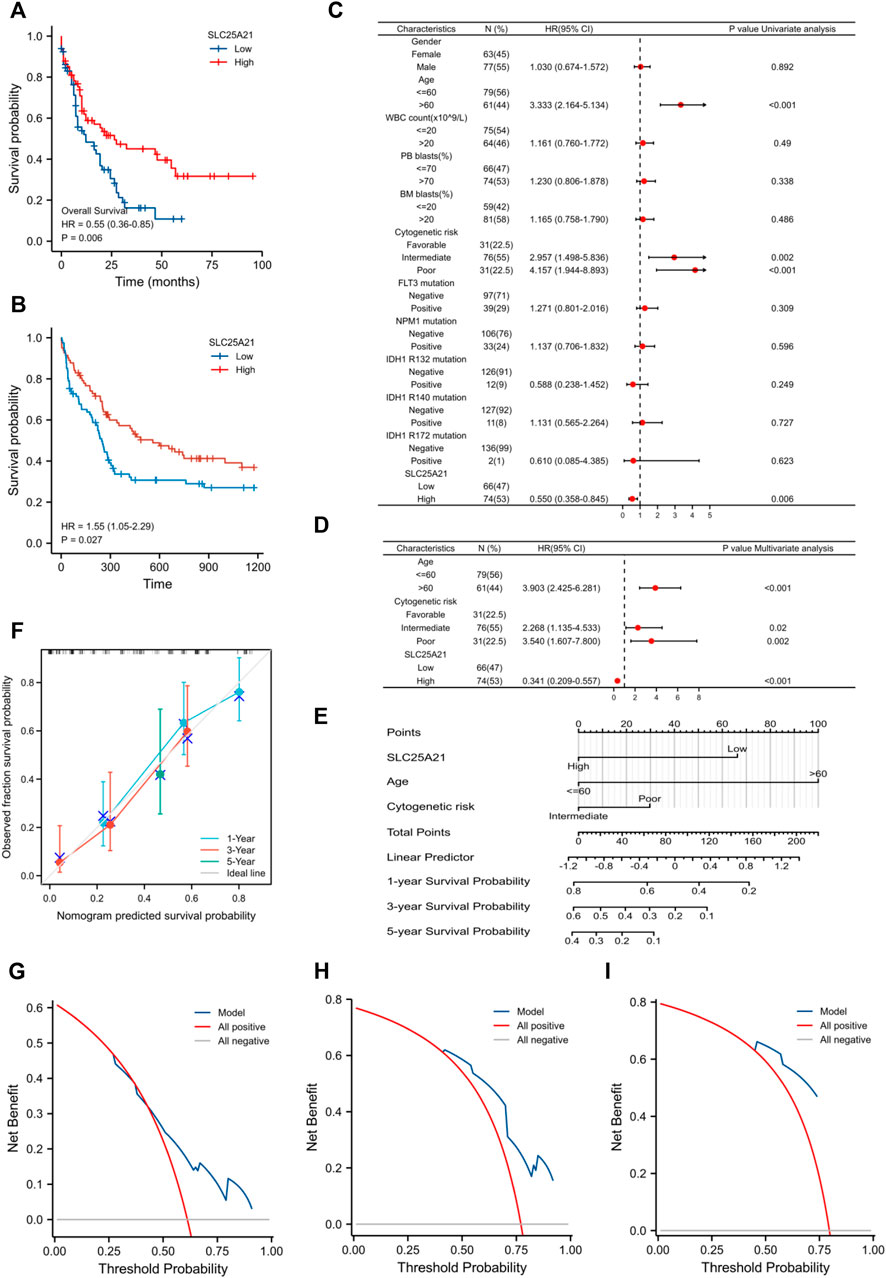
Low expression of SLC25A21 predicts unfavourable prognosis in patients with acute myeloid leukaemiaWe further investigated the prognostic value of SLC25A21 in AML. First, patients in the low SLC25A21 expression group had shorter OS than those in the high SLC25A21 expression group (p value = 0.006, Figure 3A), which indicated that a low SLC25A21 expression level was associated with an unfavourable prognosis in patients with AML. Furthermore, we validated our results in an independent external validation cohort GSE12417 (p value = 0.027, Figure 3B).
FIGURE 3
FIGURE 3. The prognostic value of SLC25A21 in AML. (A) Kaplan-Meier curve analysis of overall survival (OS) between the high- and low- SLC25A21 expression groups in the TCGA-LAML dataset. (B) OS analysis of SLC25A21 in the independent validation cohort GSE12417. (C) Univariate analyses of OS shown as a by forest plot. (D) Multivariate analyses of OS shown as a forest plot. (E) A nomogram integrating SLC25A21 and other prognostic factors for AML (mut: mutation, wt, wild type; Int, Intermediate; Fav, Favourable). (F) The calibration curve of the nomogram. The DCA curves of the nomogram at 1 year (G), 3 years (H), and 5 years (I).
In addition, univariate and multivariate logistic regression analyses were performed to determine whether low expression of SLC25A21 was an independent prognostic factor for AML. Univariate Cox regression analysis showed that low levels of SLC25A21 expression were associated with poor OS (hazard ratio, [HR]: 0.55; 95% confidence interval [CI]: 0.358–0.845; p value = 0.006). Meanwhile, increasing age and unfavourable cytogenetics were also risk factors associated with poor outcomes. Then, all variables significant in univariate Cox regression analysis (p value <0.05) were included in multivariate Cox regression analysis. Subsequently, age, unfavourable cytogenetics and low levels of SLC25A21 expression (HR: 1.733; 95% CI: 1.079–2.781; p value = 0.023) were identified as independent prognostic factors for OS. The forest plots present the Cox regression results in Figures 3C,D (more details are provided in Supplementary Table S1).
Moreover, a nomogram including the prediction model was established based on multivariable logistic regression analysis. The established nomogram was well calibrated and had good discriminative power, with a concordance index (C-index) of 0.735 for OS prediction (Figure 3E). Furthermore, we utilized calibration curves and decision curve analysis (DCA) to report the clinical net benefit of our model. The calibration curve at 1, 3, or 5 years still showed high consistency between the predicted survival probability and actual OS proportions (Figure 3F). In addition, the decision curve analysis for the individualized prediction nomogram is presented in Figures 3G–I. In summary, the nomogram model we established had good predictive accuracy for AML patient survival.
Biological function enrichment of the SLC25A21 gene in acute myeloid leukaemiaNext, we aimed to further investigate the underlying mechanisms and functional pathways of SLC25A21 in AML. We identified DEGs between the low- and high- SLC25A21 expression groups. The final list of DEGs included 1,270 genes, with 128 genes upregulated and 1,142 genes downregulated (|log2FC| ≥ 1, adjusted p value <0.05). The heatmap and the volcano map are shown in Figures 4A,B.
FIGURE 4
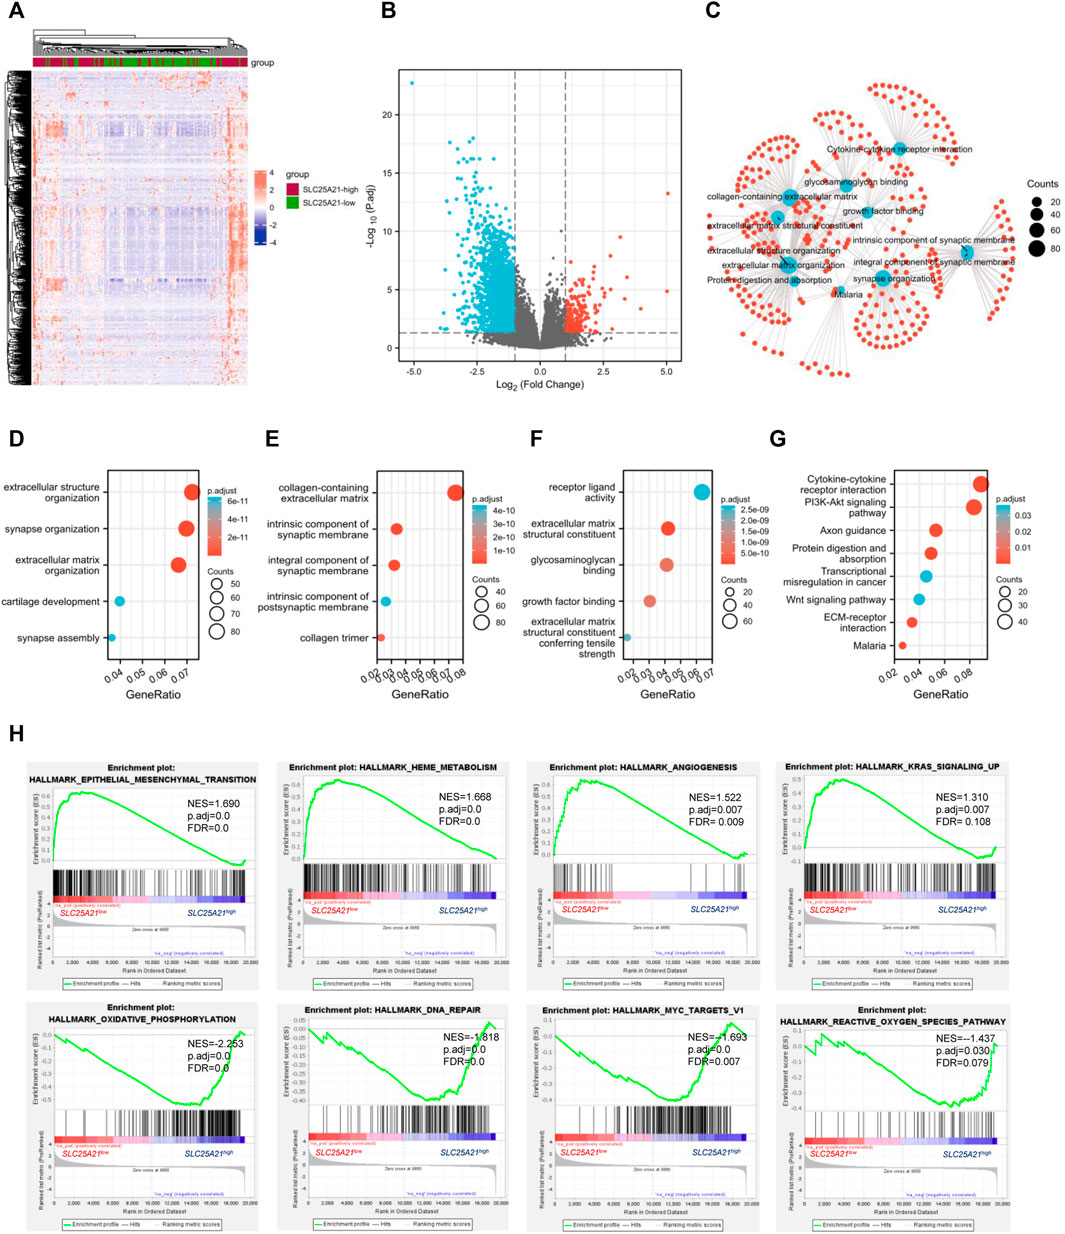
FIGURE 4. DEGs and functional enrichment of the high- and low- SLC25A21 expression groups in AML. (A) Heatmap of SLC25A21-related DEGs. (B) Volcano plot of SLC25A21-related DEGs. (B,C) Interactive analyses of GO and KEGG, including biological processes (D), cellular components (E), and molecular functions (F), and KEGG pathways of SLC25A21-related DEGs. (G) Each red plot in the graph represents a specific gene included in the gene-set. Each blue plot represents the enriched gene-sets. The size of the blue plot represents the number of gene read counts in the gene-sets. (H) GSEA of SLC25A21-related DEGs.
To elucidate the potential biological function of SLC25A21 in AML, we performed enrichment analyses. The top 15 GO enrichment items (Figures 4D–F) and top 5 KEGG pathways are shown in Figure 4G. The main enriched GO terms of the DEGs were extracellular structure organization, synapse organization, extracellular matrix organization, collagen-containing extracellular matrix, integral component of synaptic membrane, receptor ligand activity, extracellular matrix structural constituent, glycosaminoglycan binding, growth factor binding, etc.
We found that the enriched pathways included cytokine‒cytokine receptor interaction, PI3K-Akt signalling pathway, focal adhesion, proteoglycans in cancer, transcriptional misregulation in cancer, Wnt signalling pathway, and TGF-beta signalling pathway (Supplementary Table S2). Furthermore, interaction analysis was carried out with the results of GO and KEGG analysis to explore interrelationships. The number of enriched genes was ranked from most to least common: collagen-containing extracellular matrix, extracellular structure organization, extracellular matrix organization, cytokine‒cytokine receptor interaction, extracellular matrix structural constituent, growth factor binding, protein digestion and absorption, malaria (Figure 4C).
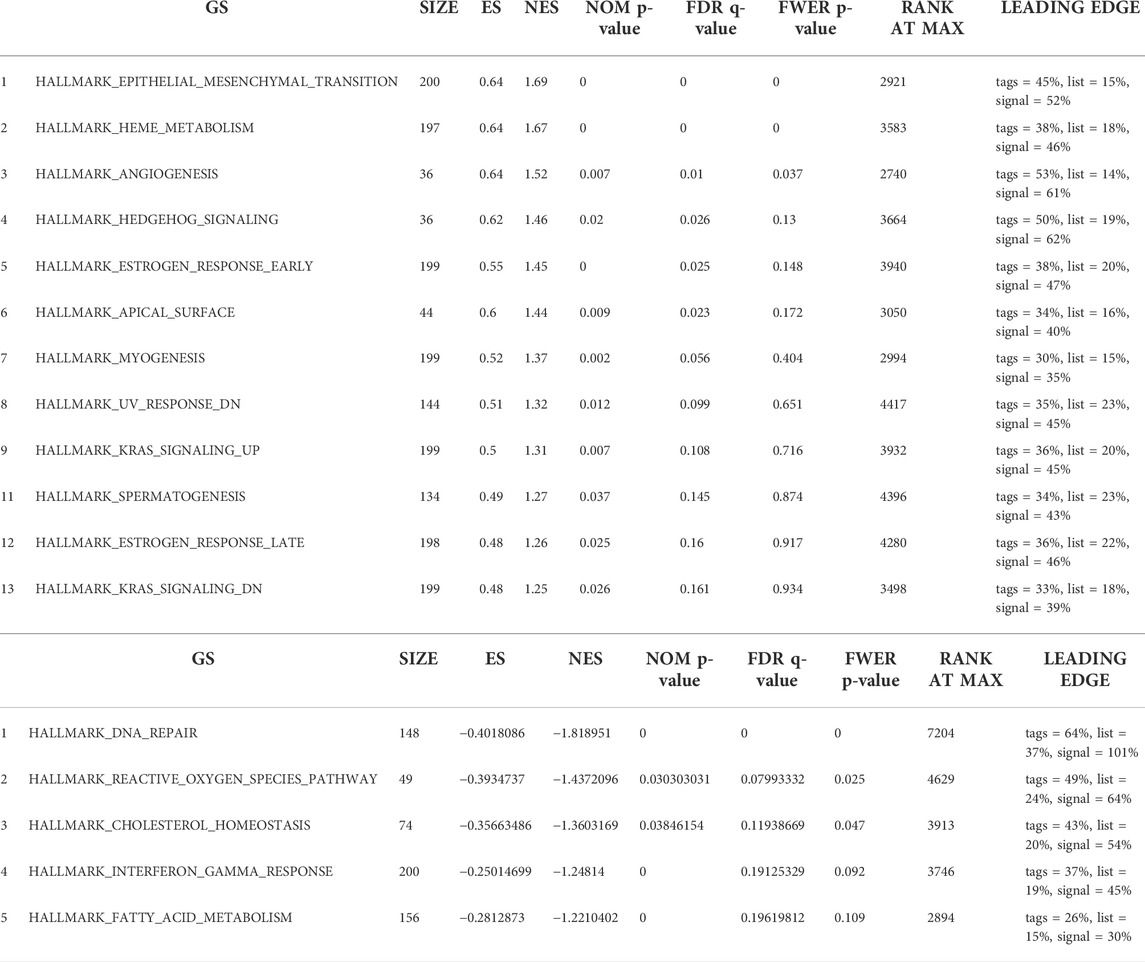
Finally, we utilized GSEA to assess key regulatory pathways for SLC25A21 expression. We found 17 significant pathways associated with SLC25A21 (Table 2), of which the major affected pathways included epithelial-mesenchymal transition, heme metabolism, angiogenesis, KRAS signalling, oxidative phosphorylation, DNA repair, MYC targets and reactive oxygen species (Figure 4H).
TABLE 2
TABLE 2. Seventeen items from gene set enrichment analysis. (A) Gene sets enriched in phenotype SLC25A21 low. (B) Gene sets enriched in phenotypeSLC25A21 high.
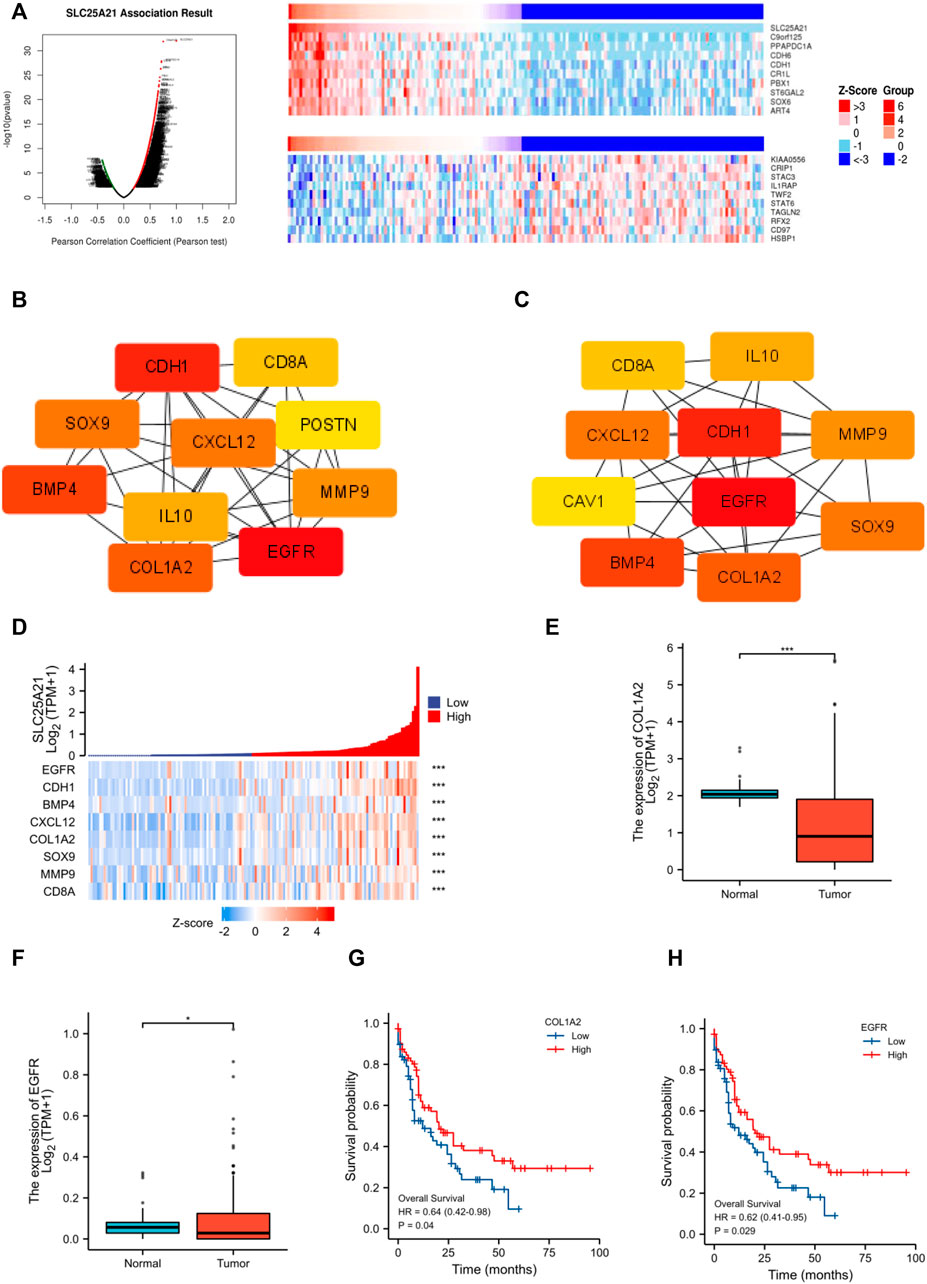
Identification of hub genes associated with SLC25A21 expressionNext, we constructed and analysed the PPI network and coexpression modules. As indicated in Figure 5A, most genes in AML were positively correlated with the expression of SLC25A21. A DEG-related PPI network was constructed to determine hub genes. The top 10 hub genes were identified by the MNC and Degree methods by using the cytoHubba plug-in of Cytoscape (Figures 5B,C). Furthermore, we observed eight shared hub genes (EGFR, CDH1, CXCL12, CD8A, MMP9, SOX9, BMP4, and COL1A2) between the above two gene lists. In addition, we detected the associations between SLC25A21 and hub genes. The results showed that SLC25A21 had significant correlations with EGFR (p value <0.001, correlation coefficient: 0.569), CDH1 (p value <0.001, correlation coefficient: 0.709), CXCL12 (p value <0.001, correlation coefficient: 0.590), CD8A (p value <0.001, correlation coefficient: 0.441), MMP9 (p value <0.001, correlation coefficient: 0.295), SOX9 (p value <0.001, correlation coefficient: 0.438), BMP4 (p value <0.001, correlation coefficient: 0.383), and COL1A2 (p value <0.001, correlation coefficient: 0.538) (Figure 5D). Finally, we examined the relationship between the levels of hub genes and prognosis and found that only EGFR and COL1A2 were positively correlated with SLC25A21 and linked to poor clinical outcomes in patients with AML (Figures 5E–H).
FIGURE 5
FIGURE 5. PPI network construction and clinical significance of hub genes. (A) Coexpression analysis of SLC25A21 in the TCGA-LAML dataset. The top 10 positively/negatively correlated genes are displayed. (B–C) The top 15 hub genes were selected on the basis of (B) MNC and (C) degree. (D) The association of SLC25A21 with eight hub genes (EGFR, CDH1, BMP4, CXCL12, COL1A2, SOX9, MMP9, and CD8A). (E) Expression levels of COL1A2 in AML patients (n = 132) and normal participants (n = 70). (F) Expression levels of EGFR in AML patients (n = 132) and normal participants (n = 70). (G) The difference in OS between patients with high and low COL1A2 expression levels shown by Kaplan-Meier curves. (H) The difference in OS between patients with high and low EGFR expression levels shown by Kaplan-Meier curves. (*, p < 0.05; **, p < 0.01; ***, p < 0.001).
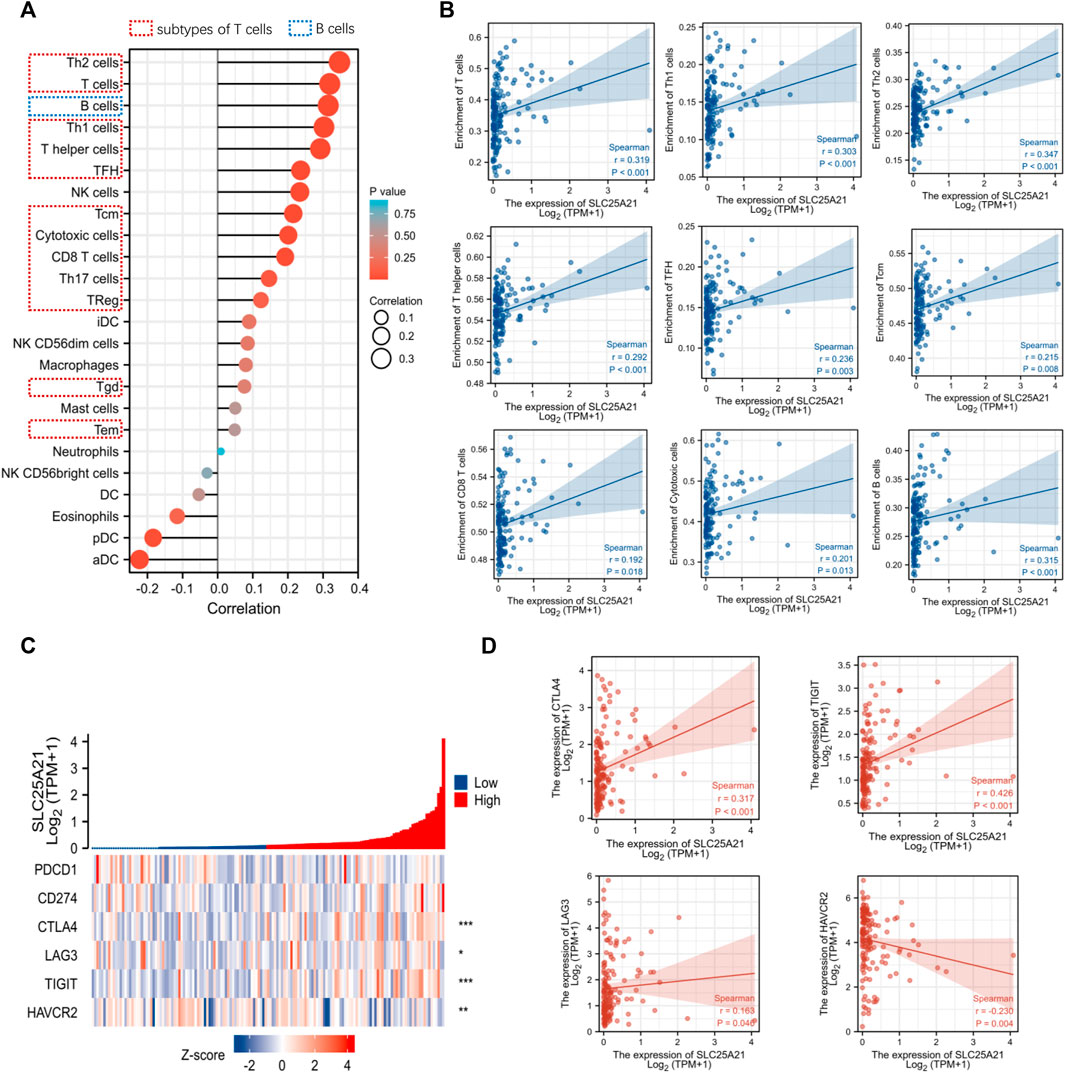
Correlation analysis of SLC25A21 and immune cells or immune checkpoint moleculesTumor infiltrating lymphocytes affect the survival of patients with various cancers. Therefore, 24 kinds of infiltrating immune cells were evaluated to describe the association between the levels of SLC25A21 expression and immune infiltration in AML. The results showed that the expression level of SLC25A21 had an obvious positive correlation with the numbers of infiltrating B cells, T-cells, Th1 cells, Th2 cells, T helper cells, Tfh cells, CD8 T-cells, cytotoxic cells and Tcm cells (Figure 6A). The details of the quantitative analysis with Spearman’s correlation coefficient are shown in Figure 6B.
FIGURE 6
FIGURE 6. Correlation analysis between the level of SLC25A21 expression and immune cell infiltration or immune checkpoint molecules. (A) The relative contents of 24 kinds of immune cells in AML. (B) Spearman’s correlations were used to quantify the correlation of SLC25A21 expression with the number of infiltrating level B cells and subtypes of T-cells. (C) The association of SLC25A21 with five immune checkpoint molecules (PDCD1, CD274, CTLA-4, LAG-3, TIGIT, and HAVCR2). (D) Spearman’s correlation was used to quantify the correlation of SLC25A21 expression with immune checkpoint molecules (r is Spearman’s correlation coefficient).
Furthermore, we clarified the relationship between SLC25A21 and immune checkpoint (PDCD1, CD274, CTLA4, LAG-3, TIGIT, and HAVCR2) expression. In our study, SLC25A21 was significantly correlated with CTLA4, LAG3, TIGIT, CD274, and TIGIT. Details of the correlation analysis are shown in Figures 6C,D.
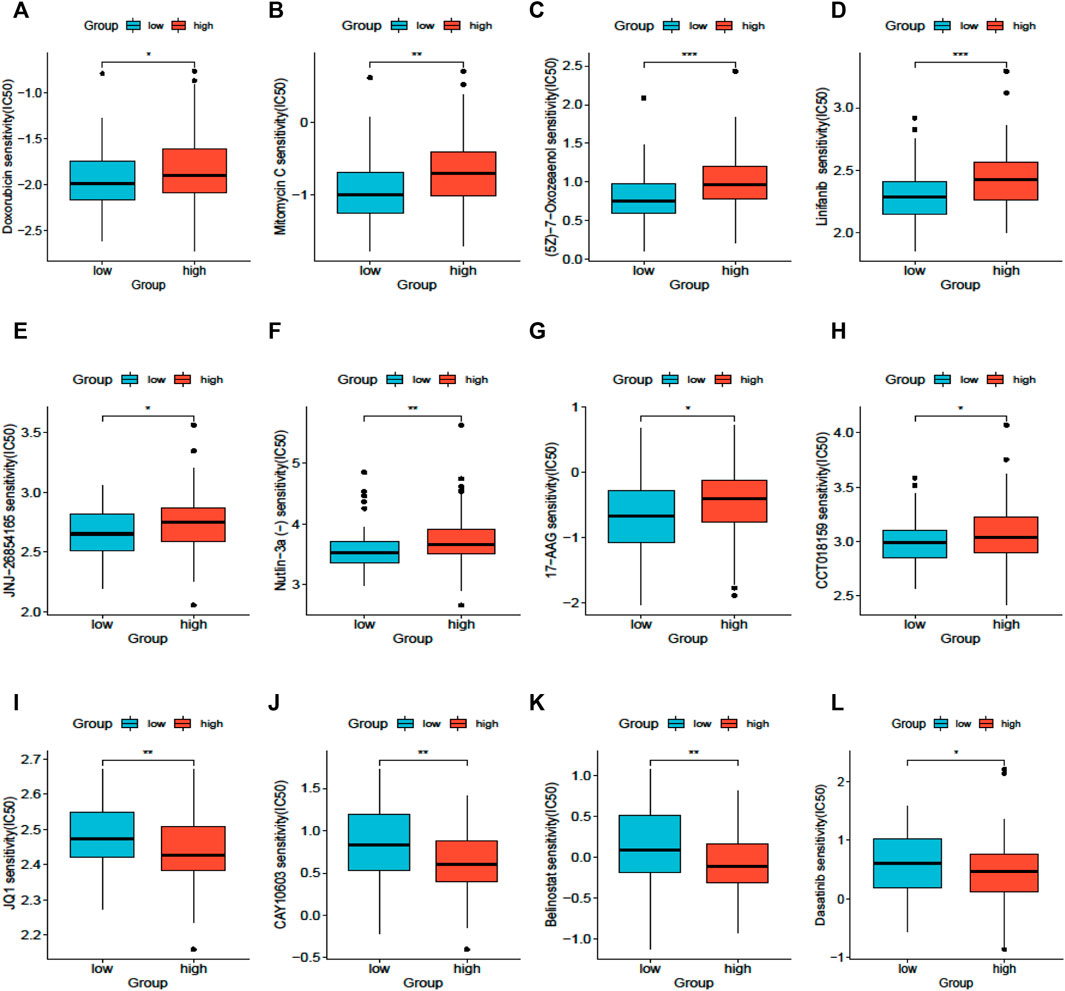
Drug sensitivity analysisThe results of drug sensitivity analysis for the high- and low-SLC25A21 groups showed that the SLC25A21 low expression group may be more sensitive to cell cycle inhibitors (doxorubicin and mitomycin C), vascular endothelial growth factor receptor (VEGFR) tyrosine kinase inhibitors (linifanib and 7-oxozeaenol), p53 activators (JNJ-26854165 and Nutlin-3a), and heat shock protein 90 (HsP90) inhibitors (CCT018159 and 17-AAG) but resistant to histone deacetylase (HDAC) inhibitors (JQ1, CAY10603, and belinostat) and tyrosine kinase inhibitors (dasatinib). These results indicated that SLC25A21 has a significant correlation with chemotherapy and targeted therapy regimens for AML (Figures 7A–L).
FIGURE 7
FIGURE 7. Drug sensitivity analysis based on SLC25A21. (A), Doxorubicin. (B), Mitomycin (C), 7-Oxozeaenol. (D), Linifanib. (E), JNJ-26854,165. (F), Niutlin-3a. (G), 17-AAG. (H), CCT018159. (I), JQ1. (J), CAY10603. (K), Belinostat. (L), Dasatinib.
DiscussionAML is a highly heterogeneous disease with various cytogenetic and genetic alterations. Genetic abnormalities are not only the pathogenic basis of AML, but they have important treatment and prognostic implications. In this study, we screened transcriptome data for AML in public databases to discover novel molecular biomarkers with a potential impact on prognosis and/or therapeutic response. We identified DEGs between AML patients and healthy donors in two independent cohorts. Therefore, a list of 14 AML-specific genes was obtained, including IL1R2, MMP8, FGF13, SLC25A21, etc.
(Le Sommer et al., 2018; Nobrega-Pereira et al., 2018) SLC25A21 SLC25A21 is a 2-oxoglutarate transporter embedded in the mitochondrial inner membrane and, in some cases, organelle membranes. The expression of human SLC25A21 has a wide distribution with very little variation between tissues. A recent study revealed that SLC25A21 suppresses cell growth and plays a pathogenic role on bladder cancer (Wang et al., 2021). Recent studies have shown that metabolic molecules are dysregulated in AML cells and play key roles in leukaemogenesis, contributing to chemoresistance and disease relapse (Le Sommer et al., 2018; Nobrega-Pereira et al., 2018). Targeting cell metabolism is now considered a viable therapeutic strategy for AML. Therefore, we focused on the metabolism-related gene SLC25A21 for further studies.
Given the above, we first explored the association of SLC25A21 gene expression levels with main clinical features in TCGA-LAML cohorts of AML patients. SLC25A21 We found that SLC25A21 was significantly downregulated in AML patients. As expected, a low level of SLC25A21 was associated with higher WBC counts, higher BM and PB blast abundance and poor prognosis. Thus, we speculated that abnormally low expression of SLC25A21 plays an unfavourable role in promoting AML cell proliferation and survival while preventing leukaemic cell differentiation.
Hence, we explored the possible molecular mechanism underlying this association by using a bioinformatics approach. The enriched GO terms and KEGG pathways were mainly involved in growth factor binding, collagen-containing extracellular matrix, extracellular structure organization, the PI3K-Akt signalling pathway and the Wnt signalling pathway. Concurrently, GSEA showed enrichment of epithelial-to-mesenchymal transition, the KRAS signalling pathway, oxidative phosphorylation, DNA repair and the reactive oxygen species (ROS) pathway.
Mitochondria are the primary intracellular source of ROS and play important roles in aerobic metabolism and oxidative phosphorylation. Thus, dysregulation of mitochondrial metabolism is closely related to the development and progression of haematopoietic malignancies (Basak and Banerjee, 2015; Porporato et al., 2018). As a carrier embedded in mitochondria, overexpression of SCL25A21 resulted in efflux of α-KG from mitochondria, leading to upregulation of ROS accumulation, which in turn induced mitochondrial apoptosis (Wang et al., 2021). Moreover, increased ROS levels drive a cycle of genomic instability. Leading to DNA double-strand breaks (DSBs) and altered DNA repair. The accumulation of intracellular ROS can promote tumour proliferation, but excessive accumulation of ROS can lead to cell apoptosis (Trotta et al., 2017; Aggarwal et al., 2019). Recent studies have revealed that the majority of functionally defined leukaemia stem cells (LSCs) are functionally characterized by relatively low levels of ROS. Meanwhile, several EMT-related genes conferring properties of “stemness” were strongly associated with shorter OS in AML patients (Stavropoulou et al., 2016; Carmichael et al., 2020; Almotiri et al., 2021). More importantly, the PI3K and KRAS signalling pathways play important roles in the proliferation and differentiation of haematopoietic cells (Crespo and Leon, 2000; Martelli et al., 2009; Nepstad et al., 2018). Thus, we speculated that the pathological mechanism of SLC25A21 may be related to these signalling pathways.
Furthermore, through a series of rigorous screens, two hub genes (EGFR and COL1A2) that could accurately predict the prognosis of AML were found. It has been reported that dysregulation of EGFR can lead to the development of malignancy (Cheng et al., 2011; Singh et al., 2016). EGFR repairs the DNA of HSCs by activating DNA-dependent protein kinase catalytic subunit (DNA-PKcs), leading to the regeneration of normal haematopoietic cells. Experimental studies have shown that deletion of EGFR in progenitor cells results in reduced DNA-PKcs activity, thus reducing the ability of the cells to regenerate normal HSCs (Fang et al., 2020). In AML, we speculate that EGFR may play the same role to inhibit normal haematopoiesis, resulting in a shorter survival time for patients with low EGFR expression. COL1A2 has also been implicated in gastric cancer, colorectal cancer, prostate cancer, pancreatic cancer (Yu et al., 2018; Wu et al., 2019; Nie et al., 2020; Liu et al., 2022), and so on. Moreover, COL1A2 has been identified as a hub gene in FLT3-mutated AML (Chen et al., 2020b). Although SLC25A21, EGFR, and COL1A2 are linked to tumour-associated signalling pathways, the precise mechanisms of this synergy remain unclear. Further in-depth studies are needed to address this issue in more detail.
Additionally, metabolic molecular abnormalities may facilitate AML cell escape and immune detection and severely reduce the efficacy of immunotherapy (Mougiakakos, 2019). Several studies have shown that the level of immune infiltration and immune evasion mechanisms of AML cells determine their immune evasion ability (Rosenthal et al., 2019). Therefore, we investigated the relationship between SLC25A21 expression and immune infiltration levels in AML patients and found that with downregulation of SLC25A21, the infiltration levels of various T-cells and B cells were greatly decreased. Next, we also showed that SLC25A21 expression had a positive correlation with some immune checkpoint genes (CTLA-4, LAG3, TIGIT, and HAVCR2), which serve as activation markers of T-cells and affect antitumor immunity. We speculate that this may be because the number of infiltrating immune cells is significantly reduced, resulting in decreased expression of molecular markers of T-cell activation. These results suggest that SLC25A21 may lead to immune escape in AML. This observation may provide a framework to guide further investigation of SLC25A21 in clinical and basic science research.
Last, the ultimate objective of our research is to provide clinicians with guidelines to choose the appropriate therapeutic regimens for each AML patient. With the development of next-generation sequencing technology, several genetic aberrations have been found to contribute to drug resistance in AML (Gollner et al., 2017; Hou et al., 2017; Nechiporuk et al., 2019). In this study, we analysed the correlation between SLC25A21 and drug resistance in AML. Patients with low SLC25A21 expression levels were sensitive to doxorubicin, mitomycin, lapatinib, midostaurin, sorafenib, linifanib, Nutlin-3a, 17-AAG, 5-fluorouracil, 7-oxozeaenol, JNJ-26854165, CCT018159, bleomycin, and FH535 but resistant to JQ1, CUDC-101, dasatinib, and GNF-2. These results indicate that downregulation of SLC25A21 may promote sensitivity to doxorubicin, the cornerstone regimen for AML. These results suggest that while SLC25A21 affects prognosis in AML, patients with low expression of SLC25A21 may still benefit from traditional chemotherapy regimens.
However, our study has several limitations. First, we explored the mutational frequency of SLC25A21 in 6 independent AML studies (n = 2,177) and found a frequency of approximately 0.1%–0.2% (Supplementary Figure S2). In addition, we observed enrichment of transcriptional regulation pathways in GO analysis. Therefore, the upstream transcriptional regulatory mechanism of SLC25A21 remains to be uncovered. Second, we evaluated the diagnostic value and drug sensitivity of SLC25A21 by using public resources. However, we have not yet tested some new clinically emerging targeted drugs, such as venetoclax, due to the limitations of the training database. Last, all associations between SCL25A21 and AML-associated immune molecules lack functional validation and detection of the potential cellular and molecular mechanisms. Future studies will build on these points with a view toward providing new options for precision medicine approaches and improving the treatment of AML patients.
ConclusionTaken together, our preliminary findings showed that low expression levels of the metabolism-related gene SLC25A21 had an unfavourable effect on the overall survival of AML patients and may be correlated with immune escape. A low level of SLC25A21 could be an independent predictor of poor prognostic for AML patients. This discovery could promote the development of novel targeted drugs and provide therapeutic options for personalized therapy.
Data availability statementThe datasets presented in this study can be found in the GEO,TCGA and GETx repositories: https://www.ncbi.nlm.nih.gov/geo/; https://portal.gdc.cancer.gov/projects/TCGA-LAML; https://xenabrowser.net/datapages/. The accession numbers can be found in the article.
Ethics statementThe studies involving human participants were reviewed and approved by the ethics committee of Institute of Hematology and Blood Diseases Hospital, Chinese Academy of Medical Sciences by (KT2020016-EC-2). The patients/participants provided their written informed consent to participate in this study.
Written informed consent was obtained from the individual(s) for the publication of any potentially identifiable images or data included in this article.
Author contributionsWW, QL, YZ, and JS conceived the study. WW and QL collected and analyzed the data, wrote the paper. WW, QL, JZ, HP, ZG, and LF contributed to the data collection and analysis. YZ and JS designed the research and give an approval of the final manuscript.
Conflict of interestThe authors declare that the research was conducted in the absence of any commercial or financial relationships that could be construed as a potential conflict of interest.
Publisher’s noteAll claims expressed in this article are solely those of the authors and do not necessarily represent those of their affiliated organizations, or those of the publisher, the editors and the reviewers. Any product that may be evaluated in this article, or claim that may be made by its manufacturer, is not guaranteed or endorsed by the publisher.
Supplementary materialThe Supplementary Material for this article can be found online at: https://www.frontiersin.org/articles/10.3389/fgene.2022.970316/full#supplementary-material
SUPPLEMENTARY FIGURE S1 | (A), SLC25A21 expression was not associated with cytogenetics in AML. (B), SLC25A21 expression was not associated with French–American–British (FAB) classifications.
SUPPLEMENTARY FIGURE S2 | (A), Mutation frequency of SLC25A21 in leukaemia.
SUPPLEMENTARY TABLE S1 | Univariate and multivariate Cox regression analysis.
SUPPLEMENTARY TABLE S2 | GO enrichment and KEGG pathway analysis.
SUPPLEMENTARY TABLE S3 | Patient sample information.
SUPPLEMENTARY TABLE S4 | List of primer sequences.
ReferencesAggarwal, V., Tuli, H. S., Varol, A., Thakral, F., Yerer, M. B., Sak, K., et al. (2019). Role of reactive oxygen species in cancer progression: Molecular mechanisms and recent advancements. Biomolecules 9, E735. doi:10.3390/biom9110735
PubMed Abstract | CrossRef Full Text | Google Scholar
Almotiri, A., Alzahrani, H., Menendez-Gonzalez, J. B., Abdelfattah, A., Alotaibi, B., Saleh, L., et al. (2021). Zeb1 modulates hematopoietic stem cell fates required for suppressing acute myeloid leukemia. J. Clin. Invest. 131, 129115. doi:10.1172/JCI129115
PubMed Abstract | CrossRef Full Text | Google Scholar
Bindea, G., Mlecnik, B., Tosolini, M., Kirilovsky, A., Waldner, M., Obenauf, A. C., et al. (2013). Spatiotemporal dynamics of intratumoral immune cells reveal the immune landscape in human cancer. Immunity 39, 782–795. doi:10.1016/j.immuni.2013.10.003
PubMed Abstract | CrossRef Full Text | Google Scholar
Boczonadi, V., King, M. S., Smith, A. C., Olahova, M., Bansagi, B., Roos, A., et al. (2018). Mitochondrial oxodicarboxylate carrier deficiency is associated with mitochondrial DNA depletion and spinal muscular atrophy-like disease. Genet. Med. 20, 1224–1235. doi:10.1038/gim.2017.251
PubMed Abstract | CrossRef Full Text | Google Scholar
Bosc, C., Broin, N., Fanjul, M., Saland, E., Farge, T., Courdy, C., et al. (2020). Autophagy regulates fatty acid availability for oxidative phosphorylation through mitochondria-endoplasmic reticulum contact sites. Nat. Commun. 11, 4056. doi:10.1038/s41467-020-17882-2
PubMed Abstract | CrossRef Full Text | Google Scholar
Cancer Genome Atlas Research, N., Ley, T. J., Miller, C., Ding, L., Raphael, B. J., Mungall, A. J., et al. (2013). Genomic and epigenomic landscapes of adult de novo acute myeloid leukemia. N. Engl. J. Med. 368, 2059–2074. doi:10.1056/NEJMoa1301689
PubMed Abstract | CrossRef Full Text | Google Scholar
Carmichael, C. L., Wang, J., Nguyen, T., Kolawole, O., Benyoucef, A., De Maziere, C., et al. (2020). The EMT modulator SNAI1 contributes to AML pathogenesis via its interaction with LSD1. Blood 136, 957–973. doi:10.1182/blood.2019002548
PubMed Abstract | CrossRef Full Text | Google Scholar
Chen, C. C., Li, B., Millman, S. E., Chen, C., Li, X., Morris, J. P., et al. (2020). Vitamin B6 addiction in acute myeloid leukemia. Cancer Cell. 37, 71–84. doi:10.1016/j.ccell.2019.12.002
PubMed Abstract | CrossRef Full Text | Google Scholar
Chen, K. T. J., Gilabert-Oriol, R., Bally, M. B., and Leung, A. W. Y. (2019). Recent treatment advances and the role of nanotechnology, combination products, and immunotherapy in changing the therapeutic landscape of acute myeloid leukemia. Pharm. Res. 36, 125. doi:10.1007/s11095-019-2654-z
PubMed Abstract | CrossRef Full Text | Google Scholar
Chen, S., Chen, Y., Zhu, Z., Tan, H., Lu, J., Qin, P., et al. (2020). Identification of the key genes and microRNAs in adult acute myeloid leukemia with FLT3 mutation by bioinformatics analysis. Int. J. Med. Sci. 17, 1269–1280. doi:10.7150/ijms.46441
PubMed Abstract | CrossRef Full Text | Google Scholar
Cheng, L., Zhang, S., Alexander, R., Yao, Y., MacLennan, G. T., Pan, C. x., et al. (2011). The landscape of EGFR pathways and personalized management of non-small-cell lung cancer. Future Oncol. 7, 519–541. doi:10.2217/fon.11.25
PubMed Abstract | CrossRef Full Text | Google Scholar
Ding, C., Shan, Z., Li, M., Chen, H., Li, X., and Jin, Z. (2021). Characterization of the fatty acid metabolism in colorectal cancer to guide clinical therapy. Mol. Ther. Oncolytics 20, 532–544. doi:10.1016/j.omto.2021.02.010
PubMed Abstract | CrossRef Full Text | Google Scholar
Fang, T., Zhang, Y., Chang, V. Y., Roos, M., Termini, C. M., Signaevskaia, L., et al. (2020). Epidermal growth factor receptor-dependent DNA repair promotes murine and human hematopoietic regeneration. Blood 136, 441–454. doi:10.1182/blood.2020005895
PubMed Abstract | CrossRef Full Text | Google Scholar
Fiermonte, G., Dolce, V., PaLmieri, L., VenturaM., , Runswick, M. J., PalmieriF., , et al. (2001). Identification of the human mitochondrial oxodicarboxylate carrier. Bacterial expression, reconstitution, functional characterization, tissue distribution, and chromosomal location. J. Biol. Chem. 276, 8225–8230. doi:10.1074/jbc.M009607200
PubMed Abstract | CrossRef Full Text | Google Scholar
Fiermonte, G., PaLmieri, L., Dolce, V., Lasorsa, F. M., PalmieriF., , Runswick, M. J., et al. (1998). The sequence, bacterial expression, and functional reconstitution of the rat mitochondrial dicarboxylate transporter cloned via distant homologs in yeast and Caenorhabditis elegans. J. Biol. Chem. 273, 24754–24759. doi:10.1074/jbc.273.38.24754
PubMed Abstract | CrossRef Full Text | Google Scholar
Forte, D., Garcia-Fernandez, M., Sanchez-Aguilera, A., Stavropoulou, V., Fielding, C., Martin-Perez, D., et al. (2020). Bone marrow mesenchymal stem cells support acute myeloid leukemia bioenergetics and enhance antioxidant defense and escape from chemotherapy. Cell. Metab. 32, 829–843. doi:10.1016/j.cmet.2020.09.001
PubMed Abstract | CrossRef Full Text | Google Scholar
Geeleher, P., Cox, N., and Huang, R. S. (2014). pRRophetic: an R package for prediction of clinical chemotherapeutic response from tumor gene expression levels. PLoS One 9, e107468. doi:10.1371/journal.pone.0107468
PubMed Abstract | CrossRef Full Text | Google Scholar
Goldman, M. J., Craft, B., Hastie, M., Repecka, K., McDade, F., Kamath, A., et al. (2020). Visualizing and interpreting cancer genomics data via the Xena platform. Nat. Biotechnol. 38, 675–678. doi:10.1038/s41587-020-0546-8
PubMed Abstract | CrossRef Full Text | Google Scholar
Gollner, S., Oellerich, T., Agrawal-Singh, S., Schenk, T., Klein, H. U., Rohde, C., et al. (2017). Loss of the histone methyltransferase EZH2 induces resistance to multiple drugs in acute myeloid leukemia. Nat. Med. 23, 69–78. doi:10.1038/nm.4247
PubMed Abstract | CrossRef Full Text | Google Scholar
Haferlach, T., Kohlmann, A., Wieczorek, L., Basso, G., Kronnie, G. T., Bene, M. C., et al. (2010). Clinical utility of microarray-based gene expression profiling in the diagnosis and subclassification of leukemia: Report from the international microarray Innovations in leukemia study group. J. Clin. Oncol. 28, 2529–2537. doi:10.1200/JCO.2009.23.4732
PubMed Abstract | CrossRef Full Text | Google Scholar
Hou, P., Wu, C., Wang, Y., Qi, R., Bhavanasi, D., Zuo, Z., et al. (2017). A genome-wide CRISPR screen identifies genes critical for resistance to FLT3 inhibitor AC220. Cancer Res. 77, 4402–4413. doi:10.1158/0008-5472.CAN-16-1627
PubMed Abstract | CrossRef Full Text | Google Scholar
Kunji, E. R. S., King, M. S., Ruprecht, J. J., and Thangaratnarajah, C. (2020). The SLC25 carrier family: Important transport proteins in mitochondrial physiology and pathology. Physiol. (Bethesda) 35, 302–327. doi:10.1152/physiol.00009.2020
PubMed Abstract | CrossRef Full Text | Google Scholar
Le Sommer, S., Morrice, N., Pesaresi, M., Thompson, D., Vickers, M. A., Murray, G. I., et al. (2018). Deficiency in protein tyrosine phosphatase PTP1B shortens lifespan and leads to development of acute leukemia. Cancer Res. 78, 75–87. doi:10.1158/0008-5472.CAN-17-0946
PubMed Abstract | CrossRef Full Text | Google Scholar
Liu, S., He, B., and Li, H. (2022). Bisphenol S promotes the progression of prostate cancer by regulating the expression of COL1A1 and COL1A2. Toxicology 472, 153178. doi:10.1016/j.tox.2022.153178
PubMed Abstract | CrossRef Full Text | Google Scholar
Martelli, A. M., Evangelisti, C., Chiarini, F., Grimaldi, C., Manzoli, L., and McCubrey, J. A. (2009). Targeting the PI3K/AKT/mTOR signaling network in acute myelogenous leukemia. Expert Opin. Investig. Drugs 18, 1333–1349. doi:10.1517/14728220903136775
PubMed Abstract | CrossRef Full Text | Google Scholar
Metsalu, T., and Vilo, J. (2015). ClustVis: A web tool for visualizing clustering of multivariate data using principal component analysis and heatmap. Nucleic Acids Res. 43, W566–W570. doi:10.1093/nar/gkv468
留言 (0)