
記住我


The cerebral cortex has undergone a remarkable expansion, including the evolution of distinct axonal tracts that have enabled the acquisition of complex motor and cognitive abilities [reviewed in Lui et al. (2011), Molnar et al. (2014), Fernandez et al. (2016)]. Callosal projection neurons and their associated axonal pathway in the corpus callosum are an evolutionary innovation thought to underpin the complex cognitive abilities of placental mammals. Callosal projection neurons are a broad population of interhemispheric projection neurons that extend an axon across the corpus callosum to connect the two cerebral hemispheres (Aboitiz and Montiel, 2003). The relative number of callosal projection neurons has expanded extensively throughout evolution of mammals, accounting for much of the neocortical thickness difference observed between macaque and human (Smart et al., 2002; Molnar et al., 2006; Fame et al., 2011). Callosal projection neurons are found throughout the layers of the neocortex; they are the predominant subtype of projection neuron in superficial layers (layers II/III), but about 20% of callosal projection neurons are found in deep layers, predominantly layer V. Deep layer callosal projection neurons are born at an earlier developmental stage than superficial layer callosal projection neurons and are molecularly distinct [reviewed in Fame et al. (2011)]. Although there are a small number of genes whose expression identify callosal projection neurons as a broad population, deep and superficial layer callosal projection neurons populations express distinct combinations of genes (Molyneaux et al., 2009, 2015; Klingler et al., 2019). Further, certain genes expressed by both, such as SATB2, appear to be regulated differently in deep layer callosal projection neurons than in superficial layer callosal projection neurons (Tashiro et al., 2011; Paolino et al., 2020). Deep layer callosal projection neurons, in fact, have been posited to be an evolutionarily older subpopulation of callosal projection neurons, perhaps forming the earliest interhemispheric connections.
The deep layer callosal projection neurons of layer V are generated concurrently with subcerebral projection neurons of layer V, predominantly corticospinal projection neurons [reviewed in Greig et al. (2013), Lodato and Arlotta (2015)]. The axons of the corticospinal projection neurons comprise the corticospinal tract, which is unique to mammals (Welniarz et al., 2017; Sahni et al., 2020). The full extension of the corticospinal tract to the lumbar segments that control walking is, like the corpus callosum, unique to placental mammals (Heffner and Masterton, 1975; Armand, 1982). The corticospinal tract is thought to underpin complex mammalian fine motor skills (Welniarz et al., 2017). Despite their divergent projections and functions, corticospinal motor neurons and layer V callosal projection neurons are generated at the same embryonic timepoint from the same progenitors (Greig et al., 2013; Lodato and Arlotta, 2015; Mancinelli and Lodato, 2018; Pinson and Huttner, 2021). The molecular mechanisms regulating the divergence of these distinct projection neuron populations are incompletely understood, however. Our recent work identified a genomic cluster of miRNAs (Mirg/12qF1) that is unique to placental mammals and specifically expressed by corticospinal neurons, and excluded from callosal projection neurons, during the molecular refinement of corticospinal and callosal fate (Diaz et al., 2020). One of these, miR-409-3p, has been shown to convert layer V callosal into corticospinal projection neurons, acting in part through the repression of the callosal-expressed transcriptional regulator Lmo4 (Diaz et al., 2020). Our prior data suggest, however, that miR-409-3p represses additional callosal projection neuron control genes in order to specify corticospinal projection neurons.
One potential additional target of miR-409-3p repression is the transcriptional co-activator CBP/p300 Interacting Trans-activator 2 (Cited2). Cited2 is highly expressed by callosal projection neurons, relative to corticospinal motor neurons, from the earliest stages of neurogenesis (Molyneaux et al., 2009), which is a reciprocal expression pattern to miR-409-3p. Cited2 interacts genetically with Lmo4 (Michell et al., 2010), and CITED2 and LMO4 function as opposing molecular controls over specific areal identity within superficial layer callosal projection neurons of the somatosensory and motor cortices, respectively (Fame et al., 2016). Expression of Cited2 is evolutionarily conserved between macaque and mouse (Fame et al., 2017), including in the expanded subventricular zone (SVZ) and superficial layers of primates, and layer V callosal projection neurons. Our previous work demonstrated that CITED2 is necessary for the expansion of intermediate progenitor cells (IPCs) in the SVZ, and the resulting generation of superficial layer callosal projection neurons (Fame et al., 2016). Further, forebrain-specific Cited2 conditional knockout (cKO) leads to behavioral deficits associated with human neurodevelopmental disorders (Wagner and MacDonald, 2021), highlighting the importance of CITED2 in cognitive function. Here, we investigate whether CITED2 is also necessary for the establishment of layer V callosal projection neurons, and whether it is repressed by members of the evolutionarily acquired Mirg/12qF1 miRNA cluster to refine the identity of layer V corticospinal projection neurons.
Materials and methods miRNA target predictionWe searched for predicted miRNA targets using the search tools miRanda (Enright et al., 2003; John et al., 2004; Betel et al., 2008, 2010), Targetscan (Agarwal et al., 2015), DIANALAB (Maragkakis et al., 2009; Papadopoulos et al., 2009; Reczko et al., 2011), and miRDB (Wong and Wang, 2015; Liu and Wang, 2019).
Luciferase assaysLuciferase reporter assays were performed using the Dual-Glo Luciferase Assay System (Promega), pmir-GLO based reporter constructs, and miRNA oligonucleotides (Horizon Discovery) according to manufacturer’s instructions, as previously described (Jin et al., 2013; Beard et al., 2016). Briefly, COS7 cells (104/well) were seeded in a white 96-well plate. The following day, the media was replaced with transfection mixture, pmir-GLO reporter-miRNA oligo-DharmaFECT Duo (Dharmacon), and incubated overnight. Firefly and renilla luciferase reporter fluorescence was read using a Tecan Infinite M1000 (Stanford High-Throughput Bioscience Center Core Facility). The ratio of firefly to renilla fluorescence was calculated for each well, and averaged across triplicate wells. Match reporter vectors contained wild-type predicted miR-409-3p seed regions (CAACATT) with 30bp of flanking Cited2 3′ UTR on either side. Mismatch reporter vectors were identical to match reporters except that seed sequences were replaced by GGGGGGG. Additional negative controls using empty reporter vectors and scrambled control oligos were performed.
Fluorescent activated cell sorting of intermediate progenitor cellsSorting of IPCs for qPCR analysis was performed as previously described (Hrvatin et al., 2014; Baizabal et al., 2018). In brief, neocortical tissue from e15.5 embryos was dissected, dissociated, and pooled by genotype. Cells were fixed and resuspended in antibody buffer containing rabbit anti-TBR2 (Abcam cat# ab23345, RRID:AB_778267), followed by Alexa Fluor goat anti-rabbit 546 (1:750). Steps following dissociation were carried out with RNase-free reagents, treated with either 1:20 RNasin (recovery buffers), 1:40 RNasin (antibody buffers), or 1:100 RNasin (fixing solution and washing buffer). Cells were sorted at the Syracuse University Flow Core Facility with a FACS Aria II sorter (BD Biosciences) using an 85 μm nozzle and FACS Diva 8.0 software. Thresholds for 546 nm sorting gates were set using secondary only controls. Approximately 170,000–250,000 cells were collected for each population (TBR2 + and TBR2–) for each biological replicate. Successful sorting was validated with immunohistochemistry (Supplementary Figures 1A–A”) and qPCR (Figure 1D).
FIGURE 1
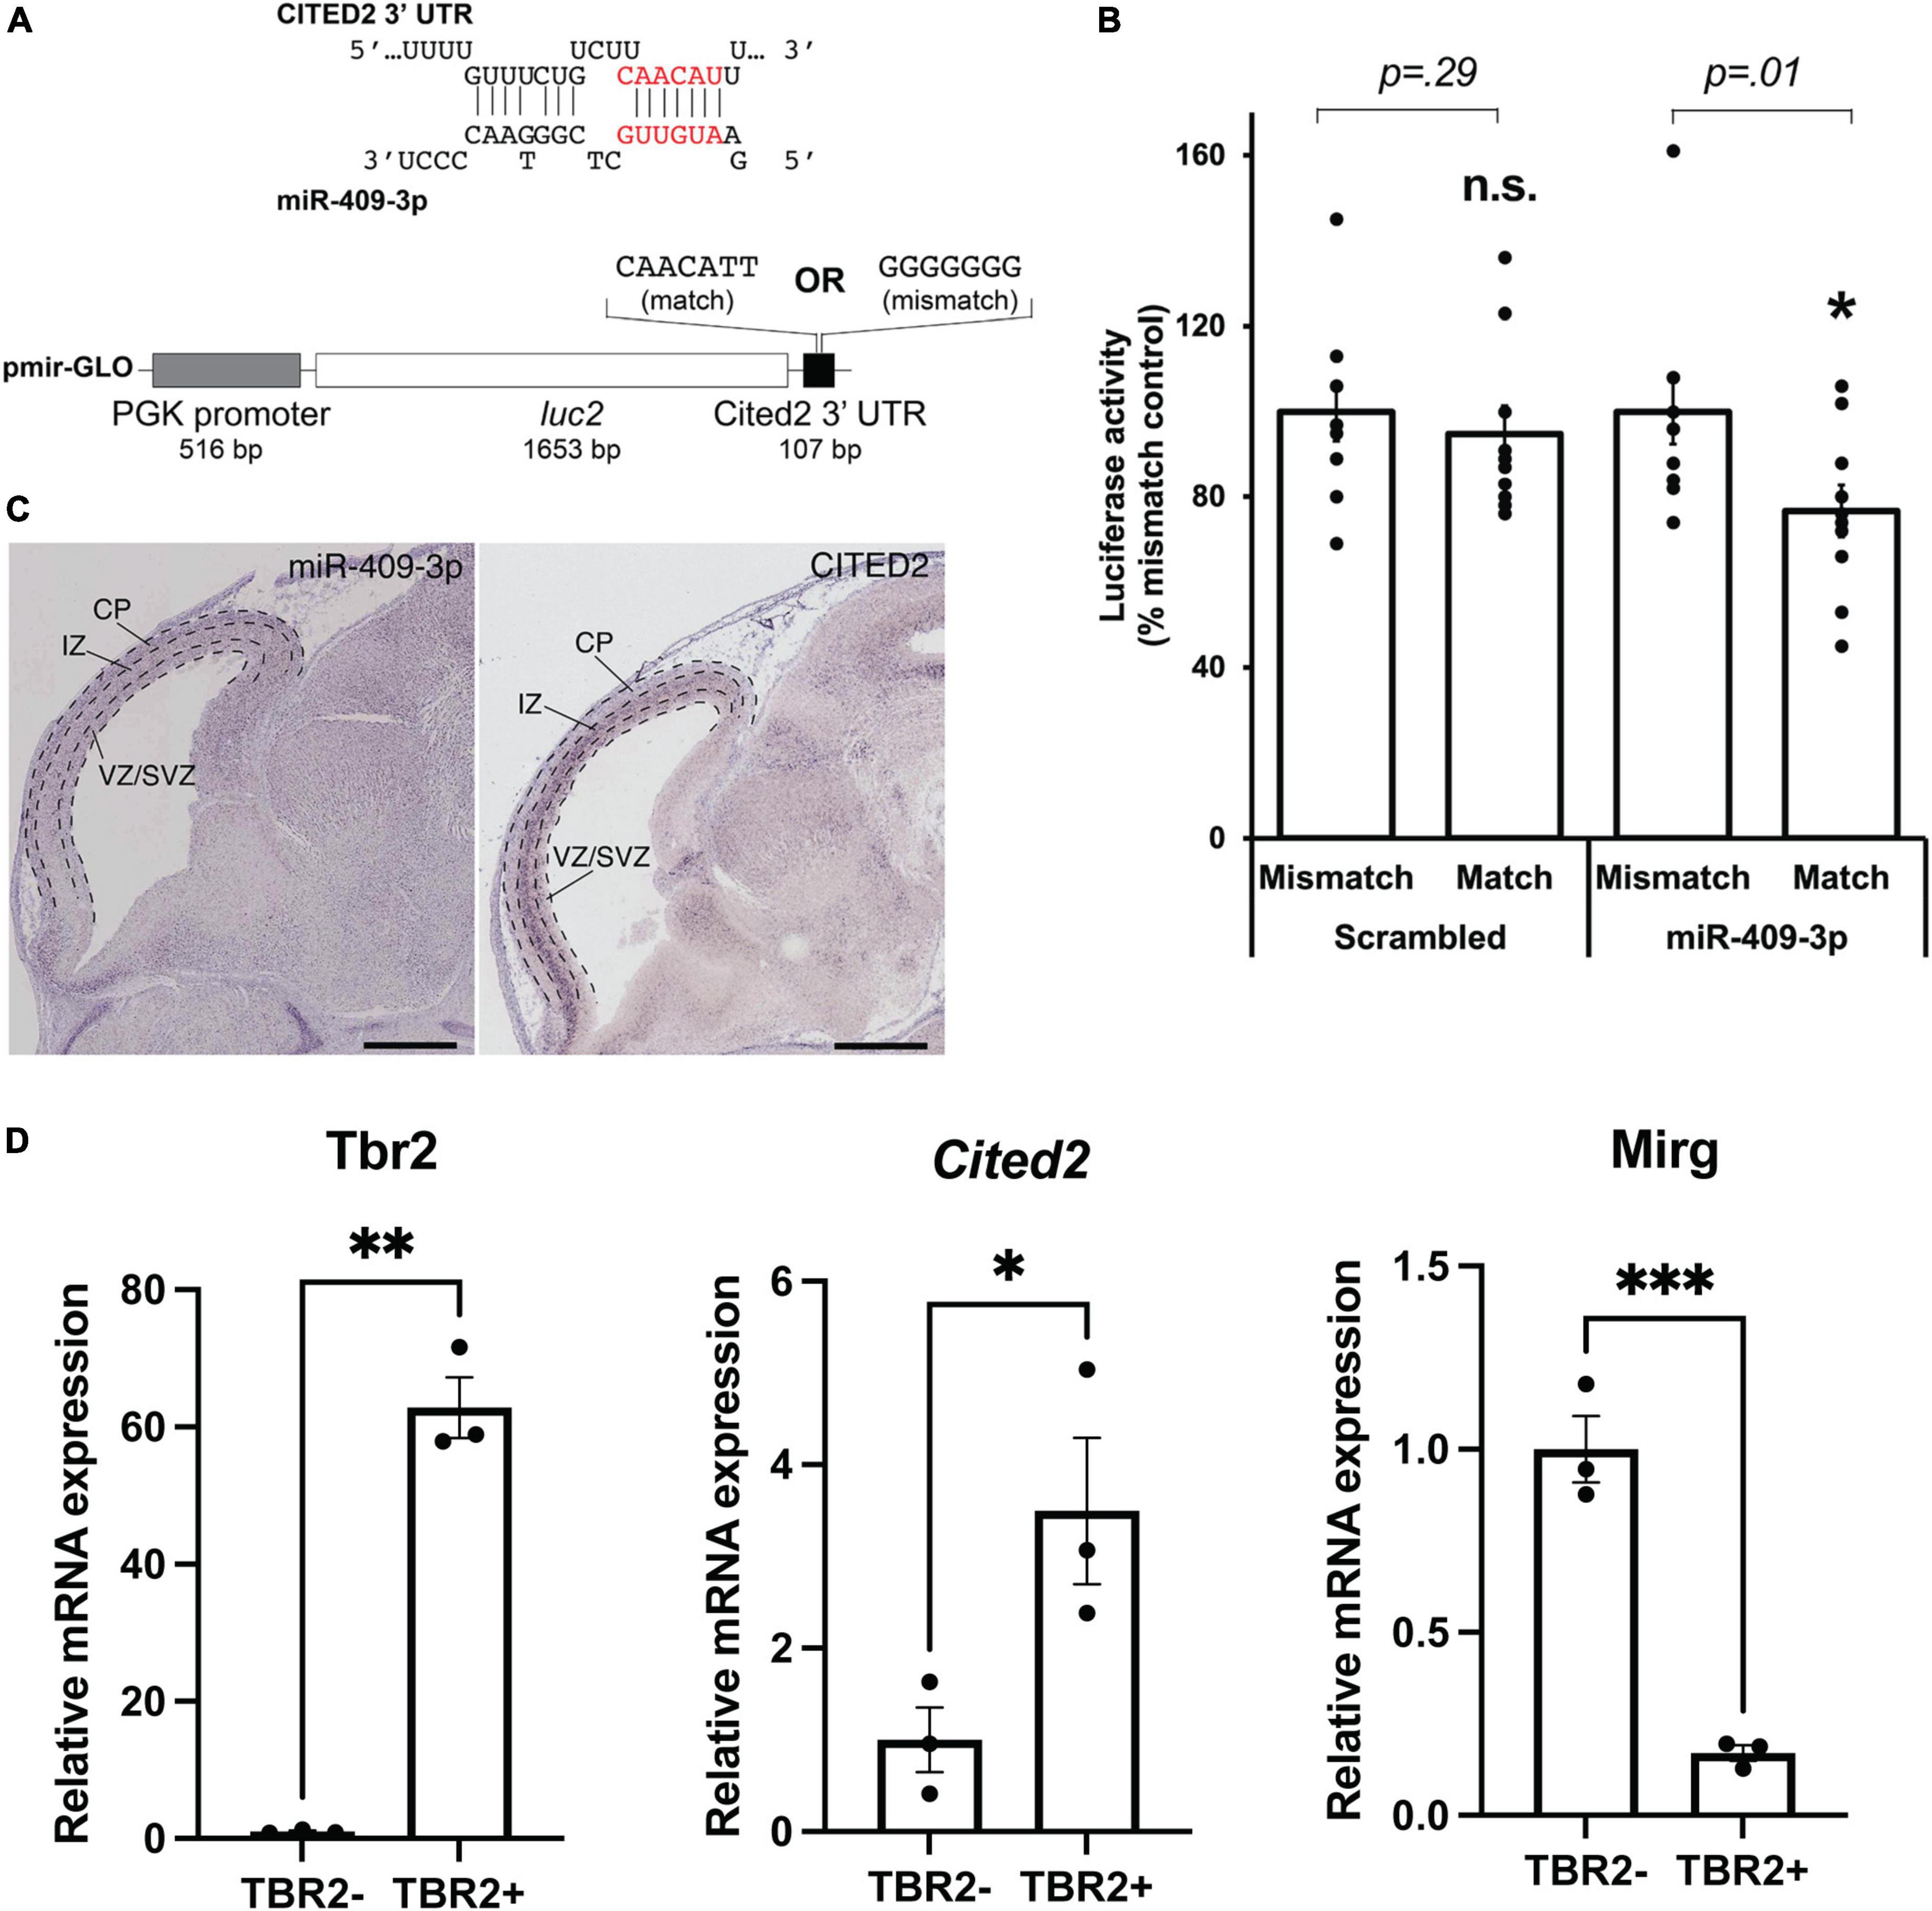
Figure 1. miR-409-3p represses the transcriptional regulator Cited2. (A) Sequence alignment demonstrating the predicted miR-409-3p target site in the Cited2 3′ UTR. Seed sequence base-pairing is in red. Luciferase reporter constructs were generated with the Cited2 3′ UTR fused to luc2, containing the wild-type predicted miR-409-3p target sequence (match). Mismatch reporter vectors were identical except that the target sequence was replaced by a sequence that would not be recognized by miR-409-3p (mismatch). (B) miR-409-3p oligonucleotides repress a Cited2 3′UTR luciferase reporter gene bearing wild-type, but not mismatch, miR-409-3p target sequences. Scrambled miRNA does not repress the Cited2 reporter. Error bars represent SEM. *p < 0.05 compared to mismatch control. (C) In the e14.5 dorsal telencephalon, miR-409-3p is enriched in the VZ and CP, and not in the upper SVZ and IZ, with minimal overlap with Cited2. Dashed lines indicate boundaries of the ventricular zone/sub-ventricular zone (VZ/SVZ), intermediate zone (IZ), and cortical plate (CP). Scale bars = 1 mm. Raw images from the Eurexpress database (Diez-Roux et al., 2011). (D) Cited2 expression is enriched in IPCs at e15.5 by qPCR, while Mirg, which encodes miR-409-3p, is enriched in the TBR2- cells. Error bars represent SEM. Each dot depicts an independent biological replicate. *p < 0.05; **p < 0.01 (Two-tailed t-test for Cited2 and Mirg; Welch’s correction was performed for Tbr2 due to unequal variance).
mRNA quantitative-PCRRNA was extracted from FAC-sorted samples using Recover All™ Total Nucleic Acid Isolation kit (Ambion). RNA quantity and quality were evaluated with Agilent RNA 6000 Pico chip with a 2100 Bioanalyzer (Agilent). cDNA was synthesized using qScript cDNA SuperMix (Quanta Biosciences). RT-qPCR was performed on a CFX Connect Real-Time System (Bio-Rad) using intron-spanning primer pairs to avoid genomic DNA amplification. Primers:
Cited2: forward 5′-GCTGTCCCTCTATGTGCTG-3′; reverse 5′-TGGTCTGCCATTTCCAGTC-3′
Mirg: forward 5′-TCGGCAGTACATACCAGGTG-3′; reverse 5′-ACTGATGGCTTCAGGTCAGG-3′ (Sanli et al., 2018)
Tbr2: forward 5′-CACCCAGAATCTCCTAACACTG-3′; reverse 5′-AGCCTCGGTTGGTATTTGTG-3′
Housekeeping Reference Genes:
Gapdh: forward 5′- GGC ATT GCT CTC AAT GAC AA -3′; reverse 5′- TGT GAG GGA GAT GCT CAG TG -3′
S16: forward 5′- CACTGCAAACGGGGAAATGG –3′; reverse 5′- TGA GA TGG ACT GTC GGA TGG –3′.
Lentivirus vectorsLentivirus vectors were modified from the pSicoR backbone (Ventura et al., 2004), a gift from Tyler Jacks (Addgene plasmid #11579). Expression of miRNA was under direction of the strong U6 promoter. miRNA inserts were either: miR-409-3p (GOF: GAATGTTGCTCGGTGAACCCCTTTTTT), or scrambled (control, CCTAAGGTTAAGTCGCCCTCGCTC CGAGGGCGACTTAACCTTAGGTTTTT). All miRNA inserts were cloned between HpaI and XhoI sites. Expression of GFP was under direction of the CMV promoter. Lentivirus packaging was provided by System Biosciences (Palo Alto, CA). Titers of VSV-G pseudotyped viral particles were ∼107 IFUS/mL.
Cortical culturesPrimary cortical neuronal cultures were prepared as described previously (Diaz et al., 2020). Briefly, e14.5 CD-1 cortices were dissected and dissociated with gentle papain (Sigma) digestion. Cells were then plated on coverslips coated with poly-D-lysine (100 μg/ml, Sigma) alone or in combination with Laminin (20 μg/ml, Life Technologies). For miR409-3p GOF studies, cells were infected with lentivirus, and cultured on coverslips placed in 6-well plates for 2 days in growth media (50% DMEM, 50% neural basal media, supplemented with B27, BDNF, forskolin, insulin, transferrin, progesterone, putrescine, and sodium selenite). For Cited2 knockdown experiments, 5 × 10⁶ cells were electroporated with 12.5 μg of shScram or shCited2 plasmids (BTX ECM 830 Square Waveform Electroporation system, following the parameters: 700 V, one unipolar pulse at 100 μs pulse length in a 100 ms interval) and allowed to recover for 5 min. Cells were plated in Neurobasal media containing 10% fetal bovine serum, 1% GlutaMAX, and 1% penicillin-streptomycin (reagents from Thermo Fisher Scientific) at a density of 50,000 cells per coverslip in a 24-well plate. After 4 h, plating media was replaced with Neurobasal media containing 1% B27, 1% N2, 1% GlutaMAX, and 1% penicillin-streptomycin (reagents from Thermo Fisher Scientific). Half media changes were carried out every 2 days. Cells were maintained at 37°C, 5% CO2 until fixation. Knockdown of Cited2 was analyzed by RT-qPCR, as out lined above, on duplicate wells to those analyzed by immunocytochemistry (Supplementary Figure 1B).
Immunocytochemistry of cultured cellsCells were fixed with 4% PFA in PBS. Coverslips were blocked with PBS containing 0.1% Triton-X100, 2% sheep serum, and 1% BSA, and cells were incubated with primary antibodies: anti-TBR2 (Abcam, rabbit polyclonal, cat# ab23345, RRID:AB_778267, 1:250), and/or anti-Tuj1 (Abcam, cat# ab7751, RRID:AB_306045, 1:200), anti-GFP (Life Technologies, cat# ab6662, RRID:AB_305635, 1:1000), anti-CTIP2 (Abcam, cat# ab18465, RRID:AB_2064130, 1:1000), anti-SATB2 (Abcam, cat# ab51502, RRID:AB_882455, 1:1000). Secondary antibodies: anti-rat (Pierce, CY3-conjugate, 1:1000), and/or anti-rabbit (Pierce, CY5-conjugate, 1:1000), and anti-GFP (Abcam, goat-FITC conjugated, 1:250).
For quantification, cells were imaged on a Zeiss AxioImager microscope. Transfected cells were counted in 16 randomly selected high-powered fields, blind to experimental condition, in 9 independent cultures. Statistical analyses were carried out in Microsoft Excel using paired two tailed t-tests. For quantification of effects of Cited2 knockdown, 4 randomly selected fields per coverslip per condition were imaged using 10x objective on a Nikon Ni-U upright microscope, across 5 independent cultures. Statistical analyses were carried out in GraphPad Prism 8.0 (GraphPad Software) using one-way ANOVA followed by Tukey’s multiple comparisons test.
Cited2 conditional knockout miceAll animal experimental protocols were approved by the Syracuse University Institutional Animal Care and Use Committee and adhere to NIH ARRIVE guidelines. Cited2 conditional floxed mice (Preis et al., 2006) were provided by Dr. Sally Dunwoodie, University of New South Wales, Australia. Emx1-Cre mice (Gorski et al., 2002) were obtained from The Jackson Laboratory (RRID:IMSR_JAX:005628). Breeding was performed as described previously (Wagner and MacDonald, 2021). Genotypes were assessed by PCR using the following primers: Cited2 flox/flox, flox/wt, and wt/wt were determined using – Cited2 Forward 5′-GTCTCAGCGTCTGCTCGTTT-3′; Cited2 Reverse 5′-CTGCTGCTGTTGGTGATGAT-3′. Emx1 was distinguished from Emx1-Cre using – Emx1 WT Forward 5′-GAAGGGTTCCCACCATATCAACC-3′; Emx1 WT Reverse 5′-CATAGGGAAGGGGGACATGAGAG-3′; Emx1-Cre Reverse 5′-TGCGAACCTCATCACTCGTTGC-3′.
Immunohistochemistry of tissue sectionsImmunohistochemistry was performed as previously described (Fame et al., 2016). Briefly, E18.5 brains were post-fixed overnight in 4% PFA/PBS at 4°C, and sectioned on a VT1000S vibrating microtome (Leica Microsystems). Antigen retrieval was performed in 0.1M citric acid (pH = 6.0) for 10 min at 95–98°C. Sections were incubated in primary antibody at 4°C overnight (rat anti-CTIP2 (Abcam cat# ab18465, RRID:AB_2064130) and mouse anti-SATB2 [Abcam cat# ab51502, RRID:AB_882455)], and appropriate secondary antibodies were selected from the Molecular Probes Alexa series (Invitrogen, Carlsbad, CA). SATB2+, CTIP2+, and double positive cells were counted in layer V over a set distance on e18.5 coronal sections. Images were taken in the presumptive developing motor, somatosensory, and visual cortical areas based on the section’s alignment to the Atlas of the Developing Mouse Brain (Paxinos et al., 2007). All matching, imaging, and counting was performed by a researcher blinded to genotype. GraphPad Prism 8.0 (GraphPad Software) was used to carry out the statistical analyses; two-way ANOVA with Šídák’s multiple comparisons.
Results miR-409-3p represses the transcriptional regulator Cited2We have previously shown that miR-409-3p represses the callosal-expressed transcriptional activator Lmo4 (Diaz et al., 2020). Our data suggest, however, that miR-409-3p represses additional callosal-expressed genes in order to specify corticospinal projection neurons. Bioinformatic analyses using the search tools miRanda (Enright et al., 2003; John et al., 2004; Betel et al., 2008, 2010), Targetscan (Lewis et al., 2005; Grimson et al., 2007; Friedman et al., 2009; Garcia et al., 2011; Agarwal et al., 2015), DIANALAB microT (Maragkakis et al., 2009; Papadopoulos et al., 2009; Reczko et al., 2011), and miRDB (Wong and Wang, 2015; Liu and Wang, 2019) predict that miR-409-3p represses a second callosal-expressed transcriptional regulator Cited2. Because Cited2 and Lmo4 are known to interact genetically during thymus development (Michell et al., 2010), and because Cited2 and Lmo4 cooperatively control callosal projection neuron areal identity, the predicted interaction of miR-409-3p with Cited2 appeared to be highly biologically relevant. miR-409-3p is predicted to target a single site in the Cited2 3′ untranslated region (3′ UTR) (Figure 1A). To investigate whether miR-409-3p can use this site to repress gene expression, we performed luciferase reporter gene assays in COS7 cells, as previously described (Jin et al., 2013; Beard et al., 2016; Diaz et al., 2020). We used Cited2 reporter vectors containing either wild-type or mutated (mismatch) miR-409-3p Cited2 target sites and flanking 3′UTR sequences (Figure 1A). We found that miR-409-3p oligonucleotides significantly repress Cited2 luciferase reporter gene expression with wild-type, but not mismatch, miR-409-3p target sequences (Figure 1B). Scrambled control miRNA oligonucleotides do not repress the Cited2 luciferase reporter gene (Figure 1B).
In addition to its role in postmitotic callosal projection neuron development, Cited2 regulates IPC function, specifically the number and proliferation of TBR2 + IPCs in the neocortex at e15.5, and thereby regulates the thickness of the mature superficial neocortex (Fame et al., 2016). Cited2 and miR-409-3p appear to be expressed in non-overlapping cell populations in the e14.5 developing cortex by in situ hybridization (Diez-Roux et al., 2011; Figure 1C). Cited2 is expressed in the SVZ, extending into the intermediate zone, as well as in a subset of cells in the cortical plate. miR-409-3p, on the other hand, is expressed in the VZ and cortical plate. To confirm that Cited2 mRNA is enriched in e15.5 TBR2 + IPCs and that miR-409-3p is exclude from IPCs, we purified IPCs based on fluorescence activated cell sorting (FACS) of TBR2 + cells from e15.5 cortices. We confirmed the enrichment of TBR2 + IPCs via immunocytochemistry for TBR2 (Supplementary Figure 1A), and via RT-qPCR, demonstrating an approximate 55-fold enrichment in Tbr2 in the TBR2 + cells versus the TBR2- cells (Figure 1D). Employing RT-qPCR, we confirmed that Mirg, the mRNA encoding miR-409-3p as part of a larger, polycistronic transcript and Cited2 are reciprocally expressed in these cell populations, as would be predicted if miR-409-3p were repressing Cited2 expression in TBR2- cells (Figure 1D). Collectively, the data suggest that miR-409-3p can repress expression of the IPC- and callosal projection neuron-expressed transcriptional regulator Cited2, potentially thereby regulating IPC cell number and proliferation, and subtype-specific cortical projection neuron development.
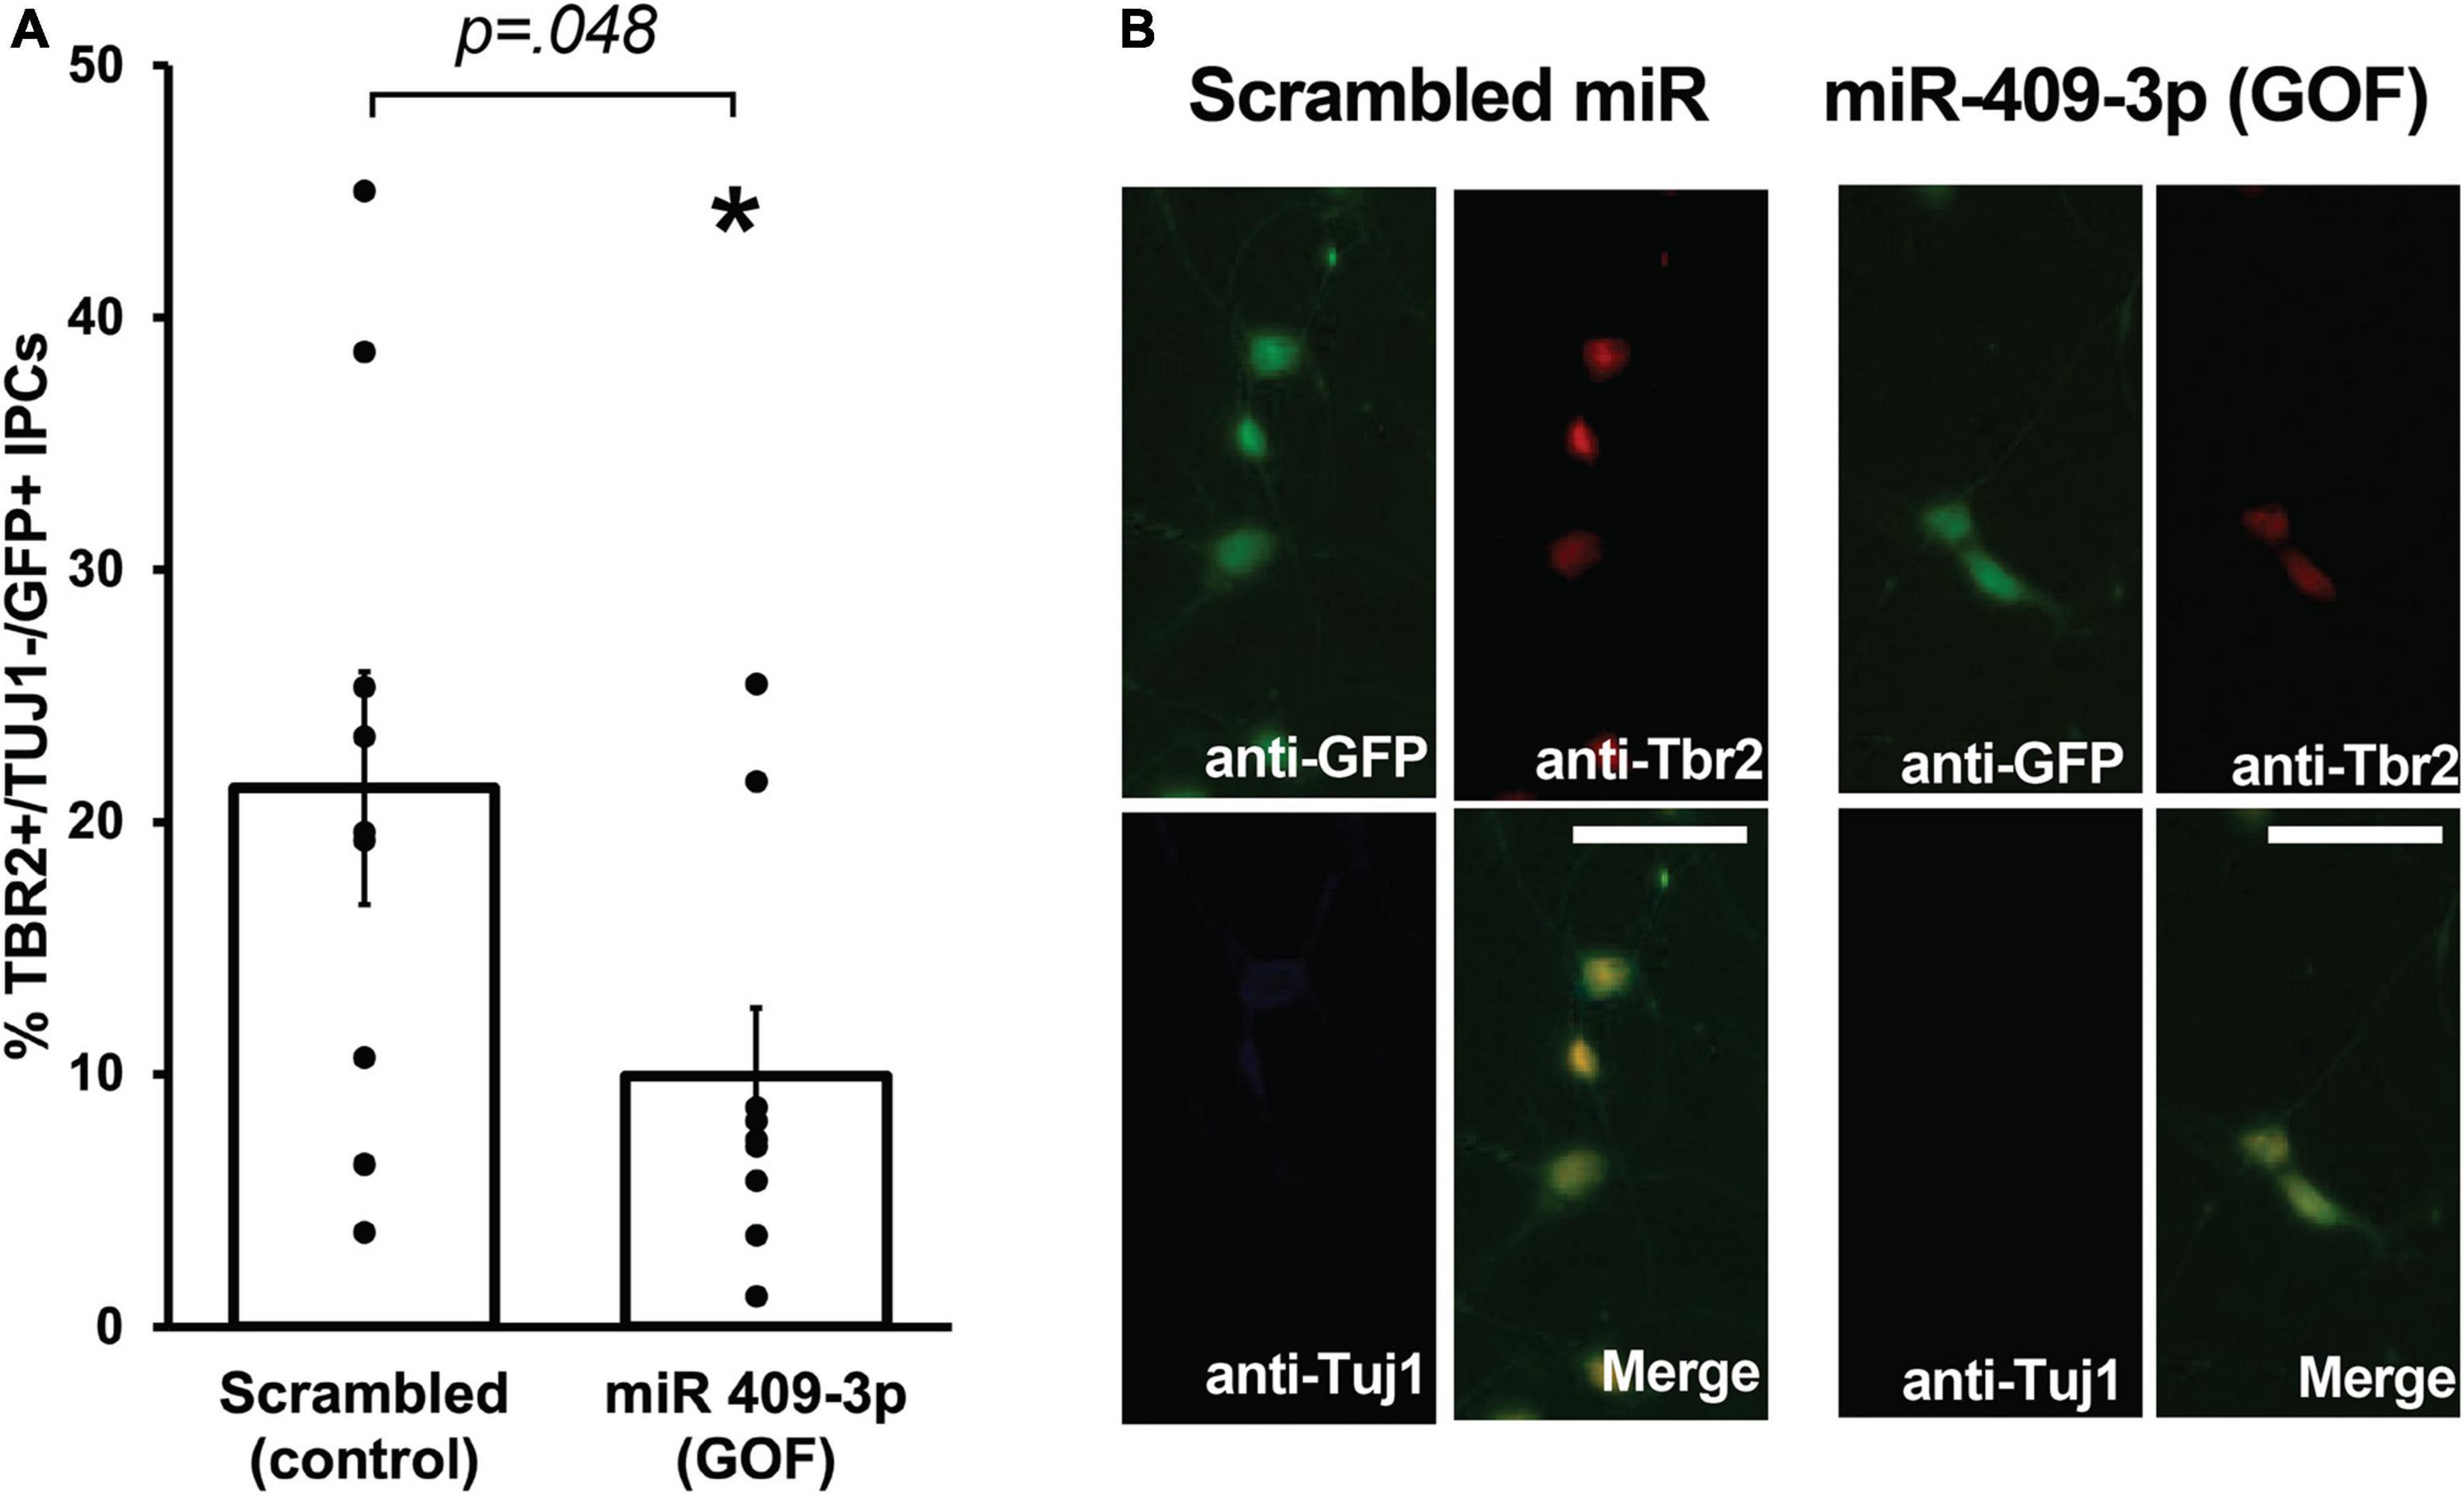
miR-409-3p gain-of-function phenocopies Cited2 loss-of-function, reducing the number of intermediate progenitor cellsWe showed previously that Cited2 is required for the expansion of IPCs in the SVZ, and that Cited2 LOF results in the generation of fewer TBR2 + IPCs at E15.5, likely as a result of reduced proliferation of IPCs rather than apoptotic cell death (Fame et al., 2016). To better understand the role of miR-409-3p in regulating neocortical development, we carried out miR-409-3p overexpression GOF experiments in primary cultures of embryonic cortical progenitors. Cultures of e14.5 cortical cells were transfected with lentiviral vectors expressing miR-409-3p and GFP or a control scrambled miRNA insert and GFP, and examined for cell type-specific protein expression by immunocytochemistry on day 2 in culture. To quantify IPCs and differentiated neurons within the GFP-positive transfected population, we analyzed expression of TBR2, a marker of IPCs, and Tuj1, a marker of differentiated neurons. Relative to scrambled control, miR-409-3p transfected cultures (GOF) display a significant decrease in TBR2 + /Tuj1- IPCs (Figures 2A,B), phenocopying the previously reported in vivo Cited2 LOF (Fame et al., 2016), as would be predicted if miR-409-3p were repressing Cited2 in cortical progenitors.
FIGURE 2
Figure 2. miR-409-3p represses intermediate progenitor cell proliferation in primary culture. (A) miR-409-3p overexpression gain-of-function (GOF) decreases the percent Tbr2 + /Tuj1-/GFP + IPCs compared to scrambled control in embryonic cortical cultures. (B) Representative fluorescence micrographs of embryonic cortical cultures illustrate a decrease in the percent Tbr2 + /Tuj1-/GFP + IPCs with miR-409-3p GOF. Scale bar, 50 μm. Each dot depicts an independent biological replicate. *p < 0.05 (Two-tailed t-test).
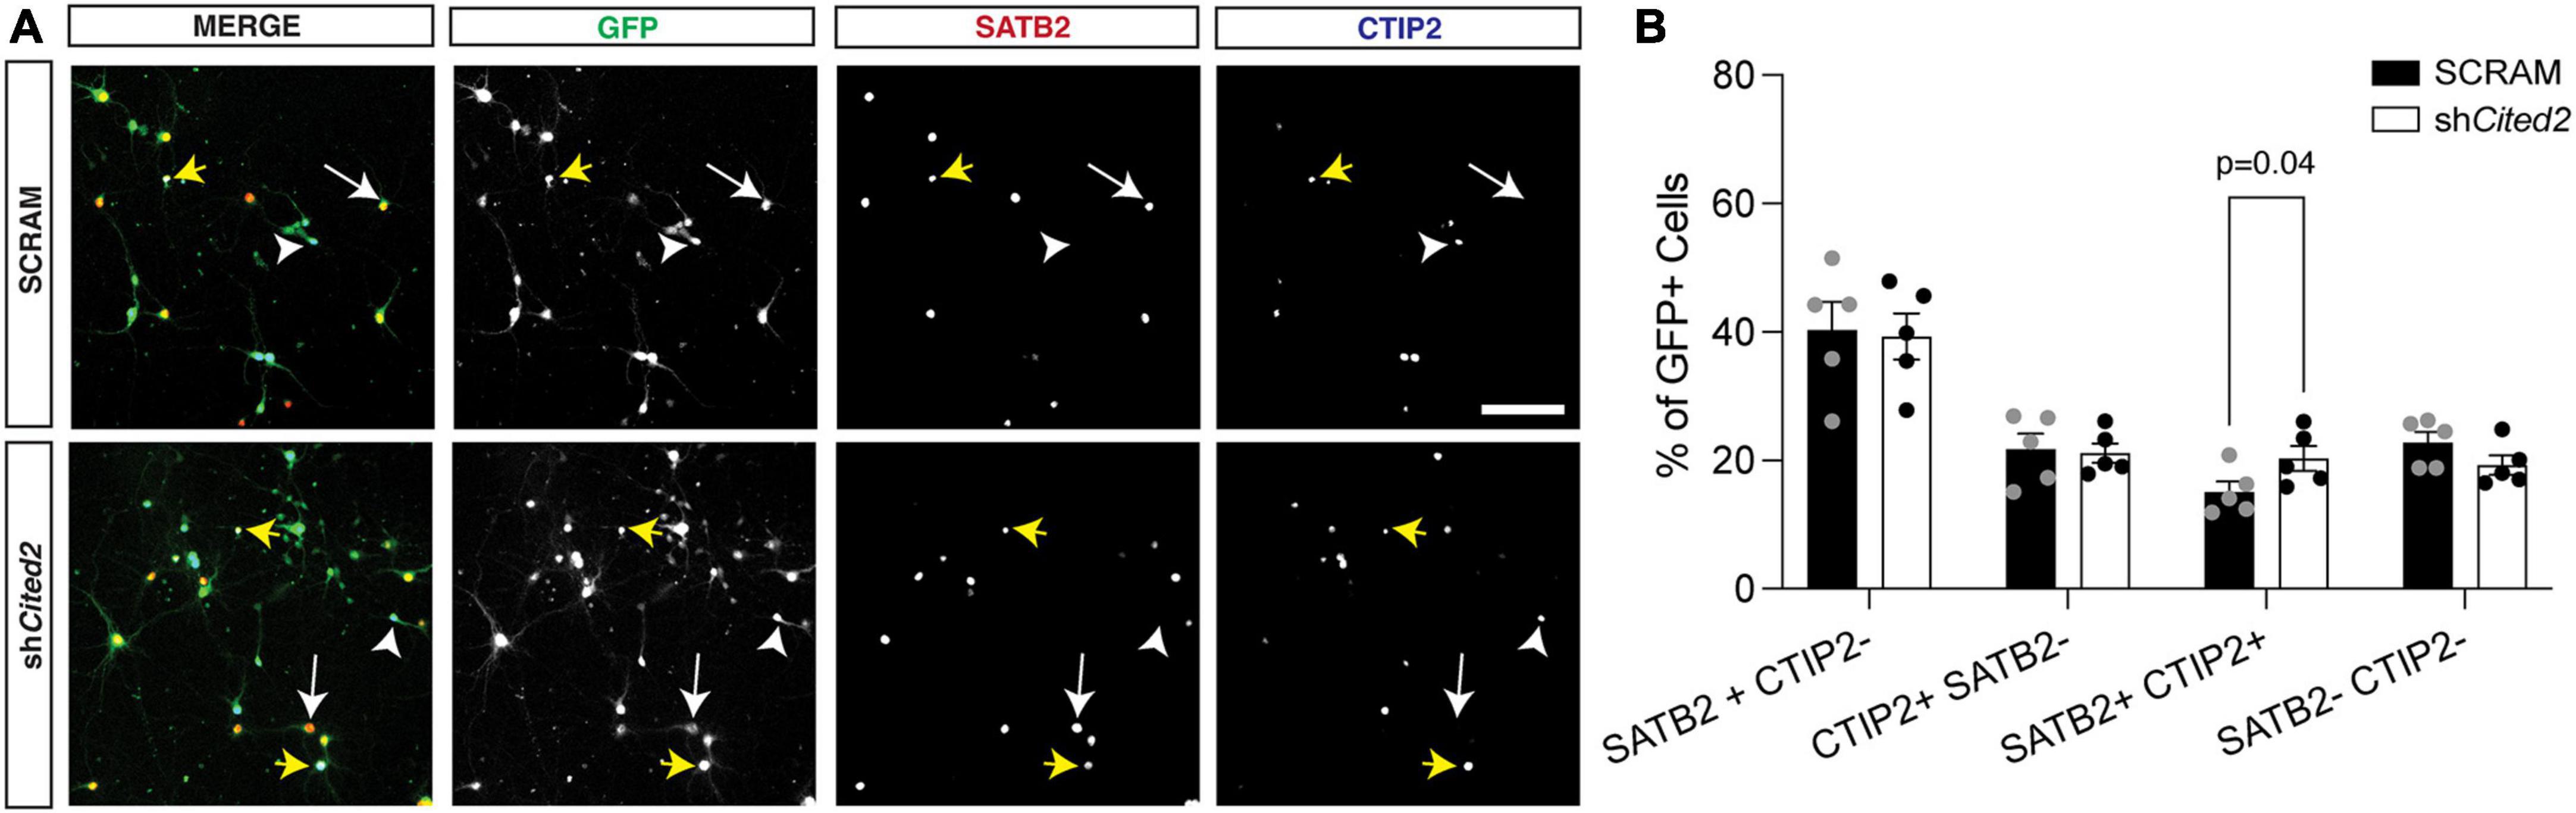
Cited2 loss-of-function phenocopies miR-409-3p gain-of-function, promoting callosal and repressing corticospinal projection neuron identityOur previous work demonstrated that overexpression GOF of miR-409-3p promotes corticospinal projection neuron identity in primary culture, in part via repression of Lmo4 (Diaz et al., 2020). Because we suspected Cited2 was also involved in this process, we assessed the effects of Cited2 LOF on the percent corticospinal projection neurons relative to callosal projection neurons, hypothesizing that Cited2 LOF would mimic phenotypes of miR-409-3p GOF. To evaluate effects of Cited2 LOF on neuronal identity, e14.5 neocortical cultures were transfected with either a control scrambled shRNA (SCRAM) or an shRNA targeting Cited2 (shCited2) and cultured for 7 days. Knockdown efficiency was assessed by RT-qPCR; there was an approximate 50% knockdown of Cited2 across all cells in the culture (Supplementary Figure 1B), which aligns with the approximate 50% transfection efficiency. Cells were fixed and analyzed for neuronal subtype identity markers via immunohistochemistry. GFP + transfected cells were identified as SATB2 + CTIP2- (callosal projection neurons), SATB2- CTIP2 + (corticospinal motor neurons), or SATB2 + CTIP2 + (a subclass of developing corticospinal projection neurons) (Figure 3A). We find that Cited2 LOF generates a significant increase in the percent of SATB2 + CTIP2 + co-labeled cells (Figure 3B) in a cell-autonomous manner, mirroring the overall increase in CTIP2 + cells observed with miR-409-3p GOF.
FIGURE 3
Figure 3. shRNA-mediated Cited2 knockdown leads to an increase in neurons that co-express SATB2 and CTIP2 in vitro. (A) Representative micrographs of 7 DIV primary neuronal cultures electroporated with a control SCRAM or shCited2. Arrows indicate SATB2 + CTIP2- neurons (white arrow), CTIP2 + SATB2- neurons (white arrow head), and SATB2 + CTIP2 + co-expressing neurons (yellow arrows). (B) Quantification of transfected cells shows an increased percentage of SATB2 + CTIP2 + co-expressing neurons in shCited2 vs SCRAM. N = 5. Two-way ANOVA with Šídák’s multiple comparisons test. Error bars denote SEM. Scale bar, 100 μm.
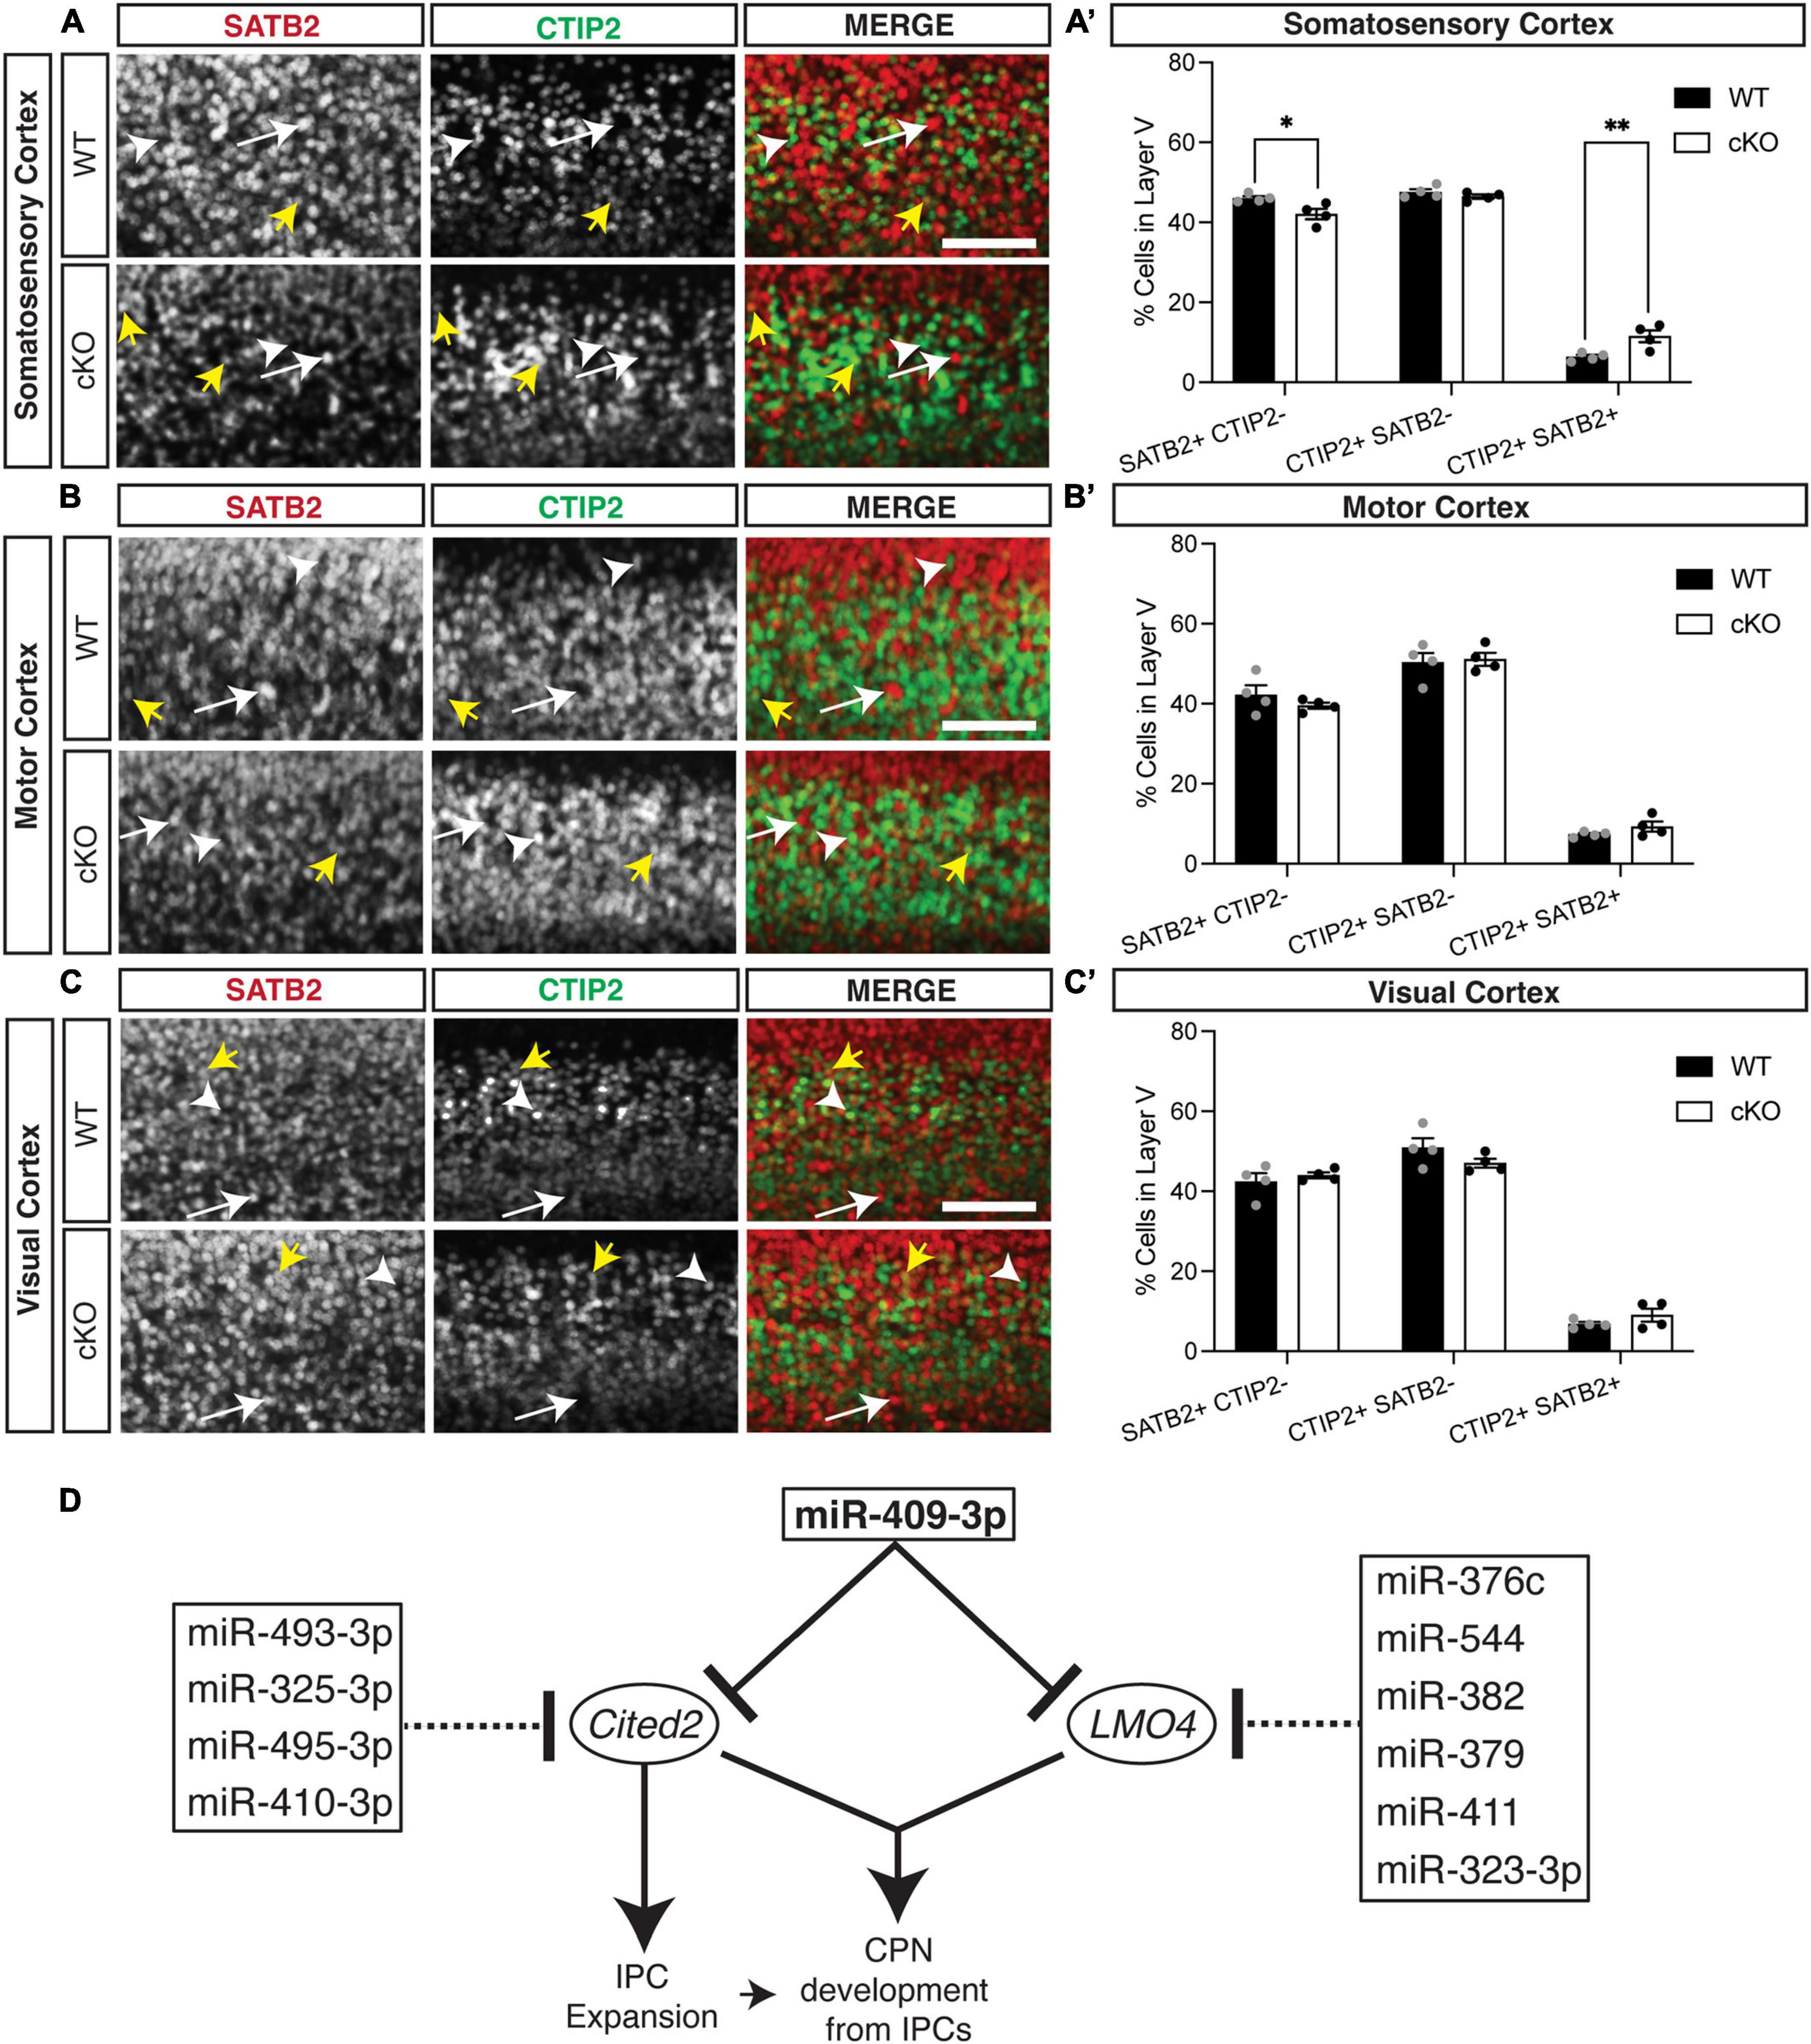
We also found previously that overexpression GOF of miR-409-3p (via in utero electroporation) promotes corticospinal projection neuron identity in vivo at e18.5 (Diaz et al., 2020). To determine if Cited2 LOF phenocopies miR-409-3p GOF in vivo, we generated Emx1-Cre mediated forebrain-specific Cited2 cKO mice, as previously described (Fame et al., 2016). We found that, at e18.5, Cited2 LOF increases SATB2 + /CTIP2 + co-expressing cells, at the expense of deep-layer callosal projection neurons (Figure 4). This change is specific to the somatosensory cortex (Figures 4A,A′), where Cited2 expression is maintained in the postmitotic neurons during neocortical arealization (Fame et al., 2016). Significant differences in the relative number of SATB2 + /CTIP2 + co-expressing cells are not observed in motor (Figures 4B,B′) or visual (Figures 4C,C′) cortices, where Lmo4 is expressed. Taken together, our results suggest that miR-409-3p and Cited2 exert opposing effects on corticospinal and callosal projection neuron development and support our model in which miR-409-3p represses Cited2 to favor corticospinal over callosal fate.
FIGURE 4
Figure 4. Cited2 loss-of-function increases co-expressing SATB2 and CTIP2 cells at the expense of callosal projection neurons in layer V of the e18.5 developing somatosensory cortex. (A,A′) Conditional loss of Cited2 generates fewer SATB2 + CTIP2- (white arrow) neurons and more SATB2 + CTIP2 + co-expressing neurons (yellow arrows) in layer V of the somatosensory region without altering the population of CTIP2 + SATB2- neurons (white arrow head). These differences were not observed in the developing motor region (B,B′) or visual region (C,C′). n = 4. *p < 0.05; **p < 0.01 (Two-way ANOVA with Šídák’s multiple comparisons test). Error bars denote SEM. Scale bars = 100 μm. (D) Schematic of the cooperative and multi-target repression of the Cited2-Lmo4 pathway for callosal projection neuron development by the corticospinal-expressed miRNAs of the Mirg/12qF1 cluster. miR-409-3p represses the interacting, callosal-expressed genes Cited2 and Lmo4 during cortical projection neuron development. Four corticospinal-enriched Mirg/12qF1 cluster miRNAs, in addition to miR-409-3p, are predicted to cooperatively repress Cited2. Six other corticospinal-enriched Mirg/12qF1 cluster miRNAs, in addition to miR-409-3p, are predicted to cooperatively repress Lmo4.
DiscussionCorticospinal and deep layer callosal projection neurons arise from the same pool of progenitors at the same time, but they go on to adopt completely different fates in support of completely different behaviors. The key, and broadly conserved, transcriptional regulators controlling cortical projection neuron fate, while critical, wholly account for neither the narrower evolutionary conservation of the corticospinal and callosal projections, nor for their own regulation of expression. We have previously shown that a cluster of miRNAs unique to placental mammals (Mirg/12qF1) is expressed by corticospinal projection neurons but not callosal projection neurons during their development, and that one of these miRNAs, miR-409-3p, can shape corticospinal over callosal projection neuron fate, acting in part via repression of the callosal-expressed transcriptional regulator LMO4. While our findings suggested additional targets for miR-409-3p and other miRNAs in the cluster, these were until now unknown. Here we show that miR-409-3p also targets the callosal-expressed, and Lmo4-interacting, transcriptional regulator Cited2 in cortical projection neuron progenitors. Furthermore, we define previously undescribed roles for miR-409-3p in controlling IPC numbers and for Cited2 in promoting callosal projection neuron fate.
The importance of non-coding RNAs, including miRNA, to neocortical expansion and evolution is emerging, with miRNA having been shown to play key roles in regulating multiple aspects of neurogenesis (Liu et al., 2021; Prodromidou and Matsas, 2021). Because Cited2 is required for IPC expansion, the miR-409-3p/Cited2 interaction led us to investigate a possible role for miR-409-3p in IPCs. Cited2 is expressed by e15.5 IPCs while miR-409-3p is excluded from these progenitors (Figure 1D), as would be expected if miR-409-3p represses Cited2. miR-409-3p GOF decreases the percent TBR2 + IPCs in primary embryonic cortical cultures (Figures 2A,B), a phenocopy of Cited2 LOF in vivo (Fame et al., 2016), further supporting a functional role for miR-409-3p repressing Cited2. However, in vivo analyses of miR-409-3p GOF will be necessary to determine whether there are temporal restrictions on this refinement.
miRNAs have previously been implicated in the production of cortical progenitors (Shibata et al., 2008, 2011; Gaughwin et al., 2011; Sun et al., 2011; Clovis et al., 2012; Dajas-Bailador et al., 2012; Nigro et al., 2012; Bian et al., 2013; Nowakowski et al., 2013; Zhao et al., 2013; Chen et al., 2014; Fei et al., 2014; Lv et al., 2014; Pollen et al., 2014; Pollock et al., 2014; Shin et al., 2014; Abdullah et al., 2016; Fededa et al., 2016; Zhang et al., 2016) and specifically in the proliferation of IPCs and expansion of layer 2/3 neuron generation (Tomasello et al., 2022), which are both disrupted in the Cited2 cKO (Fame et al., 2016). However, no role for miR-409-3p in this process was known, and none of the previously described miRNAs have been shown to target Cited2. Our findings therefore provide a link between the role for miRNAs in IPC expansion and a transcriptional regulator known to control this process.
Beyond its role in IPC expansion, Cited2 is required for the generation of superficial layer callosal projection neurons (Fame et al., 2016). However, its role in promoting deep layer callosal projection neuron development over corticospinal motor neuron development was previously unknown. In sensory cortex, our in vivo LOF findings demonstrate that Cited2 promotes callosal projection neuron fate at the expense of corticospinal fate (Figures 4A,A′). Our in vitro data demonstrate that Cited2 LOF alters this fate in a cell-autonomous manner (Figure 3). These findings support a broad role for Cited2 in promoting callosal projection neuron development, from IPC to deep layer to superficial layer callosal projection neurons. They also further support our previously published model that miRNA repression of transcription factors that promote callosal fate in corticospinal projection neurons contributed to the evolutionary emergence of layer V projections to the corpus callosum and corticospinal tract (Diaz et al., 2020).
The refinement of neuronal cell fate within layer V is multi-faceted, combining molecular regulation at multiple levels in both progenitors and post-mitotic neurons. Although SATB2 and CTIP2 are critical regulators of distinct neuronal lineages, and SATB2 represses CTIP2 (Alcamo et al., 2008; Britanova et al., 2008), they co-localize in a subset of developing projection neurons (Leone et al., 2008; Azim et al., 2009; Baranek et al., 2012; Harb et al., 2016). This co-localization has been posited to represent a developmental stage preceding fate refinement, with LMO4 essential for this delineation (Azim et al., 2009; Leone et al., 2015). However, double CTIP2/SATB2 expressing cells have also been posited to be a distinct neuronal subpopulation(s), which increase in abundance postnatally, particularly in the somatosensory cortex (Harb et al., 2016). We also noted the greatest abundance of CTIP2/SATB2 double expressing cells in the somatosensory cortex (Figure 4) in the Cited2 cKO. However, as expression of Cited2 becomes restricted to the somatosensory cortex, this likely represents the increased impact of Cited2 loss-of-function on refinement of neuronal identity within the somatosensory cortex. To confirm the neuronal identity of the increased CTIP2/SATB2 double expressing cells within the Cited2 cKO, however, it will be important to examine their axonal projections and assess additional neuronal cell type specific genes across additional timepoints.
Clustered miRNAs are known to cooperatively repress interacting genes within a pathway (Olena and Patton, 2010). Lmo4 and Cited2 appear to belong to such a pathway. The two genes have been shown to interact genetically during thymus development, including partial functional compensation for Cited2 LOF by Lmo4 in this system (Michell et al., 2010). In the developing cortex, Cited2 and Lmo4 appear to play region-specific roles in sculpting the areal identity of superficial layer callosal projection neurons in somatosensory and motor cortex, respectively (Fame et al., 2016). We have demonstrated that the Mirg/12qF1 miRNA miR-409-3p represses Lmo4 (Diaz et al., 2020) and Cited2 (Figure 1B). Bioinformatic analyses and work by other groups suggests that multiple other miRNAs from the Mirg/12qF1 cluster also target Lmo4 or Cited2 (Figure 4D).
Clustered miRNAs are also known to cooperatively repress the same genes (Olena and Patton, 2010). It was previously shown that two other Mirg-encoded 12qF1 miRNAs, miR-410 and miR-495, repress Cited2 in cardiac myocytes during their development (Clark and Naya, 2015). Additionally, miR-495-3p has been shown to directly target Cited2 and inhibit cell proliferation in cartilage endplate tissue (Zhang et al., 2021). Our bioinformatic analyses have identified and two additional Mirg/12qF1 miRNAs, miR-493-3p and miR-325-3p, predicted to cooperatively repress Cited2. There is thus convergent evidence supporting a role for the Mirg-encoded miRNAs of the 12qF1 cluster in repressing the transcriptional regulator Cited2 during development. We propose a model whereby the clustered Mirg/12qF1 miRNAs cooperatively target the Cited2-Lmo4 callosal development pathway for repression in corticospinal projection neurons, contributing not only to refinement of deep layer projection neuron fate, but also possibly to the evolution of the callosal and corticospinal projections in placental mammals.
Data availability statementThe original contributions presented in this study are included in the article/Supplementary material, further inquiries can be directed to the corresponding authors.
Ethics statementThe animal study was reviewed and approved by the Syracuse University Institutional Animal Care and Use Committee.
Author contributionsJM, ST, NW, AS, and VS designed the research. NW, AS, AK, and VS performed the experiments. NW, AS, VS, AK, JM, and ST analyzed the data. JM and ST wrote the manuscript with contributions from all authors. All authors contributed to the article and approved the submitted version.
FundingThis work was supported by a Collaboration for Unprecedented Success and Excellence Grant (Syracuse University) with additional laboratory support provided by the National Institutes of Health/NINDS (1R01NS106285) to JM, and by grants from the NIH (K08 NS091531), AOSpine North America (Young Investigator Research Grant Award), a Stanford McCormick Faculty Award, and Stanford Maternal and Child Health Research Institute Pilot and Bridge Fund Awards to ST. Partial salary support to ST came from the Palo Alto Veterans Affairs Health Care System. ST is a Tashia and John Morgridge Endowed Faculty Scholar in Pediatric Translational Medicine of the Stanford Maternal and Child Health Research Institute, which supported this work.
AcknowledgmentsThe Cited2 flox transgenic mice were generously provided by Sally L. Dunwoodie at the Victor Chang Cardiac Research Institute (Darlinghurst, New South Wales, Australia).
Conflict of interestThe authors declare that the research was conducted in the absence of any commercial or financial relationships that could be construed as a potential conflict of interest.
Publisher’s noteAll claims expressed in this article are solely those of the authors and do not necessarily represent those of their affiliated organizations, or those of the publisher, the editors and the reviewers. Any product that may be evaluated in this article, or claim that may be made by its manufacturer, is not guaranteed or endorsed by the publisher.
Supplementary materialThe Supplementary Material for this article can be found online at: https://www.frontiersin.org/articles/10.3389/fnins.2022.931333/full#supplementary-material
ReferencesAbdullah, A. I., Zhang, H., Nie, Y., Tang, W., and Sun, T. (2016). CDK7 and miR-210 Co-regulate Cell-Cycle progression of neural progenitors in the developing neocortex. Stem Cell Rep. 7, 69–79. doi: 10.1016/j.stemcr.2016.06.005
PubMed Abstract | CrossRef Full Text | Google Scholar
Aboitiz, F., and Montiel, J. (2003). One hundred million years of interhemispheric communication: The history of the corpus callosum. Braz. J. Med. Biol. Res. 36, 409–420. doi: 10.1590/s0100-879x2003000400002
PubMed Abstract | CrossRef Full Text | Google Scholar
Alcamo, E. A., Chirivella, L., Dautzenberg, M., Dobreva, G., Farinas, I., Grosschedl, R., et al. (2008). Satb2 regulates callosal projection neuron identity in the developing cerebral cortex. Neuron 57, 364–377. doi: 10.1016/j.neuron.2007.12.012
PubMed Abstract | CrossRef Full Text | Google Scholar
Armand, J. (1982). The origin, course and terminations of corticospinal fibers in various mammals. Prog. Brain Res. 57, 329–360. doi: 10.1016/S0079-6123(08)64136-9
CrossRef Full Text | Google Scholar
Azim, E., Shnider, S. J., Cederquist, G. Y., Sohur, U. S., and Macklis, J. D. (2009). Lmo4 and Clim1 progressively delineate cortical projection neuron subtypes during development. Cereb. Cortex 19 Suppl 1, i62–i69. doi: 10.1093/cercor/bhp030
PubMed Abstract | CrossRef Full Text | Google Scholar
Baizabal, J. M., Mistry, M., Garcia, M. T., Gomez, N., Olukoya, O., Tran, D., et al. (2018). The epigenetic state of PRDM16-regulated enhancers in radial glia controls cortical neuron position. Neuron 98, 945–962e948. doi: 10.1016/j.neuron.2018.04.033
PubMed Abstract | CrossRef Full Text | Google Scholar
Baranek, C., Dittrich, M., Parthasarathy, S., Bonnon, C. G., Britanova, O., Lanshakov, D., et al. (2012). Protooncogene Ski cooperates with the chromatin-remodeling factor Satb2 in specifying callosal neurons. Proc. Natl. Acad. Sci. U.S.A. 109, 3546–3551. doi: 10.1073/pnas.1108718109
PubMed Abstract | CrossRef Full Text | Google Scholar
Beard, J. A., Tenga, A., Hills, J., Hoyer, J. D., Cherian, M. T., Wang, Y. D., et al. (2016). The orphan nuclear receptor NR4A2 is part of a p53-microRNA-34 network. Sci. Rep. 6:25108. doi: 10.1038/srep25108
PubMed Abstract | CrossRef Full Text | Google Scholar
Betel, D., Koppal, A., Agius, P., Sander, C., and Leslie, C. (2010). Comprehensive modeling of microRNA targets predicts functional non-conserved and non-canonical sites. Genome Biol. 11:R90. doi: 10.1186/gb-2010-11-8-r90
PubMed Abstract | CrossRef Full Text | Google Scholar
Betel, D., Wilson, M., Gabow, A., Marks, D. S., and Sander, C. (2008). The resource: Targets and expression. Nucleic Acids Res. 36, D149–D153. doi: 10.1093/nar/gkm995
PubMed Abstract | CrossRef Full Text | Google Scholar
Bian, S., Hong, J., Li, Q., Schebelle, L., Pollock, A., Knauss, J. L., et al. (2013). MicroRNA cluster miR-17-92 regulates neural stem cell expansion and transition to intermediate progenitors in the developing mouse neocortex. Cell Rep. 3, 1398–1406. doi: 10.1016/j.celrep.2013.03.037
PubMed Abstract | CrossRef Full Text | Google Scholar
Britanova, O., de Juan Romero, C., Cheung, A., Kwan, K. Y., Schwark, M., Gyorgy, A., et al. (2008). Satb2 is a postmitotic determinant for upper-layer neuron specification in the neocortex. Neuron 57, 378–392. doi: 10.1016/j.neuron.2007.12.028
PubMed Abstract | CrossRef Full Text | Google Scholar
Chen, Y., Bian, S., Zhang, J., Zhang, H., Tang, B., and Sun, T. (2014). The silencing effect of microRNA miR-17 on p21 maintains the neural progenitor pool in the developing cerebral cortex. Front. Neurol. 5:132. doi: 10.3389/fneur.2014.00132
PubMed Abstract | CrossRef Full Text | Google Scholar
Clark, A. L., and Naya, F. J. (2015). MicroRNAs in the Myocyte Enhancer Factor 2 (MEF2)-regulated Gtl2-Dio3 Noncoding RNA locus promote cardiomyocyte proliferation by targeting the transcriptional coactivator cited2. J. Biol. Chem. 290, 23162–23172. doi: 10.1074/jbc.M115.672659
PubMed Abstract | CrossRef Full Text | Google Scholar
Clovis, Y. M., Enard, W., Marinaro, F., Huttner, W. B., and De Pietri Tonelli, D. (2012). Convergent repression of Foxp2 3′UTR by miR-9 and miR-132 in embryonic mouse neocortex: Implications for radial migration of neurons. Development 139, 3332–3342. doi: 10.1242/dev.078063
PubMed Abstract | CrossRef Full Text | Google Scholar
Dajas-Bailador, F., Bonev, B., Garcez, P., Stanley, P., Guillemot, F., and Papalopulu, N. (2012). microRNA-9 regulates axon extension and branching by targeting Map1b in mouse cortical neurons. Nat. Neurosci. 15, 697–699. doi: 10.1038/nn.3082
PubMed Abstract | CrossRef Full Text | Google Scholar
Diaz, J. L., Siththanandan, V. B., Lu, V., Gonzalez-Nava, N., Pasquina, L., MacDonald, J. L., et al. (2020). An evolutionarily acquired microRNA shapes development of mammalian cortical projections. Proc. Natl. Acad. Sci. U.S.A 117, 29113–29122. doi: 10.1073/pnas.2006700117
PubMed Abstract | CrossRef Full Text | Google Scholar
Diez-Roux, G., Banfi, S., Sultan, M., Geffers, L., Anand, S., Rozado, D., et al. (2011). A high-resolution anatomical atlas of the transcriptome in the mouse embryo. PLoS Biol. 9:e1000582. doi: 10.1371/journal.pbio.100058
CrossRef Full Text | Google Scholar
Enright, A. J., John, B., Gaul, U., Tuschl, T., Sander, C., and Marks, D. S. (2003). MicroRNA targets in Drosophila. Genome Biol. 5:R1. doi: 10.1186/gb-2003-5-1-r1
PubMed Abstract | CrossRef Full Text | Google Scholar
Fame, R. M., Dehay, C., Kennedy, H., and Macklis, J. D. (2017). Subtype-specific genes that characterize subpopulations of callosal projection neurons in mouse identify molecularly homologous populations in macaque cortex. Cereb. Cortex 27, 1817–1830. doi: 10.1093/cercor/bhw023
PubMed Abstract | CrossRef Full Text | Google Scholar
Fame, R. M., MacDonald, J. L., and Macklis, J. D. (2011). Development, specification, and diversity of callosal projection neurons. Trends Neurosci. 34, 41–50. doi: 10.1016/j.tins.2010.10.002
PubMed Abstract | CrossRef Full Text | Google Scholar
Fame, R. M., MacDonald, J. L., Dunwoodie, S. L., Takahashi, E., and Macklis, J. D. (2016). Cited2 regulates neocortical layer II/III generation and somatosensory callosal projection neuron development and connectivity. J Neurosci. 36, 6403–6419. doi: 10.1523/JNEUROSCI.4067-15.2016
PubMed Abstract | CrossRef Full Text | Google Scholar
Fededa, J. P., Esk, C., Mierzwa, B., Stanyte, R., Yuan, S., Zheng, H., et al. (
留言 (0)