
記住我

Nonalcoholic fatty liver disease (NAFLD) is one of the common chronic hepatic diseases worldwide, prevalence accounting for 32.9% in China due to lifestyle modification and economic boom [1]. The disease spectrum of NAFLD extends from hepatic steatosis to nonalcoholic steatohepatitis (NASH), and may progress to advanced fibrosis, cirrhosis and hepatocellular carcinoma (HCC). A US population-based study revealed that NAFLD is one commonly etiology (59%) for HCC, and NASH is the main cause of liver transplantation [2,3]. Thus, NAFLD-related end-stage liver diseases (ESLDs) and its mortality will substantially increase the disease burden.
Biomarkers in peripheral blood are considered widely accepted and convenient markers for monitoring disease development. Neutrophil-to-lymphocyte ratio (NLR) and platelet-to-lymphocyte ratio (PLR) are used as indicators of inflammatory index in many chronic diseases, which can reflect inflammatory reactions and immune response. They are related to the morbidity and mortality of various chronic diseases, such as hepatic echinococcosis [4], chronic hepatitis B infection [5] and chronic obstructive pulmonary disease [6], and also used as new prognostic indicators in various malignant tumors, including HCC [7], gastric cancer [8] and colorectal cancer [9].
NAFLD is characterized by excessive lipid molecules accumulation in hepatocytes, while toxic lipid molecules contribute to inflammatory recruitment and cause hepatocyte injury [10]. The long-term presence of chronic inflammation promotes disease progression and increases the risk of NAFLD-related ESLDs. Previous studies reported that patients with NAFLD have increased levels of inflammatory biomarkers, such as interleukin 6 (IL-6) [11] and high-sensitivity C-reactive protein [12]. As inflammatory markers, NLR and PLR have also been garnering attention recently. Meng et al. [13] found that NLR and PLR were associated with the severity of HCV-infected disease, and PLR was superior to NLR for the disease surveillance. Another study about chronic hepatitis B virus (HBV) infection patients indicated that NLR and PLR were significantly correlated with the levels of serum HBV-DNA and HBeAg [5]. However, the possible role of these two parameters in NAFLD were poorly understood. Therefore, the purpose of this cross-sectional study was to investigate the correlation between NLR and PLR with NAFLD.
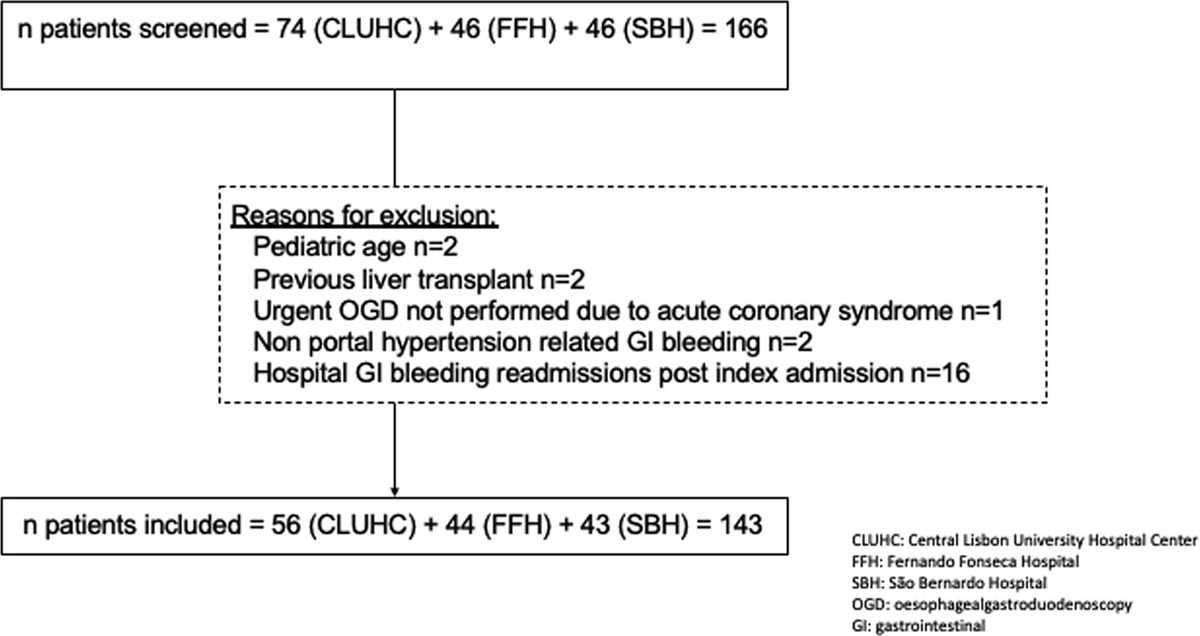
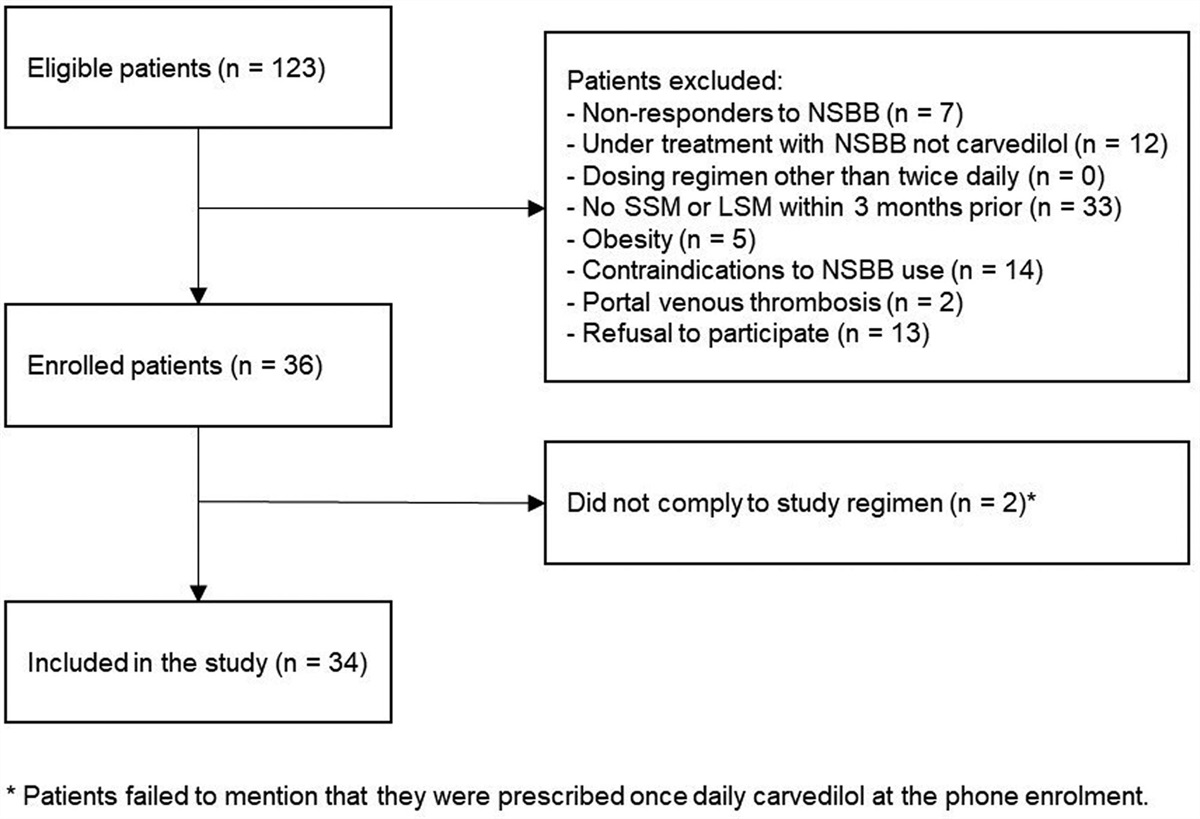
Methods Research subjectsThe study was designed as a retrospective cross-sectional study. A total of 4656 participants enrolled in this study were residents living in Foshan City, Guangdong Province, China, undergoing medical check-ups at the health management center of the Guangdong Province Hospital of Integrated Traditional Chinese and Western Medicine between January 2020 and December 2020. The medical check-ups included the measurement of basic clinical (height, weight, blood glucose), biochemical tests (routine blood tests, hepatic function, renal function), and imaging tests (abdominal ultrasonography). Exclusion criteria were as follows: (1) history of alcohol consumption, alcohol intake more than 30 g (for men) or 20 g (for women) for one day; (2) history of viral hepatitis, auto-immune hepatitis, drug-induced liver injury or other forms of chronic liver disease; (3) history of hematological diseases; (4) history of severe renal insufficiency; (5) insufficient clinical data. After applying the exclusion criteria, 4498 participants’ data were included for the analysis (Fig. 1). All subjects were classified into two groups depending on the presence or absence of NAFLD by abdominal ultrasonography: the Non-NAFLD group and the NAFLD group.
 Fig. 1.:
 Flow chart of participant selection.
MeasurementAll subjects were assessed after an overnight fasting for at least 8 h. Height and weight were measured in light clothing and no shoes. BMI was calculated by dividing weight in kilograms by the square of height in meters. Peripheral venous blood was collected from the cubital vein by an experienced nurse. Biochemical blood parameters including alanine aminotransferase (ALT), aspartate aminotransferase (AST), γ-glutamyl transpeptidase (γ-GT), triglyceride (TG), total cholesterol (TC), low-density lipoprotein (LDL), high-density lipoprotein (HDL) and uric acid (UA) were measured with the Olympus AU-640 autoanalyzer (Olympus, Japan). Blood glucose was measured with the glucose oxidase method. Routine blood examination was measured using the Sysmex 2100 whole blood cell analyser (Sysmex, Japan). NLR was defined by dividing absolute neutrophil by lymphocyte counts. PLR was calculated by division of platelet and lymphocyte counts accordingly. NAFLD was determined by abdominal ultrasonography using the ACUSON X150 ultrasound system (Siemens, Japan).
Ethics and consentThe Ethics Committee of Guangdong Province Hospital of Integrated Traditional Chinese and Western Medicine approved this study (Ethical number: 2019-0218). No informed consent from participants was required because this was a retrospective observational study.
Definition of nonalcoholic fatty liver diseaseAbdominal ultrasonic examination was performed on all participants by a trained ultrasound physician who was blinded to the clinical data. Diagnosis of hepatic steatosis was determined by the presence of at least two abnormal findings on abdominal ultrasonography [14,15]: (1) diffusely increased echogenicity liver greater than kidney or spleen; (2) occurrence of posterior beam attenuation; (3) loss of the portal vein wall echogenicity. NAFLD was diagnosed by abdominal ultrasonography after excluding alcohol abuse and other hepatic diseases.
Statistical analysisStatistical analyses were conducted with the use of the SPSS (version 23.0, IBM, USA) and EmpowerStats (http://www.empowerstats.com, X&Y Solutions, Inc. Boston MA) software. Baseline characteristics were expressed as means ± SD for continuous variables and frequency with a percentage for categorical variables. Differences among variables were tested using t-tests, Wilcoxon rank sum tests, Chi-square tests or Fisher’s exact tests. Univariate and multivariate logistic regression models were conducted to evaluate the correlation between variables and NAFLD. In addition, multivariate piecewise linear regression models were applied to examine the threshold effect of NLR and PLR on NAFLD by smooth curve fitting. P-value < 0.05 (two-tailed) was considered statistically significant.
Results The demographic characteristics and biochemical data of the study participantsOverall, 4498 participants were included in the analysis. The demographic characteristics and baseline biochemical data were listed in Table 1. The participants were divided into two groups: Non-NAFLD group and NAFLD group. The total incidence of NAFLD was 24.12% (1085/4498). The mean age of the Non-NAFLD group was 39.56 ± 12.31 years, and the NAFLD group was 44.76 ± 11.64 years. Participants from the NAFLD group had higher levels of BMI, ALT, AST, γ-GT, TG, TC, LDL, UA and GLU than in those without NAFLD (all P < 0.001). However, serum levels of HDL were significantly lower in participants with NAFLD compared to those without NAFLD (P < 0.001). In addition, the levels of NE and LYM in the NAFLD group were significantly higher than in the Non-NAFLD group, while PLR in the NAFLD group were significantly lower than in the Non-NAFLD group (all P < 0.001). However, there was no statistically difference in terms of NLR and PLT between the two groups (P > 0.05).
Table 1. - Baseline characteristics of participants Variable Non-NAFLD NAFLD P-value N 3413 1085 - Age (years) 39.56 ± 12.31 44.76 ± 11.64 <0.001 Gender (male, %) 1482 (43.42%) 809 (74.56%) <0.001 BMI (kg/m2) 23.11 ± 2.16 24.70 ± 2.30 <0.001 ALT (U/L) 21.20 ± 15.79 33.69 ± 21.78 <0.001 AST (U/L) 19.91 ± 9.86 22.68 ± 9.25 <0.001 γ-GT (U/L) 25.75 ± 25.71 45.05 ± 36.99 <0.001 TG (mmol/L) 1.25 ± 0.79 2.20 ± 1.54 <0.001 TC (mmol/L) 5.45 ± 1.02 5.90 ± 1.11 <0.001 HDL (mmol/L) 1.58 ± 0.28 1.41 ± 0.24 <0.001 LDL (mmol/L) 3.10 ± 0.72 3.48 ± 0.82 <0.001 UA (μmol/L) 337.12 ± 88.99 418.03 ± 101.86 <0.001 GLU (mmol/L) 5.08 ± 0.50 5.45 ± 0.73 <0.001 NE (×109/L) 3.62 ± 1.19 3.99 ± 1.20 <0.001 PLT (×109/L) 245.80 ± 52.76 247.34 ± 51.63 0.399 LYM (×109/L) 2.22 ± 0.59 2.46 ± 0.68 <0.001 NLR 1.72 ± 0.69 1.71 ± 0.63 0.761 PLR 74.00 ± 26.47 66.20 ± 20.82 <0.001ALT, alanine aminotransferase; AST, aspartate aminotransferase; GLU, glucose; γ-GT, γ-glutamyl transpeptidase; HDL, high-density lipoprotein; LDL, low-density lipoprotein; LYM, lymphocyte; NAFLD, nonalcoholic fatty liver disease; NE, neutrophilic granulocyte; NLR, neutrophil-to-lymphocyte ratio; PLT, platelet; PLR, platelet-to-lymphocyte ratio; TG, triglyceride; TC, total cholesterol; UA, uric acid.
Univariate analysis model was used to evaluate the correlations between exposure factors and NAFLD (Table 2). The results showed that age, BMI, ALT, γ-GT, TG, TC, LDL, UA, GLU, NE and LYM were positively correlated with NAFLD, whereas female, AST, HDL and PLR were negatively correlated with NAFLD (all P < 0.001). However, PLT and NLR were not significantly associated with NAFLD (P > 0.05).
Table 2. - Correlations between exposure factors and nonalcoholic fatty liver disease Exposure Statistic OR (95% CI) P-value Age (years) 40.81 ± 12.35 1.03 (1.03, 1.04) <0.001 Gender <0.001 Male 2291 (50.93%) 1 Female 2207 (49.07%) 0.26 (0.23, 0.31) BMI (kg/m2) 23.50 ± 2.29 1.51 (1.44, 1.58) <0.001 ALT (U/L) 24.22 ± 18.22 1.06 (1.05, 1.07) <0.001 AST (U/L) 20.58 ± 9.78 0.94 (0.93, 0.96) <0.001 γ-GT (U/L) 30.40 ± 29.99 1.03 (1.03, 1.03) <0.001 TG (mmol/L) 1.48 ± 1.10 2.86 (2.60, 3.14) <0.001 TC (mmol/L) 5.56 ± 1.06 1.48 (1.38, 1.57) <0.001 HDL (mmol/L) 1.54 ± 0.28 0.07 (0.05, 0.09) <0.001 LDL (mmol/L) 3.19 ± 0.77 1.90 (1.74, 2.09) <0.001 UA (μmol/L) 356.63 ± 98.53 1.01 (1.09, 1.01) <0.001 GLU (mmol/L) 5.17 ± 0.58 2.88 (2.54, 3.27) <0.001 NE (×109/L) 3.71 ± 1.20 1.28 (1.21, 1.35) <0.001 PLT (×109/L) 246.17 ± 52.49 1.00 (0.10, 1.00) 0.391 LYM (×109/L) 2.27 ± 0.62 1.83 (1.64, 2.04) <0.001 NLR 1.72 ± 0.67 0.99 (0.89, 1.09) 0.764 PLR 72.12 ± 25.44 0.99 (0.98, 0.99) <0.001ALT, alanine aminotransferase; AST, aspartate aminotransferase; CI, confidence interval; GLU, glucose; γ-GT, γ-glutamyl transpeptidase; HDL, high-density lipoprotein; LDL, low-density lipoprotein; LYM, lymphocyte; NAFLD, nonalcoholic fatty liver disease; NE, neutrophilic granulocyte; NLR, neutrophil-to-lymphocyte ratio; OR, odds ratio; PLT, platelet; PLR, platelet-to-lymphocyte ratio; TG, triglyceride; TC, total cholesterol; UA, uric acid.
Multiple logistic regression model used to investigate the association between NLR, PLR and NAFLD. Nonadjusted and adjusted models were shown in Tables 3 and 4. For NLR, there was no correlation between NLR and NAFLD in model 1 to model 3 (All P > 0.05). For further sensitivity analysis, we also treated NLR as a categorical variable, and also found nonassociation between NRL and NAFLD in model 1 to model 3 (All P > 0.05). PLR, in model 1 (unadjusted model), showed negative association with NAFLD (OR = 0.99, 95% CI: 0.98~0.99, P < 0.001). In addition, negative association was also observed in model 2 (adjusted for age and gender) between PLR and NAFLD (OR = 0.99, 95% CI: 0.99~0.10, P < 0.001). However, in model 3 (fully adjusted model), there was no correlation between PLR and NAFLD. In addition, while PLR as a categorical variable, there was positive association between PLR and NAFLD in model 1 to model 2 (all P < 0.001). However, no association was detected between PRL and NAFLD in model 3 (P > 0.05).
Table 3. - Relationship between neutrophil-to-lymphocyte ratio and nonalcoholic fatty liver disease in different models Variable Model 1 P-value Model 2 P-value Model 3 P-value OR (95% CI) OR (95% CI) OR (95% CI) NLR 0.99 (0.89, 1.09) 0.764 0.99 (0.89, 1.10) 0.839 0.93 (0.82, 1.06) 0.305 NLR (trisection) <1.40 1 1 1 1 1.4~1.84 0.92 (0.78, 1.09) 0.341 0.92 (0.77, 1.10) 0.351 1.02 (0.83, 1.26) 0.840 >1.84 0.99 (0.84, 1.17) 0.915 1.04 (0.87, 1.23) 0.703 1.10 (0.90, 1.35) 0.368Model 1 was adjusted for: none.
Model 2 was adjusted for: gender, age.
Model 3 was adjusted for: gender, age, BMI, ALT, AST, γ-GT, TG, TC, HDL, LDL, UA, GLU, NE, PLT, LYM, and PLR.
ALT, alanine aminotransferase; AST, aspartate aminotransferase; CI, confidence interval; GLU, glucose; γ-GT, γ-glutamyl transpeptidase; HDL, high-density lipoprotein; LDL, low-density lipoprotein; LYM, lymphocyte; NAFLD, nonalcoholic fatty liver disease; NE, neutrophilic granulocyte; NLR, neutrophil-to-lymphocyte ratio; OR, odds ratio; PLT, platelet; PLR, platelet-to-lymphocyte ratio; TG, triglyceride; TC, total cholesterol; UA, uric acid.
Model 1 was adjusted for: none.
Model 2 was adjusted for: gender, age.
Model 3 was adjusted for: gender, age, BMI, ALT, AST, γ-GT, TG, TC, HDL, LDL, UA, GLU, NE, PLT, LYM and NLR.
Since NLR and PLR were continuous variables, the nonlinear regression analysis was necessary. Nonlinear relationships of NLR and PLR with NAFLD were detected after adjusting for all confounding factors (Figs. 2 and 3). The two-piecewise linear regression model showed that the inflection point of NLR was 1.23. On the left side of the inflection point (NLR < 1.23), a positive correlation was detected between NLR and NAFLD (β = 2.35, 95% CI: 1.20~4.61, P = 0.013). However, no significant correlation between NLR and NAFLD on the right of inflection point was observed (β = 0.91, 95% CI: 0.80~1.03, P = 0.118) (Table 5). For PLR, the inflection point was calculated as 42.29. PLR was found to be negatively associated with NAFLD on the right side of the inflection point (β = 0.99, 95% CI: 0.98~0.99, P < 0.001). However, the association between PLR and NAFLD on the left of inflection point was not detected (β = 1.02, 95% CI: 0.99~1.06, P = 0.183) (Table 6).
Table 5. - The independent correlation between neutrophil-to-lymphocyte ratio and nonalcoholic fatty liver disease by multivariate piecewise linear regression Infection point of NLR Effect size (β) 95% CI P-value Lower Upper <1.23 2.35 1.20 4.61 0.013 ≧1.23 0.91 0.80 1.03 0.118Adjusting for gender, age, BMI, ALT, AST, γ-GT, TG, TC, HDL, LDL, UA, GLU, NE, PLT, LYM and PLR.
ALT, alanine aminotransferase; AST, aspartate aminotransferase; CI, confidence interval; GLU, glucose; γ-GT, γ-glutamyl transpeptidase; HDL, high-density lipoprotein; LDL, low-density lipoprotein; LYM, lymphocyte; NAFLD, nonalcoholic fatty liver disease; NE, neutrophilic granulocyte; NLR, neutrophil-to-lymphocyte ratio; OR, odds ratio; PLT, platelet; PLR, platelet-to-lymphocyte ratio; TG, triglyceride; TC, total cholesterol; UA, uric acid.
Adjusting for gender, age, BMI, ALT, AST, γ-GT, TG, TC, HDL, LDL, UA, GLU, NE, PLT, LYM and NLR.
ALT, alanine aminotransferase; AST, aspartate aminotransferase; CI, confidence interval; GLU, glucose; γ-GT, γ-glutamyl transpeptidase; HDL, high-density lipoprotein; LDL, low-density lipoprotein; LYM, lymphocyte; NAFLD, nonalcoholic fatty liver disease; NE, neutrophilic granulocyte; NLR, neutrophil-to-lymphocyte ratio; OR, odds ratio; PLT, platelet; PLR, platelet-to-lymphocyte ratio; TG, triglyceride; TC, total cholesterol; UA, uric acid.
 Fig. 2.:
 The relationship between NLR and NAFLD by smooth curve fitting. By two-piecewise linear regression model, the inflection point of NLR was 1.23. On the left side of the inflection point (NLR < 1.23), a positive correlation was detected between NLR and NAFLD. However, no significant correlation between NLR and NAFLD on the right of inflection point was observed. NAFLD, nonalcoholic fatty liver disease; NLR, neutrophil-to-lymphocyte ratio.
 Fig. 3.:
 The relationship between PLR and NAFLD by smooth curve fitting. By two-piecewise linear regression model, the inflection point of PLR was 42.29. PLR was found to be negatively associated with NAFLD on the right side of the inflection point (PLR ≧ 42.29). However, the association between PLR and NAFLD on the left of inflection point was not detected. NAFLD, nonalcoholic fatty liver disease; PLR, platelet-to-lymphocyte ratio.
DiscussionThe current study was to investigate the protective or negative effects of NLR and PLR on NAFLD among the Chinese population. According to the multiple logistic regression model (fully adjusted), NLR and PLR have no correlation with NAFLD. Interestingly, a two-stage change and one inflection point curvilinear relationship of NLR and PLR with NAFLD was detected by smooth curve fitting after adjusting for all variables, respectively. The different correlations of NLR and PLR on NAFLD were found on the two sides of the optimal cutoff point (NLR = 1.23, PLR = 42.29). On the left side of the inflection point, a positive correlation was detected between NLR and NAFLD (β = 2.35, 95% CI: 1.20~4.61, P = 0.013), and no significant correlation between both on the right of inflection point (β = 0.91, 95% CI: 0.80~1.03, P = 0.118). As for PLR, PLR was found to be negatively associated with NAFLD on the right side of the inflection point (β = 0.99, 95% CI: 0.98~0.99, P < 0.001), and the association was not detected on the left side of the inflection point (β = 1.02, 95% CI: 0.99~1.06, P =0.183).
NAFLD includes two distinct pathological conditions: non-alcoholic fatty liver (NAFL) and NASH, the latter is associated with a significantly increased risk of progression to ESLDs, including advanced liver fibrosis, cirrhosis and HCC. Liver biopsy is the gold standard for the assessment of NAFLD and the only procedure that reliably distinguishes NAFL and NASH [14]. However, it is an invasive procedure with high cost and risk of complications that many patients could be reluctant to undergo [16]. Thus, seeking a potentially simple, low-cost noninvasive evaluation is of crucial importance. Blood testing is widely used due to its simplicity, safety, convenience and economy.
The presence of neutrophils has been recognized in the hepatic inflammatory infiltrate of NAFLD. Oxidative stress and necrosis of hepatocytes cause the accumulation of neutrophils [17]. Our study resulted that the levels of NE in the NAFLD group were significantly higher than in the Non-NAFLD group. Animal studies also showed that the liver of high fat fed NAFLD mice contained a large amount of free cholesterol. H&E-stained liver section showed the macrophages and neutrophils aggregated around hepatocytes with macrosteatotic vacuoles [18].
There are several types of lymphocytes in the normal liver, including natural killer (NK) cells, T cells and NK T cells [19]. NK cells are directly involved in cell killing and regulating T cell response, which can be regulated by Kupffer cells (KCs) derived cytokines (IL-1, IL-18) to generate interferon-gamma (IFN-γ). Previous studies [20] showed that the increase of serum cholesterol level was associated with the enhancement of secretion function of circulating lymphocytes. Consistent with the studies, our result showed that participants from the NAFLD group had higher levels of TC and LYM than in those without NAFLD (P < 0.001). Conversely, statins could significantly reduce tumor necrosis factor-α (TNF- α), IFN- γ and IL-2 release from lymphocytes, which was an anti-inflammatory effect [20].
Traditionally, platelets were considered to play a pure role in maintaining hemostasis. The critical role of platelets in inflammation was growing recognition. Studies have demonstrated that platelets recognized surface receptors for pathogens and immune complexes that made them of crucial role in inflammation and immune responses. The combination of platelet P-selectin and leukocyte P-selectin ligand-1 forms aggregated between platelets and leukocytes, and formed a bridge between leukocytes and endothelium [21–23].
The presence of inflammation plays a vital role in the NAFLD pathogenesis and contributes to assessing the prognostic in NAFLD [24]. Hepatocyte injury plays a pivotal role in the recruitment of immune response involving toll-like receptors, KCs, lymphocytes, neutrophils and inflammasome. And the vital pro-inflammatory signaling pathways are nuclear factor-kappa B and c-Jun N-terminal kinase [10]. The inflammatory response induces an increasing count of neutrophil and platelet accompanied by a decreasing count of lymphocyte, which making their ratios indirectly a valuable tool for assessing the inflammatory status. NLR and PLR are considered as novel predictors for the diagnosis of liver disease and prognosis of different cancers [4,8,25]. Agata et al. [26] reported that AUC values and cut-offs for NLR and PLR in NAFLD patients were 0.725 (>2.034) and 0.528 (<97.101), respectively, and the hematological indices (NLR and PLR) seem to correlate with the model for end-stage liver disease (MELD) score. Besides, the study also described that NAFLD patients had a significantly higher NLR level in comparison to the controls. Moreover, another study [27] indicated that PLR was a parameter with inverse correlation with NAFLD in nonobese patients (effect –21.89, P < 0.001). This result was consistent with our study that PLR was negatively associated with NAFLD when PLR was more than 42.29 (β = 0.99, 95% CI: 0.98~0.99, P < 0.001).
Our findings suggested that the relationship between NLR and PLR with NAFLD was nonlinear, NLR was positively correlated with NAFLD when NLR was less than 1.23 (β = 2.35, 95% CI: 1.20~4.61, P = 0.013), and PLR was negatively associated with NAFLD when PLR was more than 42.29 (β = 0.99, 95% CI: 0.98~0.99, P < 0.001).
The main limitation of our study is the nature of single-center retrospective observational study, which may be affected by selection bias. In addition, epidemiological patterns indicate that lifestyle, economy and environment are critical factors in the progression of NAFLD, but data on them are not present for participants. What’s more, the data of liver biopsy or FibroScan were not available, which could distinguish the different stages of NAFLD disease severity, due to all subjects in our retrospective observational study were undergoing medical check-ups at the health management center. Therefore, we were unable to perform stratified analyses according to different stages of NAFLD disease severity. Furthermore, most of the participants in our study are Cantonese who live in Foshan City, which may result in limited generalizability.
ConclusionOur study showed a nonlinear relationship between NLR and PLR with NAFLD after adjusting for potential confounding factors. This finding suggested that PLR ≧ 42.29 might be a protective factor of NAFLD, while NLR < 1.23 might be a risk factor of NAFLD.
AcknowledgementsThe authors appreciate the participants in this study for their cooperation. We also thank the academic and nonacademic staff of Guangdong Provincial Hospital of Integrated Traditional Chinese and Western Medicine for their help. We are grateful to Professor Haiqiao Zhong for English polishing and corrections.
Data Availability: The data used to support the findings of the study can be made available upon request to the corresponding author.
Financial Support: Construction of clinical research methods and standardized innovation platform of Foshan Chinese medicine (FSOAA-KJ218-1301-0023). 2018 the Foshan Science and Technology Innovation Project (Medical Science and Technology Innovation Platform Construction Project). The funders had no role in study design, data collection and analysis, decision to publish, or preparation of the manuscript.
Conflicts of interestThere are conflicts of interest.
References 1. Zhou J, Zhou F, Wang W, Zhang XJ, Ji YX, Zhang P, et al. Epidemiological features of NAFLD from 1999 to 2018 in China. Hepatology 2020; 71:1851–1864. 2. Chalasani N, Younossi Z, Lavine JE, Charlton M, Cusi K, Rinella M, et al. The diagnosis and management of nonalcoholic fatty liver disease: practice guidance from the American Association for the Study of Liver Diseases. Hepatology 2018; 67:328–357. 3. Younossi Z, Stepanova M, Ong JP, Jacobson IM, Bugianesi E, Duseja A, et al.; Global Nonalcoholic Steatohepatitis Council. Nonalcoholic steatohepatitis is the fastest growing cause of hepatocellular carcinoma in liver transplant candidates. Clin Gastroenterol Hepatol 2019; 17:748–755.e3. 4. E W, Wang Z, Pang M, Lu Y, Fan H. The correlation between platelet-to-lymphocyte ratio and neutrophil-to-lymphocyte ratio with hepatic echinococcosis. J Inflamm Res 2021; 14:2403–2409. 5. Zhao Z, Liu J, Wang J, Xie T, Zhang Q, Feng S, et al. Platelet-to-lymphocyte ratio (PLR) and neutrophil-to-lymphocyte ratio (NLR) are associated with chronic hepatitis B virus (HBV) infection. Int Immunopharmacol 2017; 51:1–8. 6. El-Gazzar AG, Kamel MH, Elbahnasy OKM, El-Naggar ME. Prognostic value of platelet and neutrophil to lymphocyte ratio in COPD patients. Expert Rev Respir Med 2020; 14:111–116. 7. Zheng J, Cai J, Li H, Zeng K, He L, Fu H, et al. Neutrophil to lymphocyte ratio and platelet to lymphocyte ratio as prognostic predictors for hepatocellular carcinoma patients with various treatments: a meta-analysis and systematic review. Cell Physiol Biochem 2017; 44:967–981. 8. Fang T, Wang Y, Yin X, Zhai Z, Zhang Y, Yang Y, et al. Diagnostic sensitivity of NLR and PLR in early diagnosis of gastric cancer. J Immunol Res 2020; 2020:9146042. 9. Stojkovic Lalosevic M, Pavlovic Markovic A, Stankovic S, Stojkovic M, Dimitrijevic I, Radoman Vujacic I, et al. Combined diagnostic efficacy of neutrophil-to-lymphocyte ratio (NLR), platelet-to-lymphocyte ratio (PLR), and mean platelet volume (MPV) as biomarkers of systemic inflammation in the diagnosis of colorectal cancer. Dis Markers 2019; 2019:6036979. 10. Farrell GC, van Rooyen D, Gan L, Chitturi S. NASH is an inflammatory disorder: pathogenic, prognostic and therapeutic implications. Gut Liver 2012; 6:149–171. 11. Wieckowska A, Papouchado BG, Li Z, Lopez R, Zein NN, Feldstein AE. Increased hepatic and circulating interleukin-6 levels in human nonalcoholic steatohepatitis. Am J Gastroenterol 2008; 103:1372–1379. 12. Kogiso T, Moriyoshi Y, Shimizu S, Nagahara H, Shiratori K. High-sensitivity C-reactive protein as a serum predictor of nonalcoholic fatty liver disease based on the Akaike Information Criterion scoring system in the general Japanese population. J Gastroenterol 2009; 44:313–321. 13. Meng X, Wei G, Chang Q, Peng R, Shi G, Zheng P, et al. The platelet-to-lymphocyte ratio, superior to the neutrophil-to-lymphocyte ratio, correlates with hepatitis C virus infection. Int J Infect Dis 2016; 45:72–77. 14. European Association for the Study of the Liver (EASL); European Association for the Study of Diabetes (EASD); European Association for the Study of Obesity (EASO). EASL-EASD-EAS
留言 (0)