
記住我


Staphylococcus epidermidis is one of the most important skin commensals (Becker et al., 2014). However, it is also a major opportunistic pathogen (Gill et al., 2005; Brown et al., 2012) associated with medical devices-related infections in immunocompromised patients (Conlan et al., 2012; Sabaté Brescó et al., 2017). These infections result from the disruption of the skin barrier by incision during surgery or introduction of catheters which allows S. epidermidis access to the bloodstream (Kleinschmidt et al., 2015; Lee and Anjum, 2022) and followed by production of biofilms on medical device’s surface. During skin to blood transition, S. epidermidis must cope with drastic environmental changes. On the skin, S. epidermidis is subjected to UV radiation, low nutrient availability, dryness, salinity fluctuations, low temperatures and a low pH range (pH 4.5–7; average pH 5.5) (Lambers et al., 2006; Schmid-Wendtner and Korting, 2006; Kammeyer and Luiten, 2015; Espadinha et al., 2019). In contrast, in the blood, S. epidermidis faces a completely different environment: richer in nutrients, with higher temperature and more alkaline (pH 7.4). Moreover, in the blood S. epidermidis has to deal with the presence of pro-inflammatory molecules and reactive oxygen species (ROS) generated by immune cells (Akira et al., 2006; Weiss and Schaible, 2015; Espadinha et al., 2019) and the mechanical stress imposed by the blood flow that was previously shown to interfere with bacterial growth (Viela et al., 2019; Steinert et al., 2020). Despite these obvious differences between commensal and pathogenic environments, the mechanisms underlying S. epidermidis adaptation to blood conditions are yet poorly understood (Espadinha et al., 2019), in part due to the complexity of the skin and blood environment. Skin is a low acidic environment that potentially has antimicrobial activity since the undissociated forms of weak acids pass freely through the bacterial cell membrane. Since the cytoplasmic pH is generally higher than that of the growth medium, the weak acid dissociates leading to acidification of the cytoplasm. This effect can induce structural damage to the cell membrane and macromolecules, such as DNA and proteins. Bacterial survival strategies to deal with the environmental acidic stress include the combination of constitutive and inducible strategies that result in the removal of protons, namely transmembrane proton motive force, alkalisation of the external environment, changes in the composition of the cell envelope, production of general shock proteins and chaperones, expression of transcriptional regulators, and responses to changes in cell density, in particular when part of a biofilm (Cotter and Hill, 2003). At blood pH, non-CC2 strains of clonal lineage B produce a significant lower amount of biofilm (Espadinha et al., 2019).
In the recent years, proteomic and metabolomic approaches to study bacterial physiology and infection has gain momentum (Bonar et al., 2015, 2018; Chen et al., 2017; Jean Beltran et al., 2017). In the case of S. epidermidis, proteomic and metabolomics was used to study biofilm formation (Carvalhais et al., 2015; Harris et al., 2016; Bottagisio et al., 2019; Gu et al., 2020; Martínez-García et al., 2021), to compare commensal and pathogenic strains (Savijoki et al., 2014; Siljamäki et al., 2014; Águila-Arcos et al., 2015), to study the processes associated to stress response (Zhang et al., 2011) and the adhesion to medical devices (Sadykov et al., 2010; Bürgers et al., 2018; Bottagisio et al., 2020).
To get new insights on the mechanisms of S. epidermidis adaptation during infection we analyzed S. epidermidis metabolic response to skin and blood pH. A S. epidermidis strain belonging to the less pathogenic S. epidermidis lineage (B lineage) (Espadinha et al., 2019), was grown at pH 5.5 and 7.4, and LC-MSMS proteomic and NMR metabolomic data were acquired for their intracellular content. Integrated functional analysis of the differentially regulated proteins and metabolites between the two pH conditions identified pathways and cellular processes clearly associated to commensal and pathogenic states, suggesting that a pH shift is a key signal for pathogenicity in this bacterial species.
Materials and methods Ethical statementStaphylococcus epidermidis isolate 19N was obtained from screening of the anterior nares of draftees attending Centro de Formação da Ota (Lisbon, Portugal), which was performed with written informed consent and approval from all the necessary military authorities. The procedure was non-invasive.
Bacterial strains and growth conditionsThe S. epidermidis 19N strain was collected from the anterior nares of a healthy person in Portugal in 2001. This strain was previously characterised by whole genome sequencing and belongs to clonal lineage B (Espadinha et al., 2019).
A single colony from a S. epidermidis 19N strain culture grown O/N at 37°C (TSA, BactoTM), was used to pre-inoculate Tryptic Soy Broth (TSB) medium with two different pH (5.5 and 7.4) that was incubated overnight at 37°C at 225 rpm. The volume of the culture medium was kept at 36% (90 ml/250 ml) of the flask total volume to ensure a good aeration. Pre-inoculums were adjusted either to pH 5.5 or pH 7.4, with hydrochloric acid.
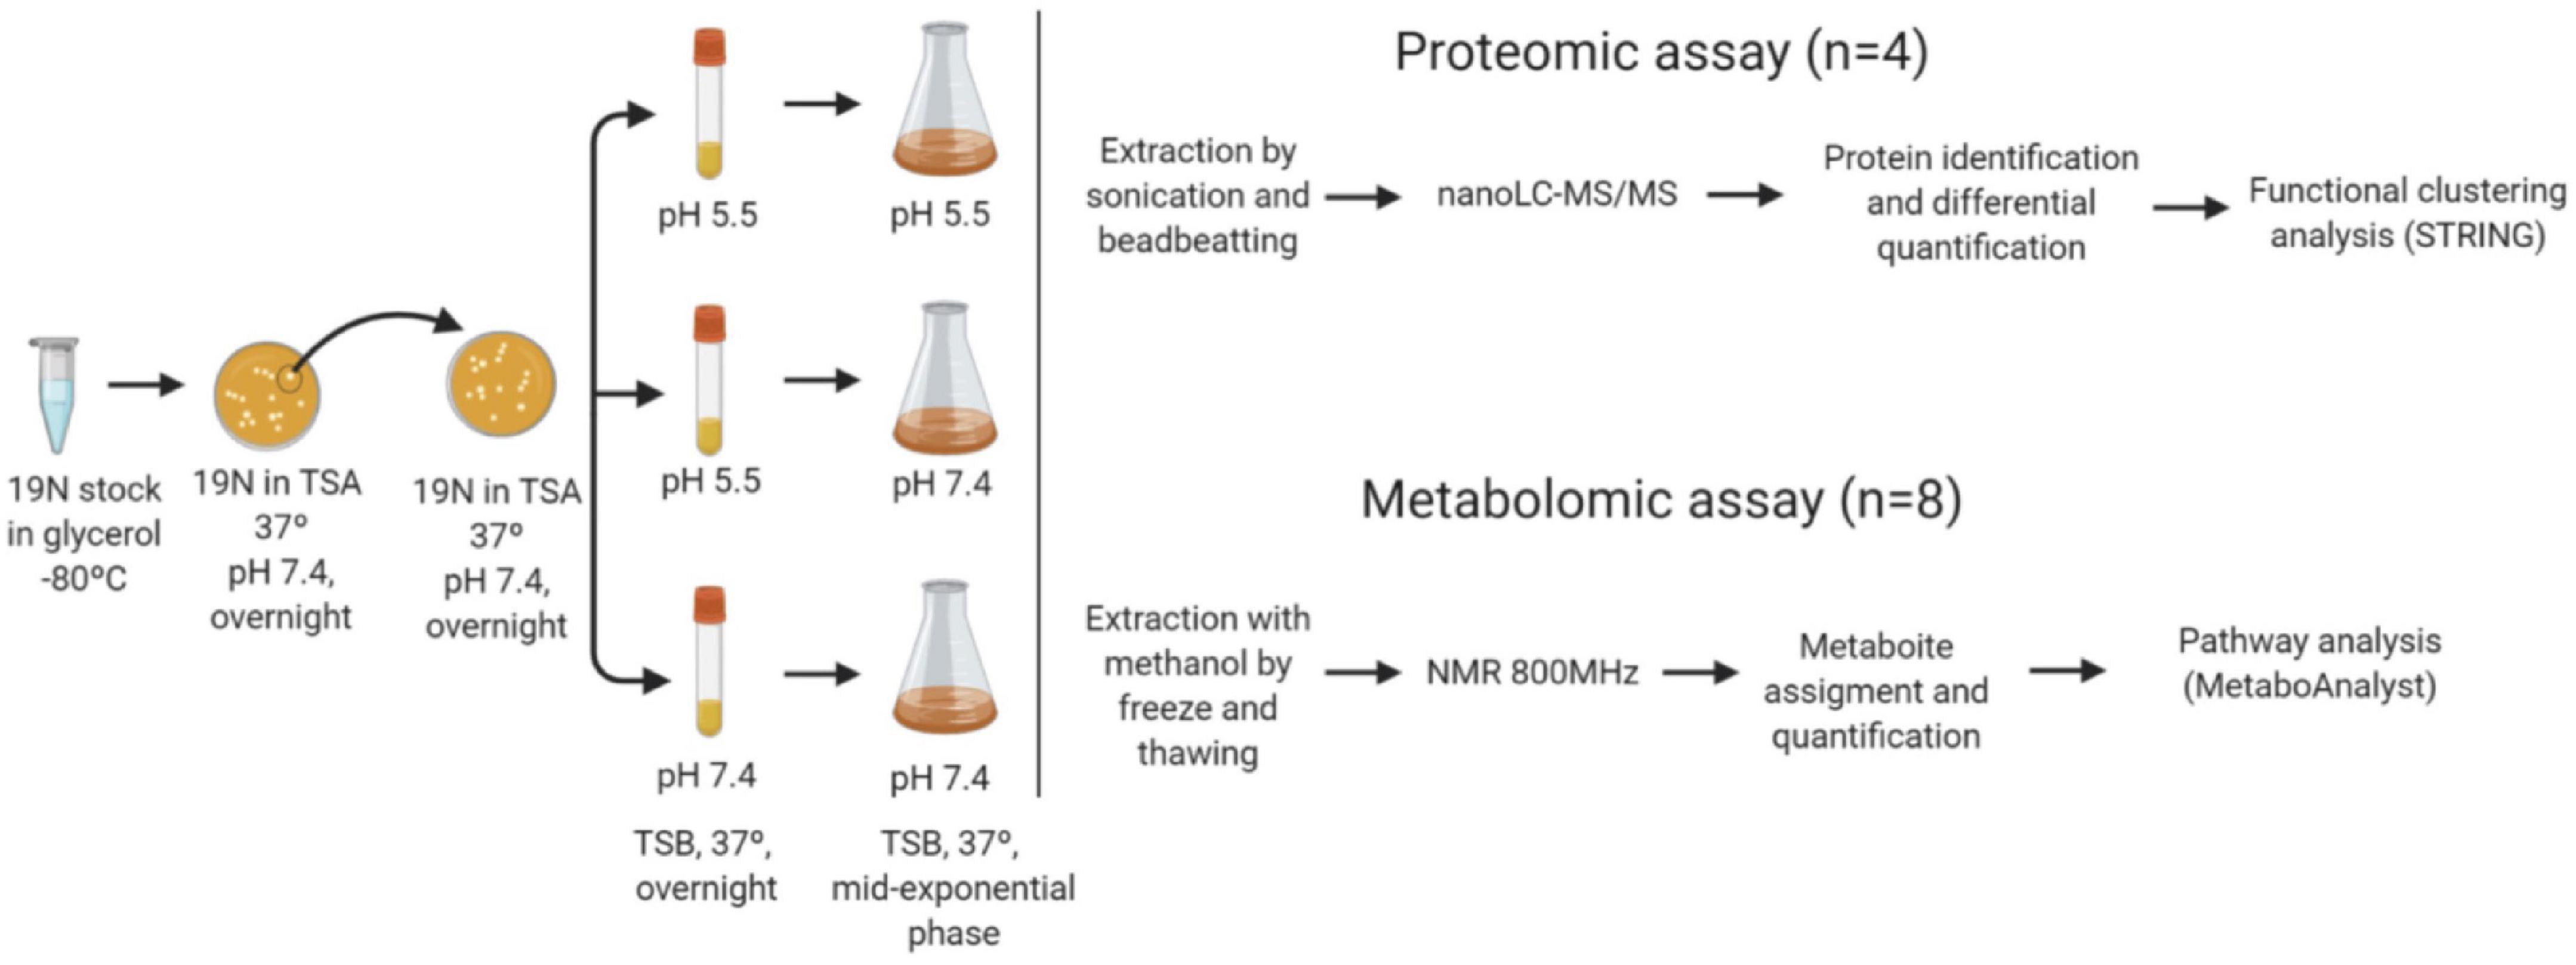
Experimental modelling—stress challengeIn this work, three pH transitions from pre-inoculum to inoculum were assayed. S. epidermidis pre-inoculums and the growth were performed at TSB medium with pH 7.4, to mimic the blood pH; and pH 5.5, to mimic the skin pH. The pre-inoculum cellular density was adjusted to 0.06 (OD600) (aprox.1.5 × 108 CFU/mL) and used to inoculate fresh medium in the three conditions depicted in Figure 1, simulating S. epidermidis at skin and blood and a pH shock endured by S. epidermidis during the infection process from skin to blood transition. The cell cultures incubated at 37°C with 225 rpm were followed by OD600 and recovered at mid-exponential phase for further analysis.
FIGURE 1
Figure 1. Scheme of the workflow followed. Cells from –80°C glycerol stocks were streaked in Tryptic Soy agar media (TSA) and a single colony was picked to inoculate a new TSA plate. From the plate a single colony was collected to prepare a pre-inoculum in TS broth medium with adjusted pH (pH 5.5 and 7.4) and incubated overnight at 37°C and 225 rpm. The inoculum at pH 5.5 was used for the cultures grown at 5.5 (N55) and 7.4 (N57), and the inoculum at pH 7.4 for the culture at the same pH (N77). The cells were harvested at mid-exponential phase. For proteomics the proteins were extracted from 4 biological replicates/experimental condition and analysed by nanoLC-MS/MS. Identified proteins (MASCOT) were quantified by spectral counts. Differential abundant proteins between experimental conditions were submitted to functional clustering analysis (STRINGdb). Metabolites from eight replicates/experimental condition were extracted, after metabolic quenching and biomass normalisation. Metabolites were assigned in 1H-NMR spectra acquired in an 800 MHz spectrometer (ChenomxNMRsuite). Their determined concentrations were used for pathway analysis (MetaboAnalyst).
Proteomic analysisProtein extraction was done on S. epidermidis cells harvested at the mid-exponential phase from 100 mL of cell cultures. Four biological replicates were treated per condition. The cultures were centrifuged at 10,000 g for 5 min, and the resulting cell pellets were immediately frozen in liquid nitrogen and stored at –80°C. Cells were resuspended in NuPAGE LDS Sample Buffer 1X (Invitrogen, 100 μL/10 mg of pellet) and subjected to bead-beating as described (Hayoun et al., 2019). The proteins were then treated as detailed previously (Rubiano-Labrador et al., 2014) to obtain tryptic peptides. These were analysed with a Q-Exactive HF high resolution tandem mass spectrometer (ThermoFisher Scientific) incorporating an ultra-high-field Orbitrap analyzer (Klein et al., 2016). Shortly, peptide mixtures were injected and desalted online using a reverse phase precolumn Acclaim PepMap 100 C18 and resolved on a reverse phase column Acclaim PepMap 100 C18 with a flow rate of 200 nl/min with a 90 min gradient. The mobile phase consisted of 0.1% HCOOH (A) and 80% CH3CN, 0.1% HCOOH (B) using a gradient programmed from 4 to 25% of mobile phase B for 75 min and 25–40% of mobile phase B for 15 min. Mass spectrometry data-dependent acquisition was performed according to a Top20 strategy consisting in a scan cycle initiated with a full scan of peptide ions in the ultra-high-field Orbitrap analyzer, followed by selection of the precursor, high energy collisional dissociation and MS/MS scans on the 20 most intense precursor ions, selecting threshold intensity of 83,000, potential charge states of 2+ and 3+, and dynamic exclusion of 10 s. Full scan mass spectra were acquired from m/z 350 to 1,500 with a resolution of 60,000. Each MS/MS scan was acquired at a resolution of 15,000 with a maximum ion trapping of 60 ms and an m/z isolation window of 2.0.
Proteome data processingMS/MS spectra were searched using MASCOT 2.5.1 software (Matrix Science) against the 19N S. epidermidis genome for which 2,469 protein sequences have been annotated totalling 720,252 residues (NCBI database SRX7846931). The following parameters were used for MS/MS spectra assignation: full-trypsin specificity, maximum of two missed cleavages, mass tolerances of 5 ppm and 0.02 Da on the parent ion and fragments, respectively, fixed modification of carbamidomethyl cysteine (+57.0215), and oxidized methionine (+15.9949) and deamidated asparagine/glutamine (NQ) (0.9840) as dynamic modifications. Peak lists generated from all spectra of peptides were submitted to MASCOT. Peptides with a score below a p-value of 0.05 were assigned to proteins. The proteins were validated when at least two different peptide sequences were detected. The false discovery rate for protein identification was below 1% when applying these rules with the corresponding MASCOT decoy search mode. For each validated protein, spectral count (SC) was used as a proxy of their relative abundances in each condition. SC values for each protein were compared between pH conditions by the calculation of a relative protein enrichment, the T-fold change, as defined by Carvalho after normalisation of the dataset as recommended (Liu et al., 2004; Carvalho et al., 2012). Differentially abundant proteins were selected when their adjusted p-value ≤ 0.05 and absolute T-fold above 1.5. The proteins differentially abundant in the 3 conditions were considered for the functional interactions network construction using STRINGdb (v11.0)1 based on: co-expression, text-mining, biochemical/genetic data (“experiments”), and previously curated pathway and protein-complex knowledge (“databases”), with S. epidermidis RP62A as reference organism and a minimum interaction score of 0.7 (Szklarczyk et al., 2019). For protein functional analysis, BLATSp analysis was performed against S. epidermidis database from UniProt (22530 entries in 10/06/2019), considering valid results for which 75% sequence coverage, 35% sequence identity and p-value ≤ 0.05 were at least obtained. The mass spectrometry proteomics data have been deposited to the ProteomeXchange Consortium via the PRIDE partner repository (Perez-Riverol et al., 2022) with the dataset identifier PXD034825 and 10.6019/PXD034825.
Metabolomic analysis Metabolites extractionCells were recovered at mid-exponential phase from 100 mL cultures following a protocol adapted from Somerville and Powers (2014). Eight biological replicates of each independent growth condition were obtained. Cells were harvested by centrifugation at 5,000 × g for 5 min at 4°C. Cells were washed with 20 mM phosphate buffer pH 7.2–7.4 and centrifuged for 1 min at 13,000 rpm. Cell pellet was suspended in the same buffer with a final OD600 of 20 and stored at –80°C for further metabolite extraction. Cells were thawed in a water bath at room temperature and 750 μL of 60% methanol were added and subjected to three freeze-thaw cycles using liquid nitrogen. Extracted samples were centrifuged at 21,000 g for 5 min at 4°C. The extraction process on the pellets was repeated twice. The supernatants were kept and stored together at –20°C overnight and dried in a SpeedVac. Dried samples were dissolved in: 750 μL phosphate buffer (33 mM, pH 7.0 in D2O with 2 mM of sodium azide) with 0.21 mM of 3-(trimethylsilyl)propionic-2,2,3,3-d4 (TSP). The suspensions were centrifuged at 21,000 g for 5 min at 4°C and the resulting supernatants were then transferred to 5 mm NMR tubes.
NMR metabolite analysisNMR spectra were acquired on a Bruker Avance II + 800 MHz spectrometer equipped with a 5 mm TXI-Z H/C/N/-D probe. All 1D 1H were acquired at 298.15 K and using a noesygppr1d pulse program [256 scans; relaxation delay of 4 s; mixing time of 10 ms; spectral width of 16025.641 Hz; size of free induction decay (FID) was 128k points]. Processing of spectra was performed with Bruker TopSpin 3.2. All FID were multiplied by an exponential function, followed by Fourier Transformation. Spectra were manually phased and baseline corrected. Chemical shifts were adjusted according to the TSP chemical shift at 0.00 ppm. For spectral assignment, 2D NMR spectra were acquired for some samples: 1H-1H TOCSY, 1H-13C HSQC, and 1H J-resolved.
1D 1H NMR processed spectra were grouped and converted into a matrix (each column was a spectrum; each row was one of the 128k points that makes up the FID). Spectra were aligned and centred according to the chemical shift of TSP at 0.00 ppm. For untargeted analysis, the region of water (4.70--4.95 ppm) was removed. After trimming interfering peaks, only the region between 0.15 and 10.00 ppm was used. All the aforementioned steps were completed using R software environment for statistical computing (v3.6.2) with homemade scripts. For targetted analysis, resonances assignment, metabolites identification and quantification were performed with Chenomx NMR suite 8.12. All the metabolites were confirmed based on two-dimensional NMR spectra. Metabolomic data is available at the NIH Common Fund’s National Metabolomics Data Repository (NMDR) website, the Metabolomics Workbench,2 where it has been assigned Project ID ST003341.
Statistical analysisThe results were evaluated by univariate and multivariate statistical analysis. In the case of proteomic data, a univariate t-Student analysis was performed using bicaudal distribution and homoscedastic samples. For metabolite data, pairwise comparisons were conducted using the Wilcoxon rank-sum test to look for significant differences (p-value ≤ 0.05) between the groups of samples. Correction for multiple testing was performed using the Benjamini-Hochberg procedure (Benjamini and Hochberg, 1995). This analysis was performed in the R software environment for statistical computing (v3.6.2). Multivariate statistics included principal component analysis (PCA) and partial least squares discriminant analysis (PLS-DA) for both data sets. A cross-validation method was used to evaluate the goodness of prediction (Q2) value of the resulting models, with a permutation analysis to further confirm the validity of the PLS-DA model. To understand which metabolites were contributing the most to the separation observed by PLS-DA, a variable importance in projection (VIP) analysis was conducted using the loadings derived from the PLS-DA. For the proteomic data, Hierarchical Cluster analysis was performed with MetaboAnalyst 4.03 (Chong et al., 2019). Pathway analysis was done to identify the putative pathways altered between the different conditions based on the metabolites levels using the Staphylococcus aureus N315 as the pathway library reference in MetaboAnalyst 4.0 (Xia and Wishart, 2010). Proteins differentially abundant between pH conditions were considered to the network construction using STRING database (Szklarczyk et al., 2019) with (0.9) confidence minimum required interaction score.
Results Staphylococcus epidermidis 19N growth conditions and multi-omics comparative strategyIn order to understand the changes occurring in each condition that mimic colonisation and infection the proteome and metabolome of S. epidermidis 19N strain were determined at pH 5.5 (hereafter N55), pH 7.4 (hereafter N77) and at pH 7.4 but with a culture initiated with a pre-inoculum grown at pH 5.5 (hereafter N57). This last condition simulated a sharp pH alteration as expected during infection. Figure 1 shows the experimental strategy for obtaining for each experimental condition four and eight biological replicates for proteomic and metabolomic analysis, respectively. Growth curves were monitored (Supplementary Figure 1), showing a significantly higher growth rate for the N57 transition condition (0.978 h–1) compared to the N55 (0.817 h–1) and N77 (0.705 h–1) steady conditions. The growth rate is also significantly different between these two last conditions. Measured media pH values at the middle-exponential phase have dropped 0,3 and 1,0 units, respectively for N55 and N77.Cells were harvested at the mid-exponential phase and subjected to shotgun proteomics and NMR-based metabolomics.
With the proteomic workflow used a total of 771,440 MS/MS spectra were acquired for the 12 analysed samples. A total of 441,537 Peptide-to-Spectrum Matches (PSMs) were interpreted, resulting in a ratio of 57% of assigned MS/MS spectra. Such a ratio is usually obtained in similar conditions when a highly confidently annotated genome is used as a database. The dataset gave confident identification of 20,194 unique peptides and 1,372 proteins that could be quantified. This number is roughly similar for the three experimental conditions: 1347 (N55), 1353 (N57), and 1351 (N77). High reproducibility was observed within the biological replicates of each experimental condition (see Supplementary Table 1, sheet “Supplementary Table 1”). By NMR it was possible to identify and quantify 46 metabolites common among the analysed samples. From 187 resonances present in the 1H-NMR spectra, it was possible to assign most of the most intense ones, in a total of 142 (76%).
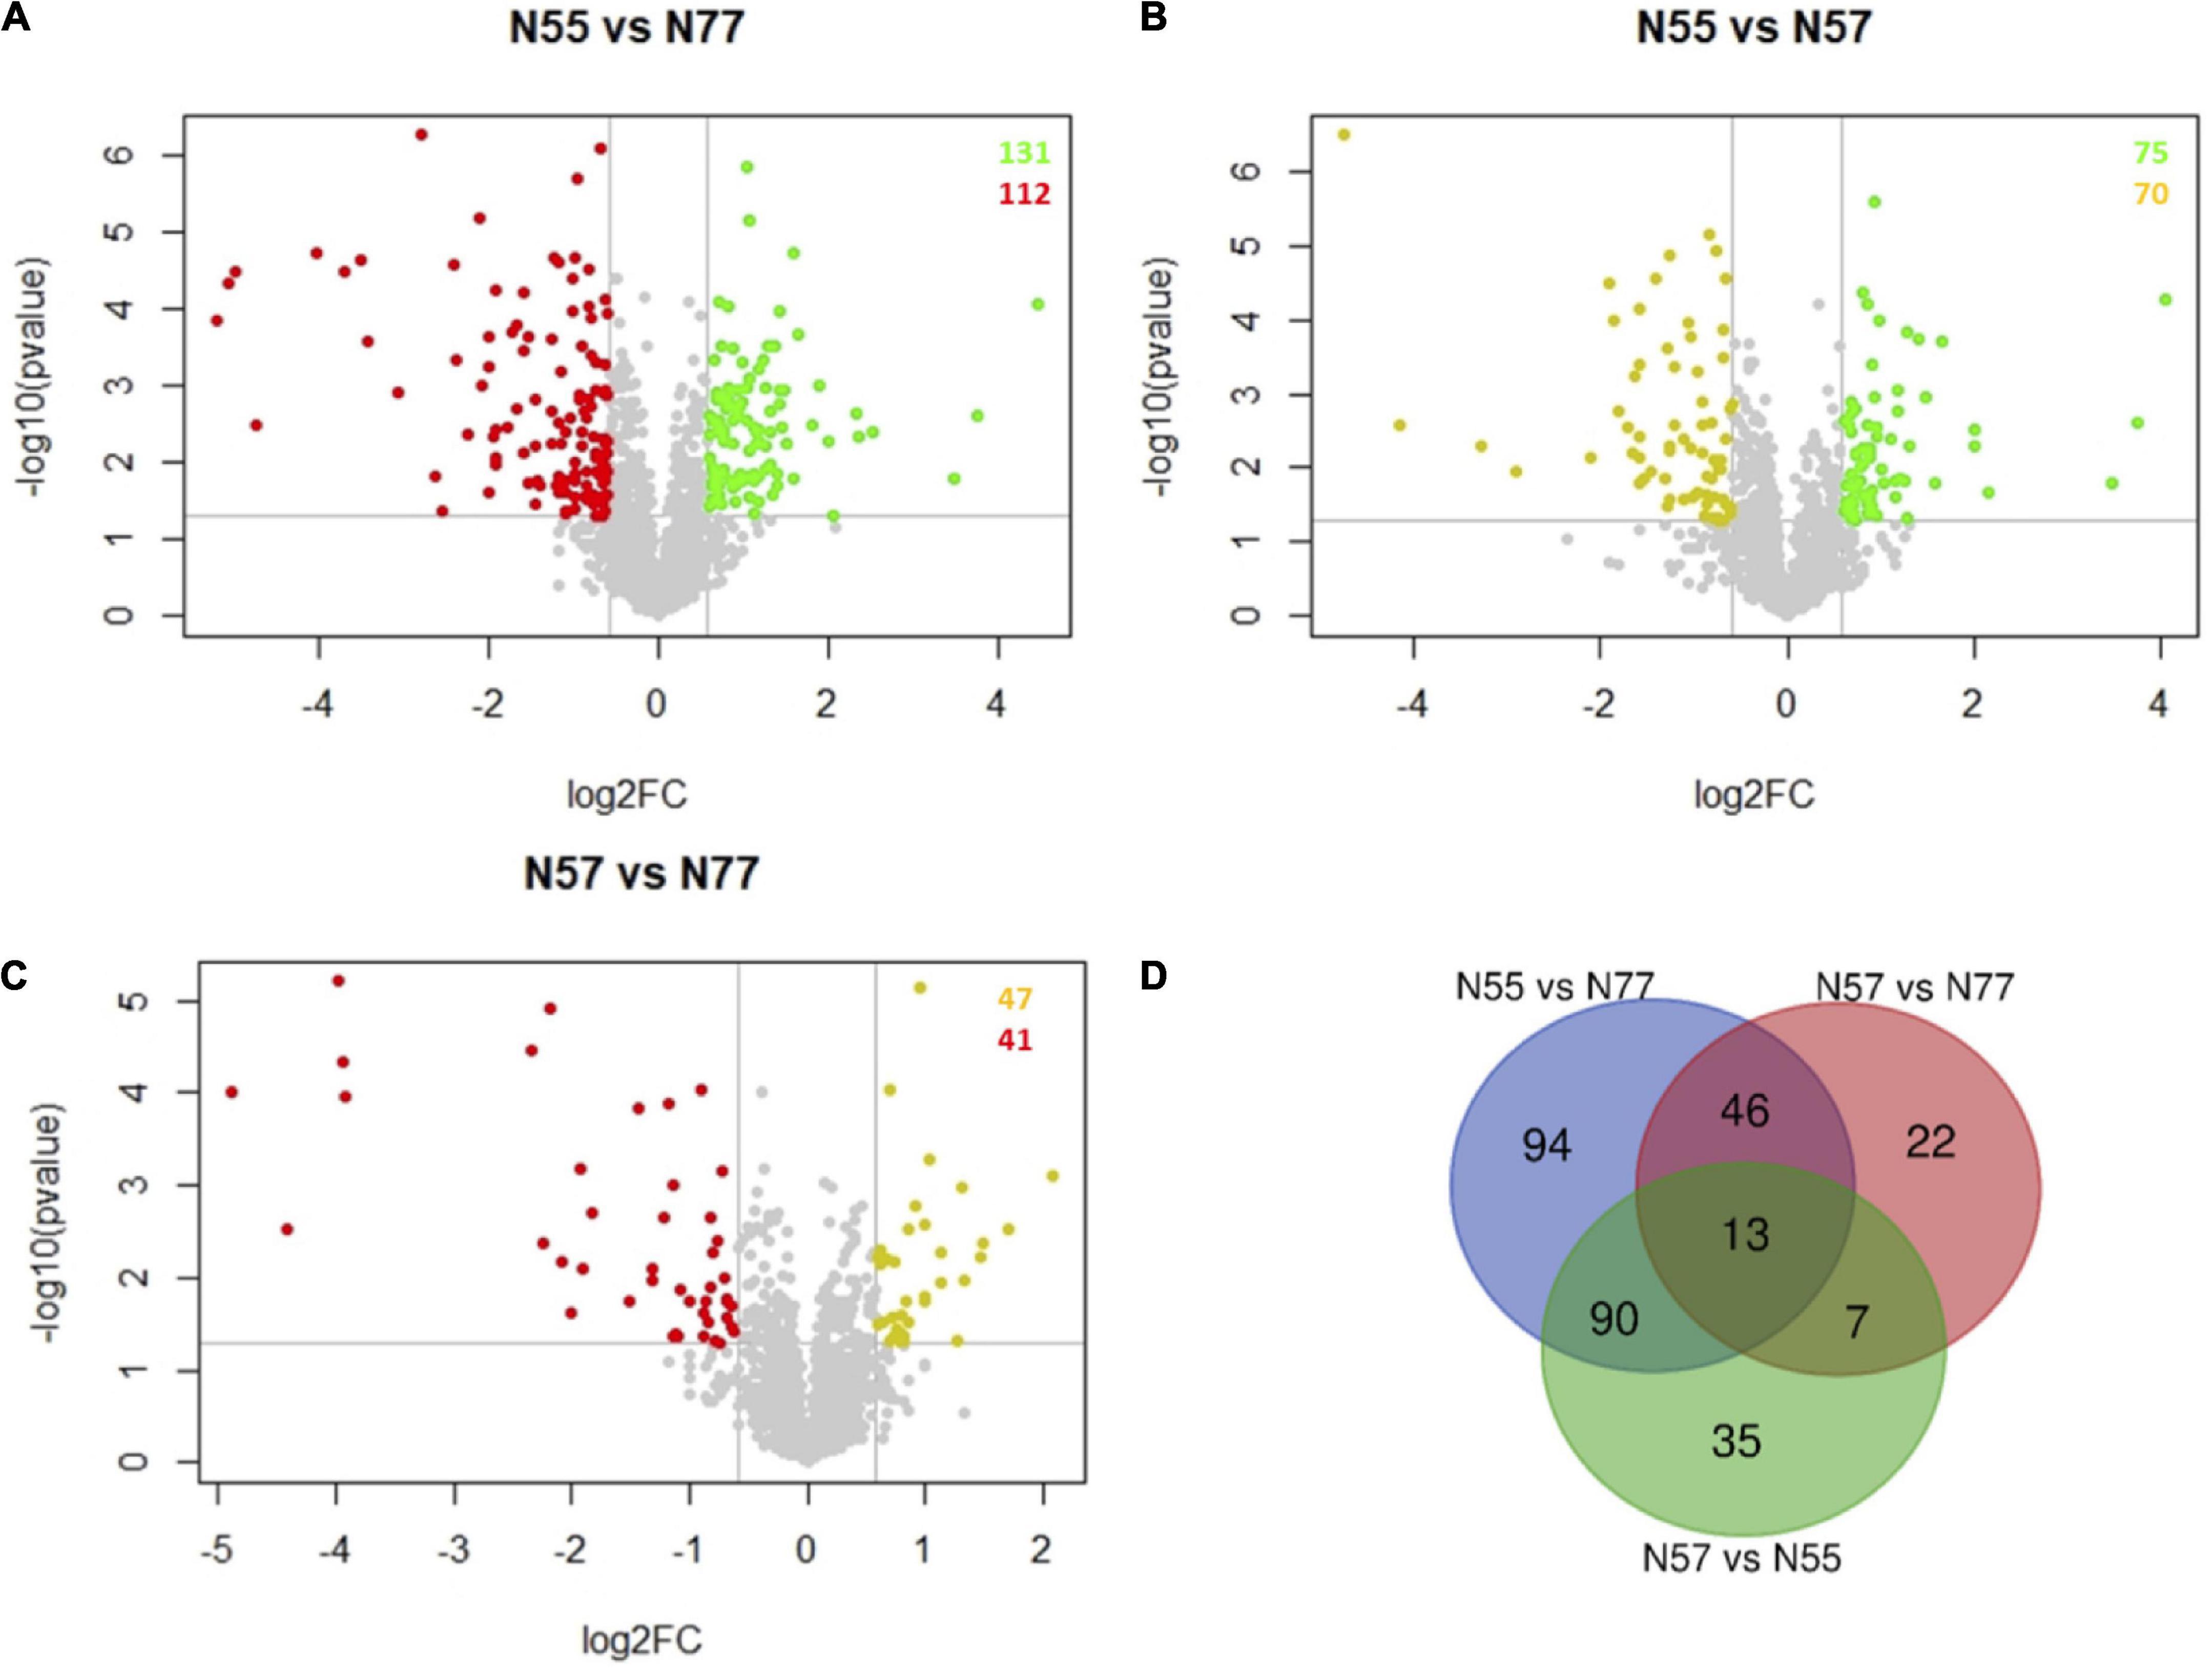
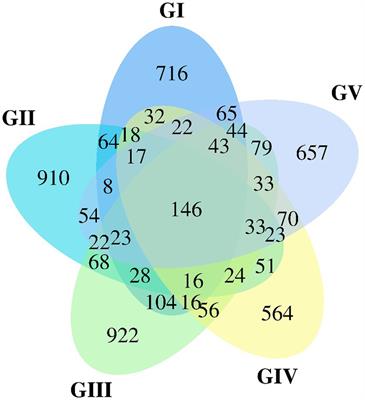
Differential proteomic analysisA multivariate statistical analysis showed that the proteomic datasets for the three conditions were clearly distinguished by the PCA test, and no biological replicate should be considered as outlier. Five components from the PCA test explains 81% of the variance among the three experimental conditions (Supplementary Figure 2). The Volcano plots showing the differential abundance of proteins between each pair of experimental conditions (N55 vs. N77, N55 vs. N57, and N57 vs. N77) are represented in Figures 2A–C. N55 (skin pH condition) vs N77 (blood pH condition) showed 243 proteins with significantly different levels, 131 proteins are increased in N55 condition and 112 increased in N77 (Figure 2A). This constitutes the pair with a higher number of differences by opposition to the comparison N57 vs N77 with only 88 protein abundance differences. A Venn diagram (Figure 2D) reveals the intersection of protein groups with differential levels between each experimental comparison. Thirteen proteins were differentially abundant in the three comparisons (Figure 2D). These include secreted proteins (like proteases, signal peptidases and a secretory antigen) and others involved in glycerolipids metabolism, biosynthesis of polyphosphates, betaine and DNA replication. The highest number of proteins with abundance differences specific to a pair of conditions was also observed for N55 vs N77 (94 proteins) and the lowest for N57 vs. N77 (22 proteins), suggesting, respectively, a higher and a lower change of the biological and metabolomic processes associated to these two pairs.
FIGURE 2
Figure 2. Volcano plots and Venn diagram of protein abundance differences between conditions. (A–C) Volcano plots of the proteins differentially abundant between each pair of experimental conditions (FC > 1.5, p-value < 0.05). Spots representing proteins with increased abundances in N55, N57 and N77 are coloured in red, yellow and green, respectively. (A) N55 vs N77; (B) N55 vs N57; and (C) N57 vs N77. (D) Venn diagram showing the number of proteins that are differentially abundant in the several comparisons of experimental conditions (N55 vs N77, N55 vs N57 and N57 vs N77).
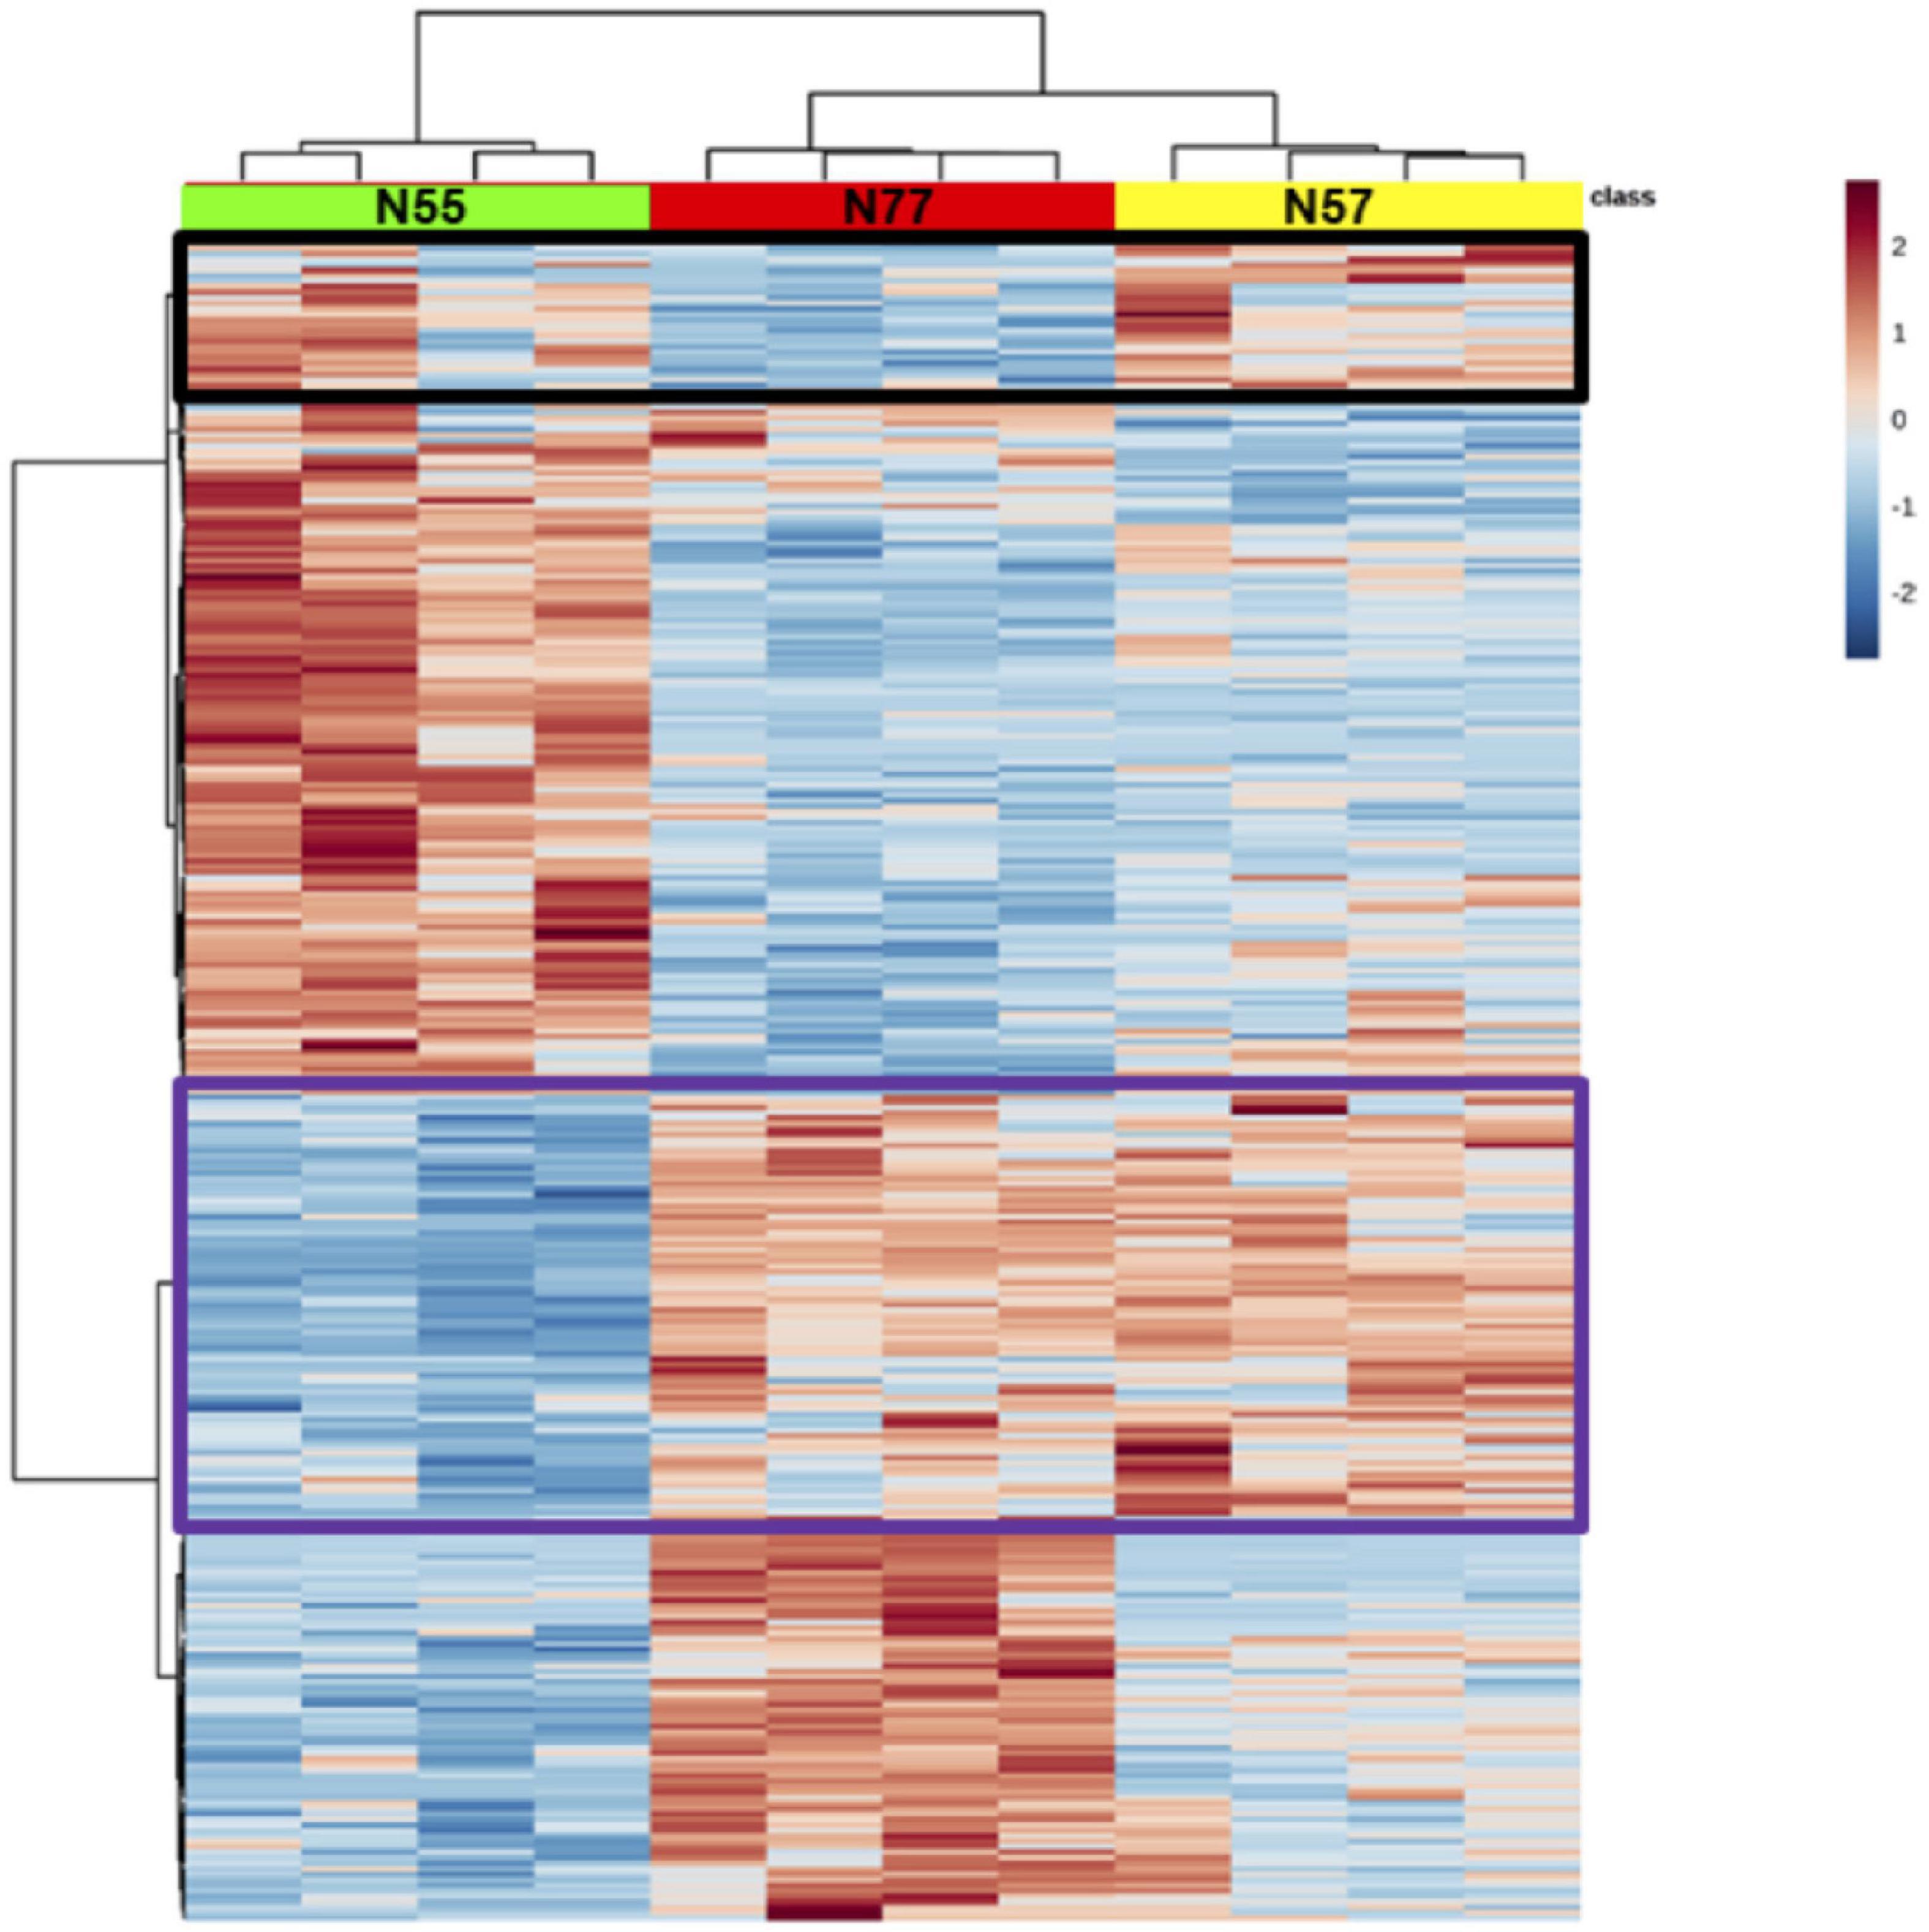
Hierarchical clustering of differentially abundant proteins confirmed a clear separation among the three experimental conditions (Figure 3). Few proteins increased in N55 are also increased in N57, around half of the proteins increased in N77 are also increased in N57, suggesting that the biological and metabolic processes associated to N77 are closer to those prevailing in N57 and that this condition appears as a transition between the two pH environments, skin, and blood.
FIGURE 3
Figure 3. Hierarchical clustering of differentially abundant proteins. In green, red and yellow are identified the columns for the replicates of each experimental condition, respectively N55, N77, and N57. In the heatmap, red and blue correspond to higher and lower abundant proteins, respectively. The tree in the x axis represents the similarity among experimental conditions regarding abundance of proteins and in the y axis the proteome similarities. Proteins having increased levels in common between conditions N55 and N57 and conditions N57 and N77 are evidenced in black and purple rectangles, respectively.
Proteomic analysis at skin vs blood environmental pHThe proteins differentially detected (Supplementary Table 1, sheet “Supplementary Table 1_N55vsN77”) were analysed in terms of STRINGdb interaction networks to find potentially modulated global metabolic pathways. A total of 243 differential proteins were detected between blood and skin pH.
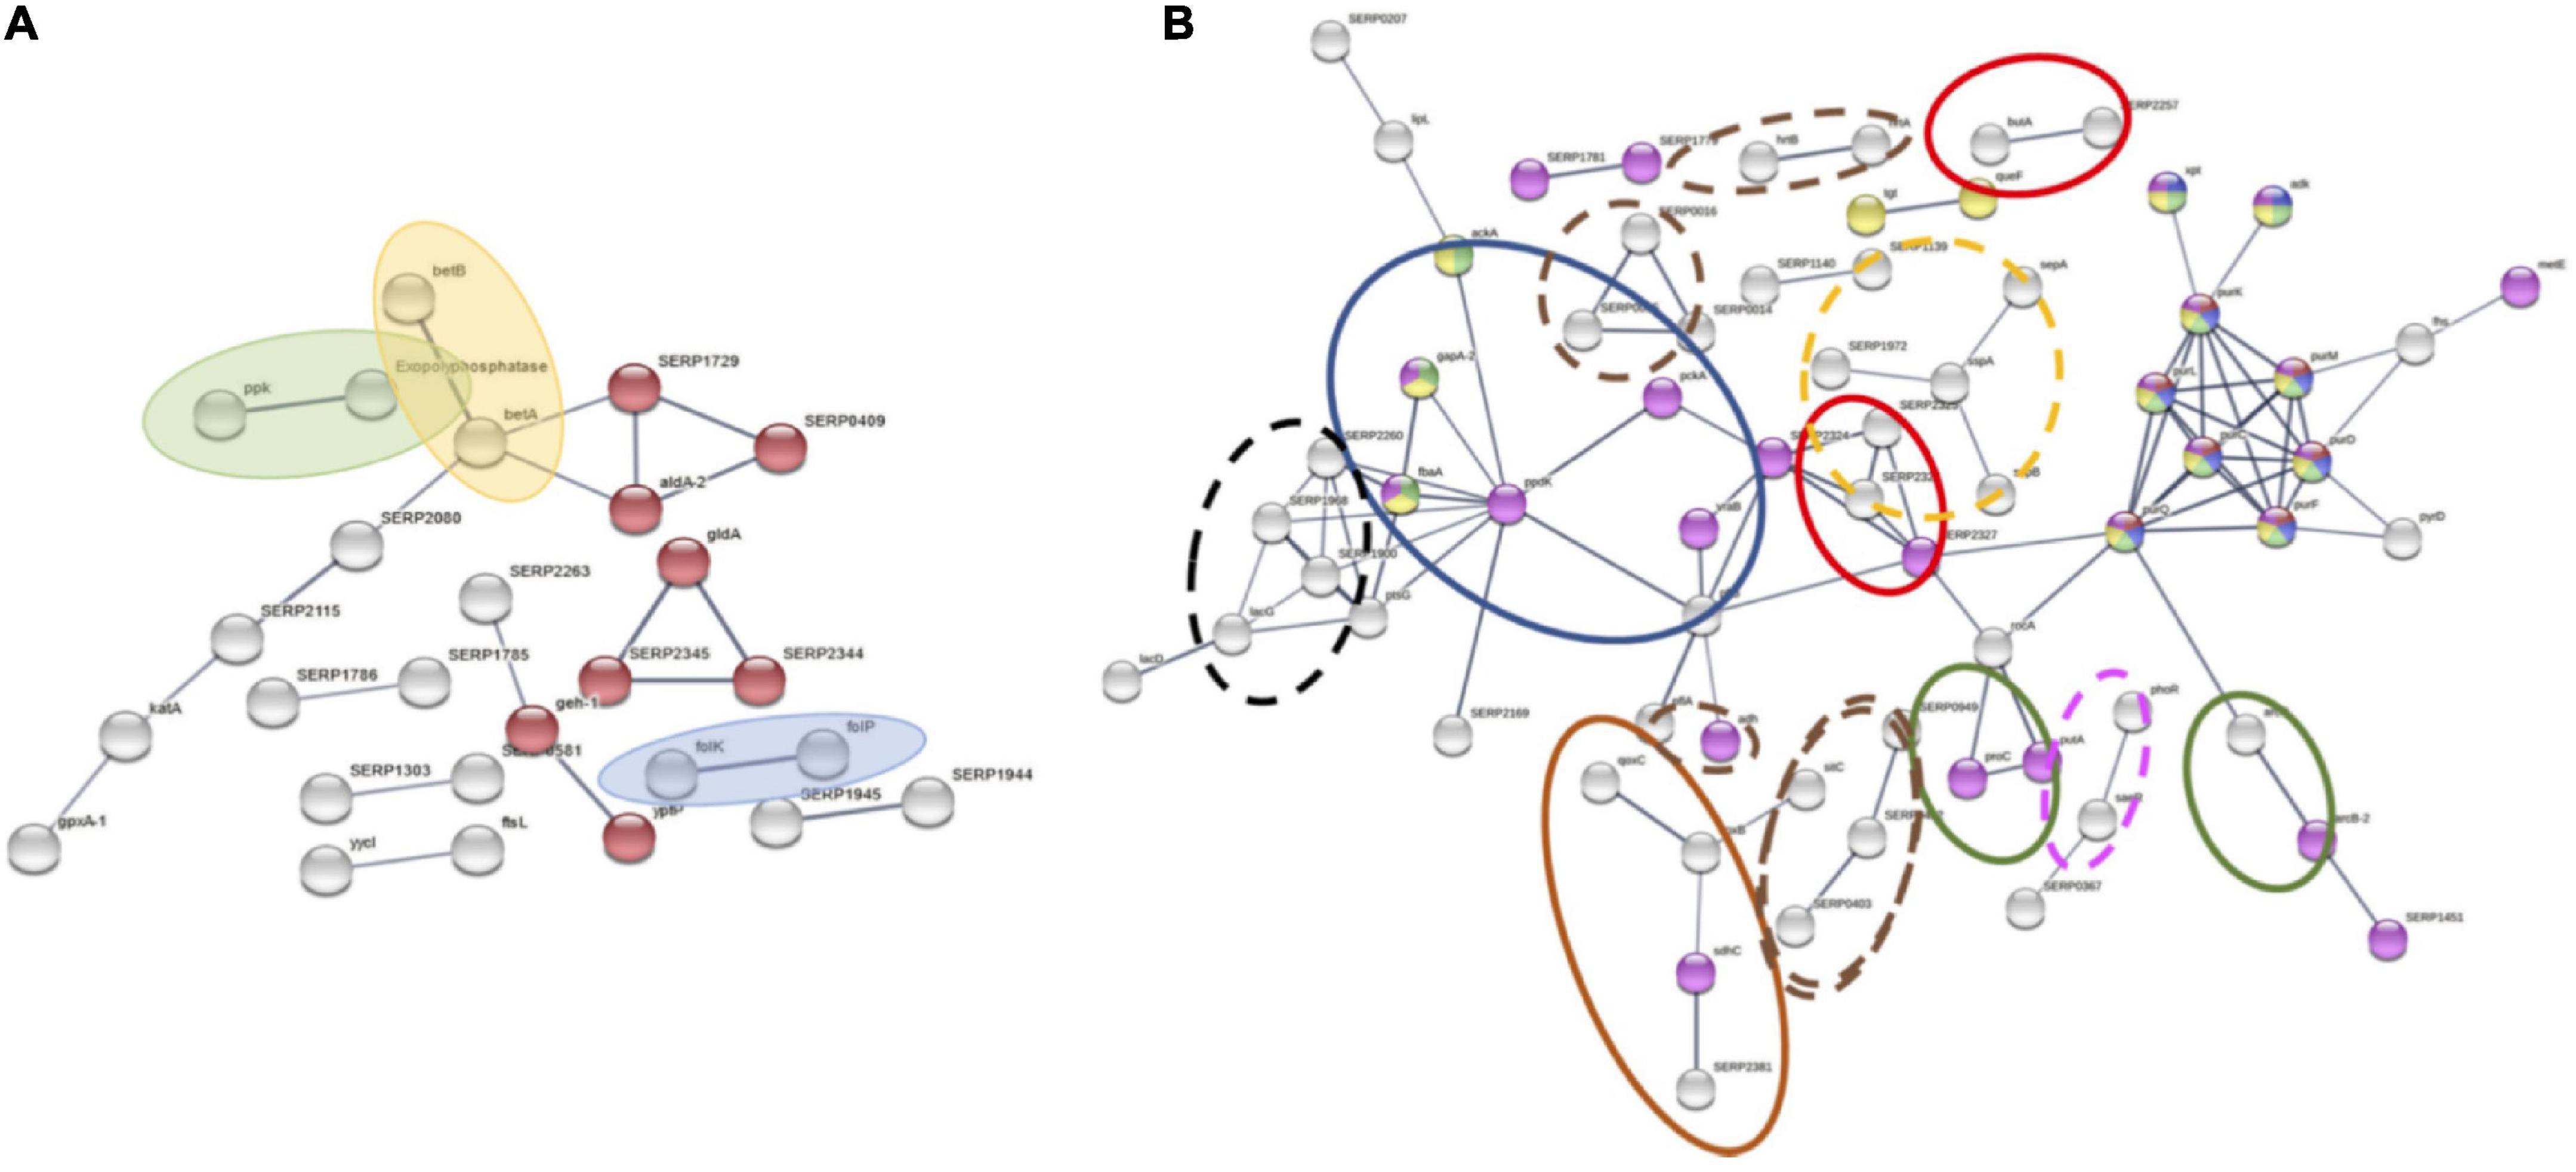
The network for the 112 proteins whose abundance increased in N55 exhibits 27 nodes (PPI enrichment p-value = 5.69e-08) of which 8 are related with the glycerolipid metabolism (Figure 4A). Furthermore, it highlights oxidative phosphorylation, metabolism of phosphate and biosynthesis of betaine and of folate. Betaine is a modified amino acid that works as an osmoprotectant and as a methyl donor, while folate is an enzyme cofactor also involved in methylation reactions relevant in the biosynthesis of purines. The transport of drugs and cell division are also relevant in N55. In particular N-acetylmuramoyl-L-alanine amidase, involved in the cleavage of the amide bond between N-acetylmuramoyl and L-amino acids in bacterial cell walls, which is the most differentially increased protein.
FIGURE 4
Figure 4. STRING network of differentially abundant proteins between N55 and N77 conditions. Proteins increased (A) and decreased (B) in condition N55 when compared with N77. (A) Proteins associated with glycerolipid metabolism are represented as red nodes. Blue, yellow and green shadowed ellipsis highlight proteins involved in folate and betaine biosynthesis and phosphate metabolism. (B) Proteins associated to purine and nucleotide metabolism are represented as red, purple, green and yellow nodes, while those associated with the biosynthesis of secondary metabolites are represented as pink nodes, including proteins involved in glycolysis/gluconeogenesis/pyruvate metabolism, oxidative phosphorylation, acetoin catabolism arginine and proline metabolism circled by blue, orange, red and green open ellipsis. The other clusters highlighted with dashed black, brown, yellow and magenta ellipsis are the phosphoenolpyruvate:sugar phosphotransferase system (PTS), membrane transporters, extracellular proteases and the SaeRS two-component signal transduction system (TCS).
On the other hand, for the 131 proteins identified as increased in N77 a 69 nodes STRING network was established (PPI enrichment p-value = 5.55e-16) (Figure 4B). In this case the most represented metabolic pathways were the purine/nucleotide metabolism, glycolysis/pyruvate metabolism, oxidative phosphorylation, butanoate metabolism, and arginine and proline metabolism. Other STRING clusters are associated with the phosphoenolpyruvate:sugar phosphotransferase system (PTS); hemin, iron, and manganese and other membrane transporters; extracellular proteases, t-RNA modification and; the SaeRS two-component signal transduction system (TCS), which influences virulence and biofilm formation in S. aureus (Lou et al., 2011). The proteins with a higher abundance increment in N77 are glyceraldehyde-3-phosphate dehydrogenase (glycolysis/gluconeogenesis) and two extracellular proteases, staphopain A and a glutamyl endopeptidase. In particular, staphopain A is a cysteine protease that plays an important role in the inhibition of host innate immune response. In S. aureus this protein was shown to cleave host elastins found in connective tissues, facilitating invasion of host cells and to hydrolyse the chemokine receptor CXCR2 on leukocytes, which blocks neutrophil activation and chemotaxis (Potempa et al., 1988; Kantyka et al., 2013). On the other hand, the glutamyl endopeptidase (SspA) from S. epidermidis was shown to exhibit a significant hydrolytic activity for the carbonyl side of glutamic acid and to show activity toward human fibronectin and type 1 collagen (Ohara-Nemoto et al., 2002).
Proteomic comparison for pH shock adaptation vs blood and skin mimicking conditionsWhen we compared S. epidermidis 19N cultures that faced a sudden pH shock (condition N57) with cultures adapted to pH 5.5 (N55) or 7.4 (N77) (i.e., N57 vs. N55 and N57 vs. N77, respectively), the number of proteins differentially abundant is smaller in both cases than for the comparison between N55 vs. N77. This is an expected situation, since in N57 the bacterial cells did not have the required time to adapt completely to the new pH condition (pH 7.4), as occurs in condition N77, when the inoculum pH was maintained and the metabolism had the opportunity to be re-routed showing abundance differences for more proteins.
In the case of N55 vs N57, there are 145 unique proteins with significantly different levels, 75 are increased in N55 (Figure 2B), of which 54 are also increased in N55 when compared with N77. The biosynthesis of betaine and the metabolism of phosphate are still increased in N55, probably being both processes quickly adjusted when 19N starts growing at pH 7.4. However, less proteins are involved the glycerolipid metabolism and the biosynthesis of folate were incremented, suggesting that these metabolic pathways require a longer time to respond to the pH change. Most likely due to the pH shock, other N55 processes had to be deactivated at N57 but not at N77. These include maintenance of redox homeostasis (5 oxidoreductases, SERP2129, SERP1917, SERP2165, SERP0244 and nfrA, were significantly reduced at N57), betaine membrane transport (SERP0246 and SERP2179), insertion of integral membrane proteins (SERP1356) and adjustment of the cell-wall protein composition (SERP2279, sdrH, gtf1). Interestingly, an endoribonuclease from the type II toxin-antitoxin system, MasF, only decreased at N57 relative to N55, was described as an inducer of bacterial dormancy (Bezrukov et al., 2021). Several processes were triggered at N57, most of them also incremented at N77 when compared to N55, such as metabolism of acetoin, PTS, pyruvate fermentation, transmembrane transport (including of hemin), and biosynthesis of purines, TCS, extracellular proteases.
Comparing conditions N57 vs N77, a total of 88 unique differentially abundant proteins were quantified, among them 47 proteins are increased in N77 (Figure 2C), of which 32 are also increased in N77 when compared with N55. From the 41 proteins increased in N57, 14 are not increased in N55 vs N77, those include four proteins related with the reshape of the cell wall (pbp1, vraR, ypfP, and SERP2383). SERP2383 is also involved in the transport of Zn, which could be associated with another increased protein (Fur) that regulates Zn uptake. String network analysis for conditions N55 vs N57 and N57 vs N77 are provided in Supplementary Figure 3.
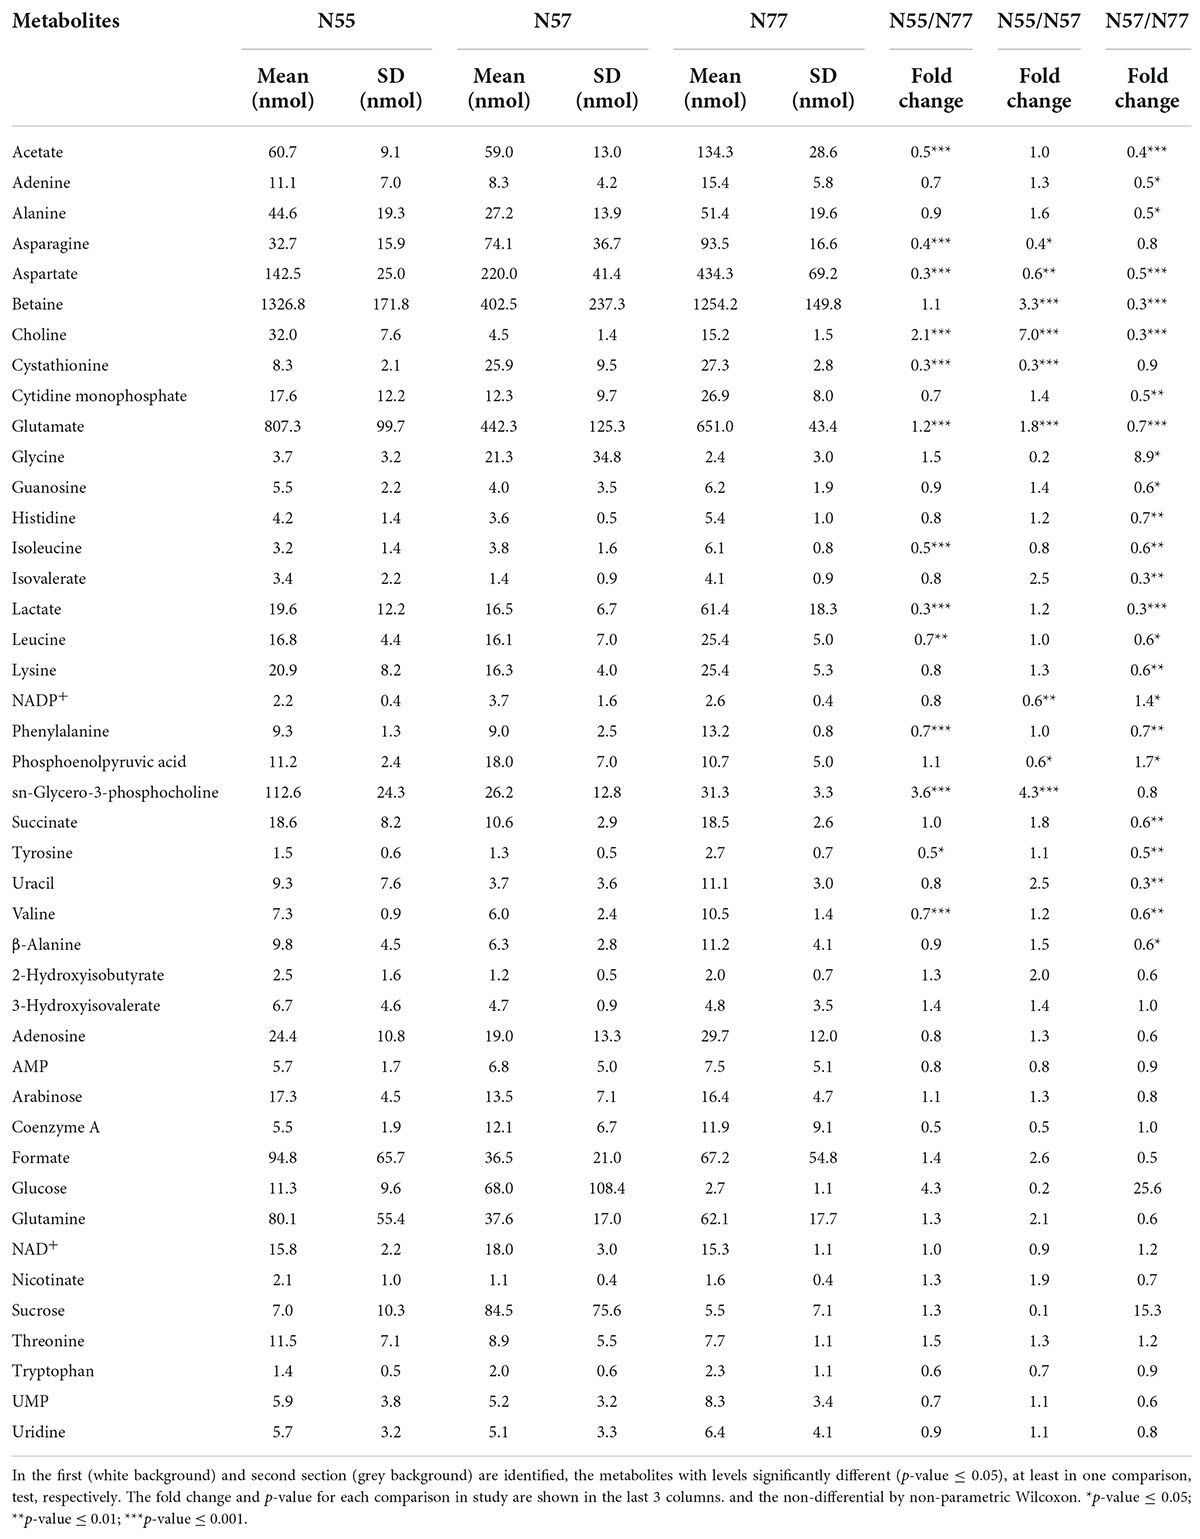
Differential metabolomic analysisA total of 48 metabolites were confidently identified and quantified for the S. epidermidis samples from the 1H-NMR spectra (Supplementary Figure 4). Most of the metabolites identified are amino acids (35%), carboxylic acids (16%), nucleotides and their constituents (14.5%), sugars (6%), and cofactors (6%). Univariate analysis of differentially accumulated metabolites between the three experimental conditions is summarised in Table 1.
TABLE 1
Table 1. Identified metabolites from S epidermidis 19N strain intracellular extract by 1H-NMR with respective levels in each experimental condition.
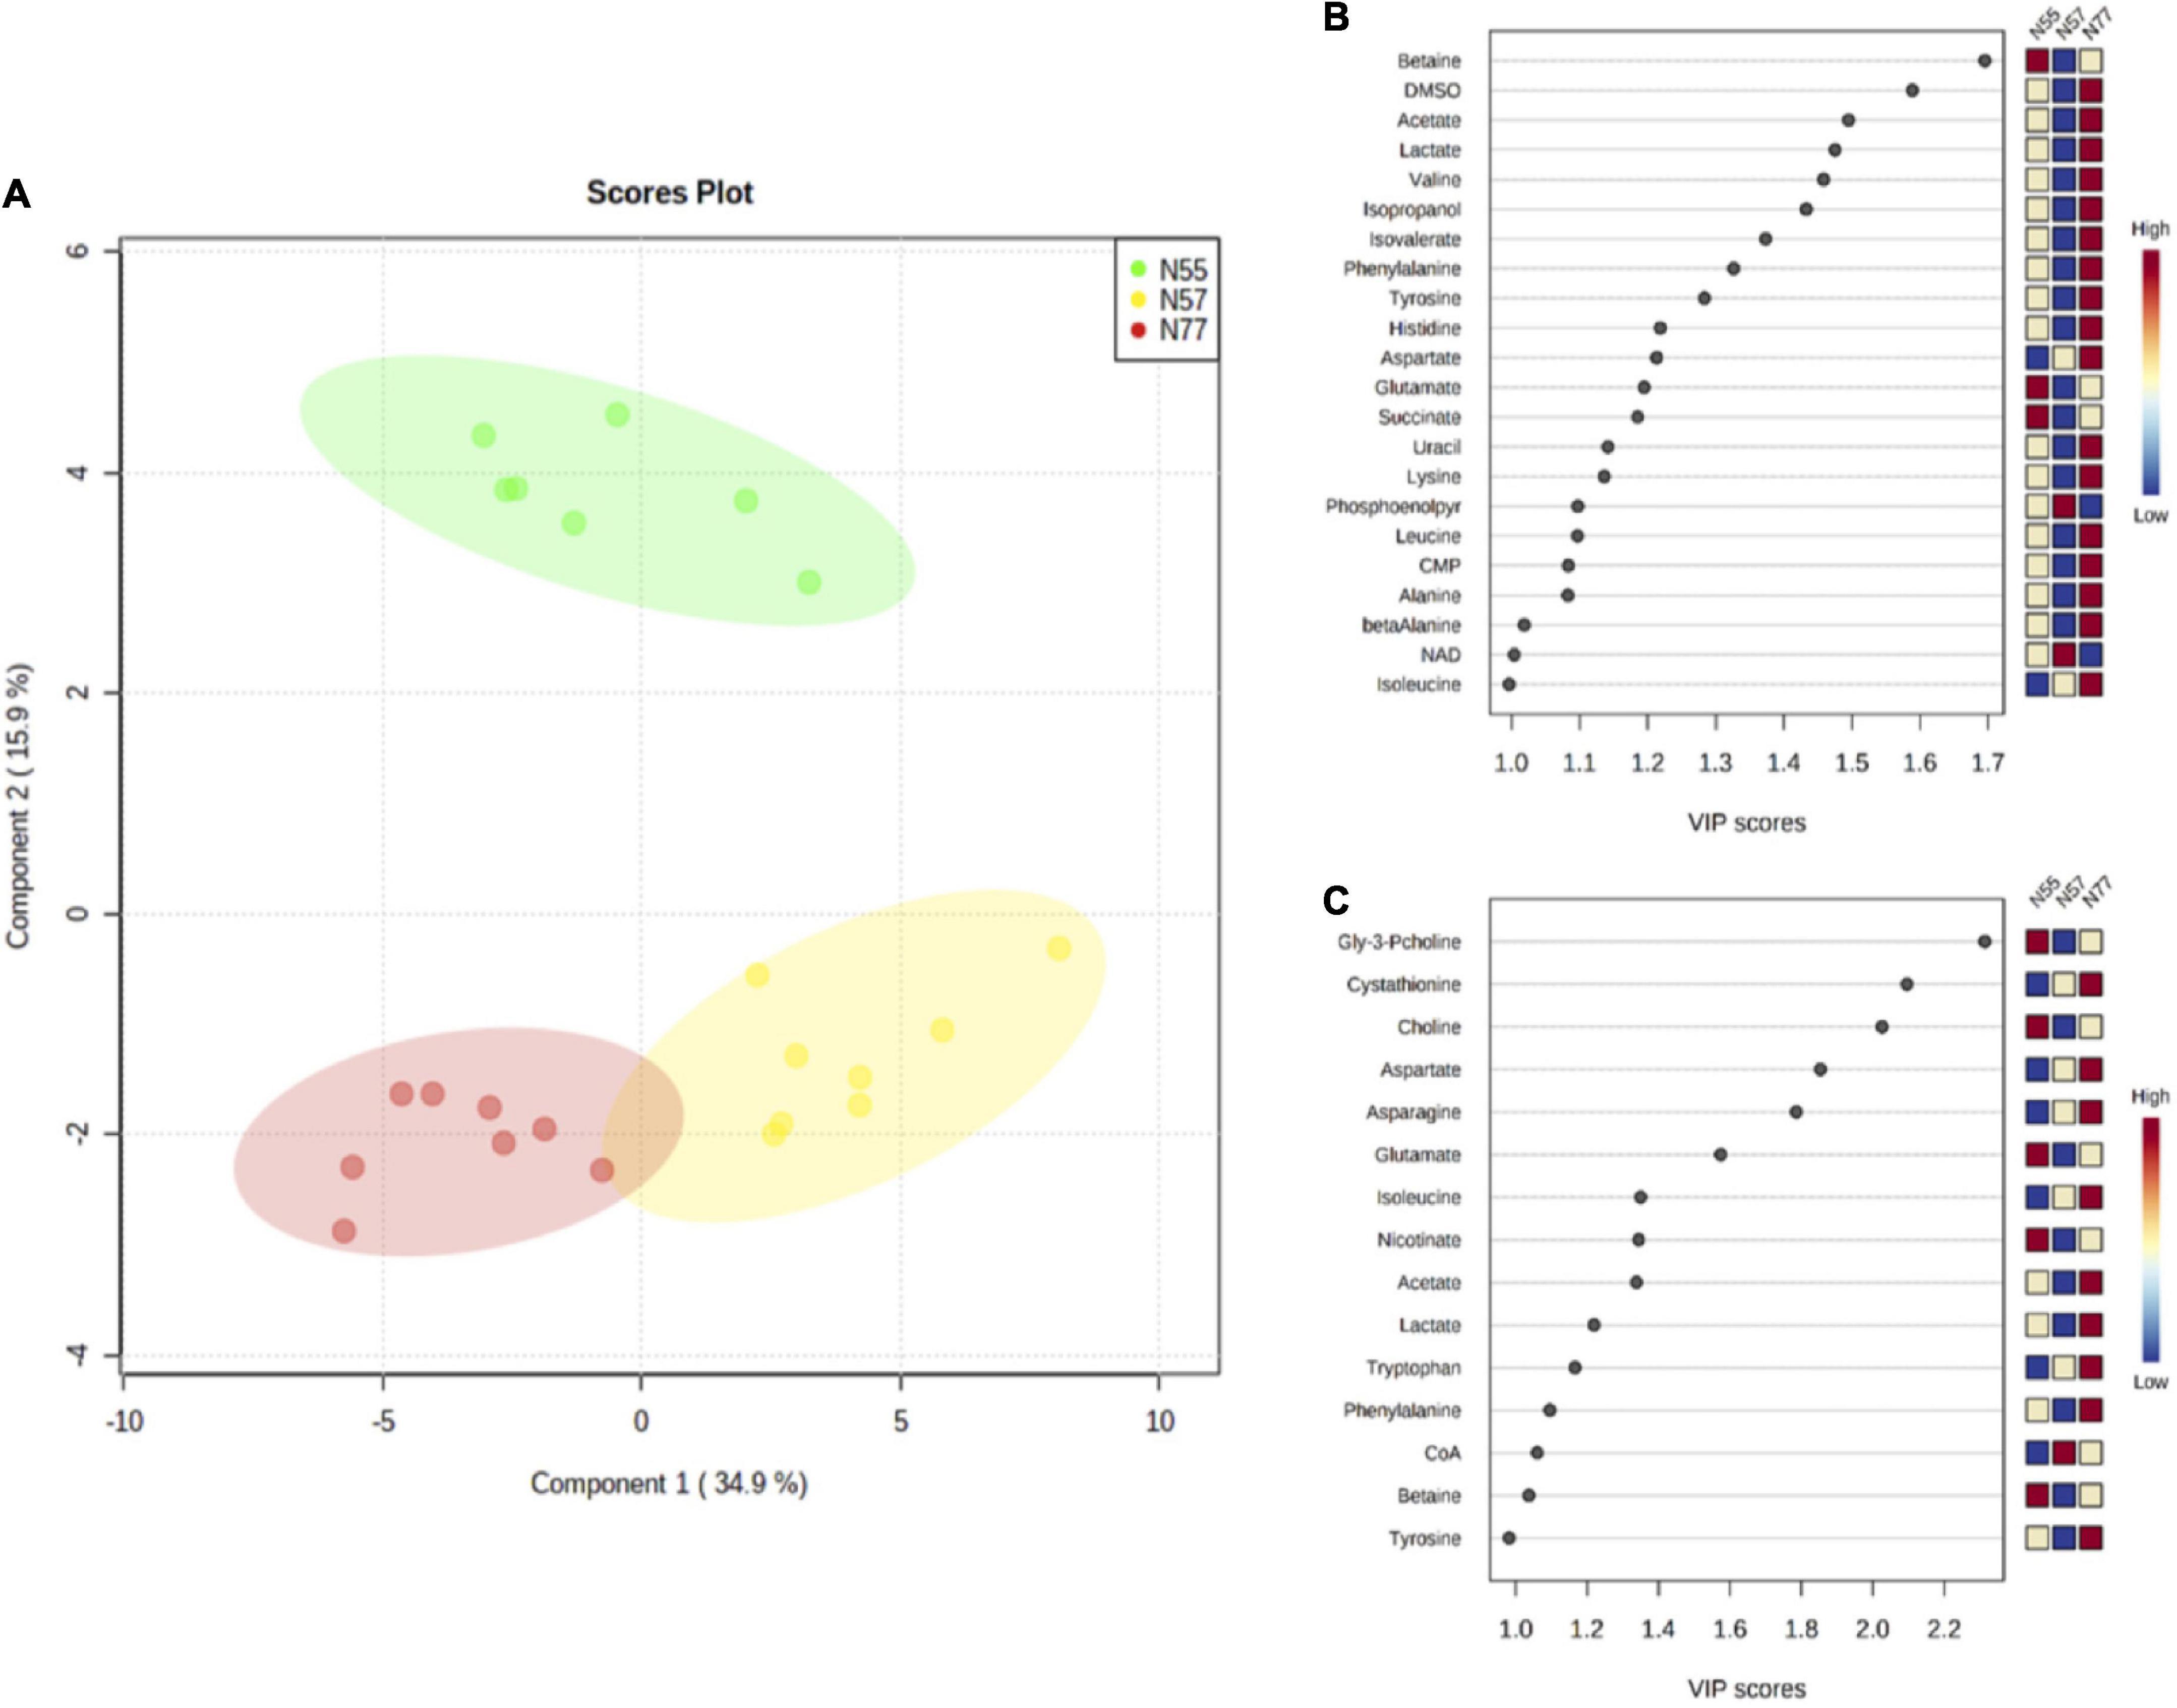
Metabolite levels were utilised to perform a multivariate analysis. The PLS-DA model discriminates the three conditions (Figure 5) with a R2 of 0.97 and a Q2 of 0.92 (the validity of PLS-DA was confirmed by 2000 permutation tests, Supplementary Figure 5). Principal components 1 and 2 explain 49% of the variance among the three experimental conditions. The separation between N77 and N57 occurs in the first component, while the discrimination between N55 and the other conditions occurs in the second component. The metabolites with a VIP score above 1 that contributed more for the discrimination among the three conditions in the first and second component are depicted in Figures 5B,C.
FIGURE 5
Figure 5. PLS-DA model based on metabolites concentrations for the three pH conditions. (A) PLS-DA scores plot of first and second component, showing the discrimination between the 3 experimental conditions, N55 (green) N57 (yellow), and N77 (red) (with 5 components: R2 = 0.97 and Q2 = 0.92) using the metabolites levels. Metabolites that most contribute for the separation of the groups based on its VIP scores (>1) for (B) the first component and, (C) the second component; the colour scale presents the metabolite relative levels among the three experimental conditions.
Metabolomic analysis at skin vs blood environmental pHWhen compared by a univariate analysis, using the non-parametric Wilcoxon test, there were 13 metabolites for which the levels were significantly different between N55 and N77 (Table 1 and Supplementary Figure 6). sn-Glycero-3-phosphocholine, glutamate and choline are increased at the skin pH; while the levels of acetate, asparagine, aspartate, cystathionine, isoleucine, lactate, leucine, phenylalanine, tyrosine and valine are significantly higher on blood pH. Beside the identified compounds, there are resonances from an unidentified NDP-sugar (anomeric resonance at 5.48 ppm) and an unidentified asparagine-like metabolite (resonances at 2.90, 2.98, and 4.00 ppm). The unknown NDP-sugar signals are increased at N55, while the unknown asparagine-like metabolite levels are higher at N77.
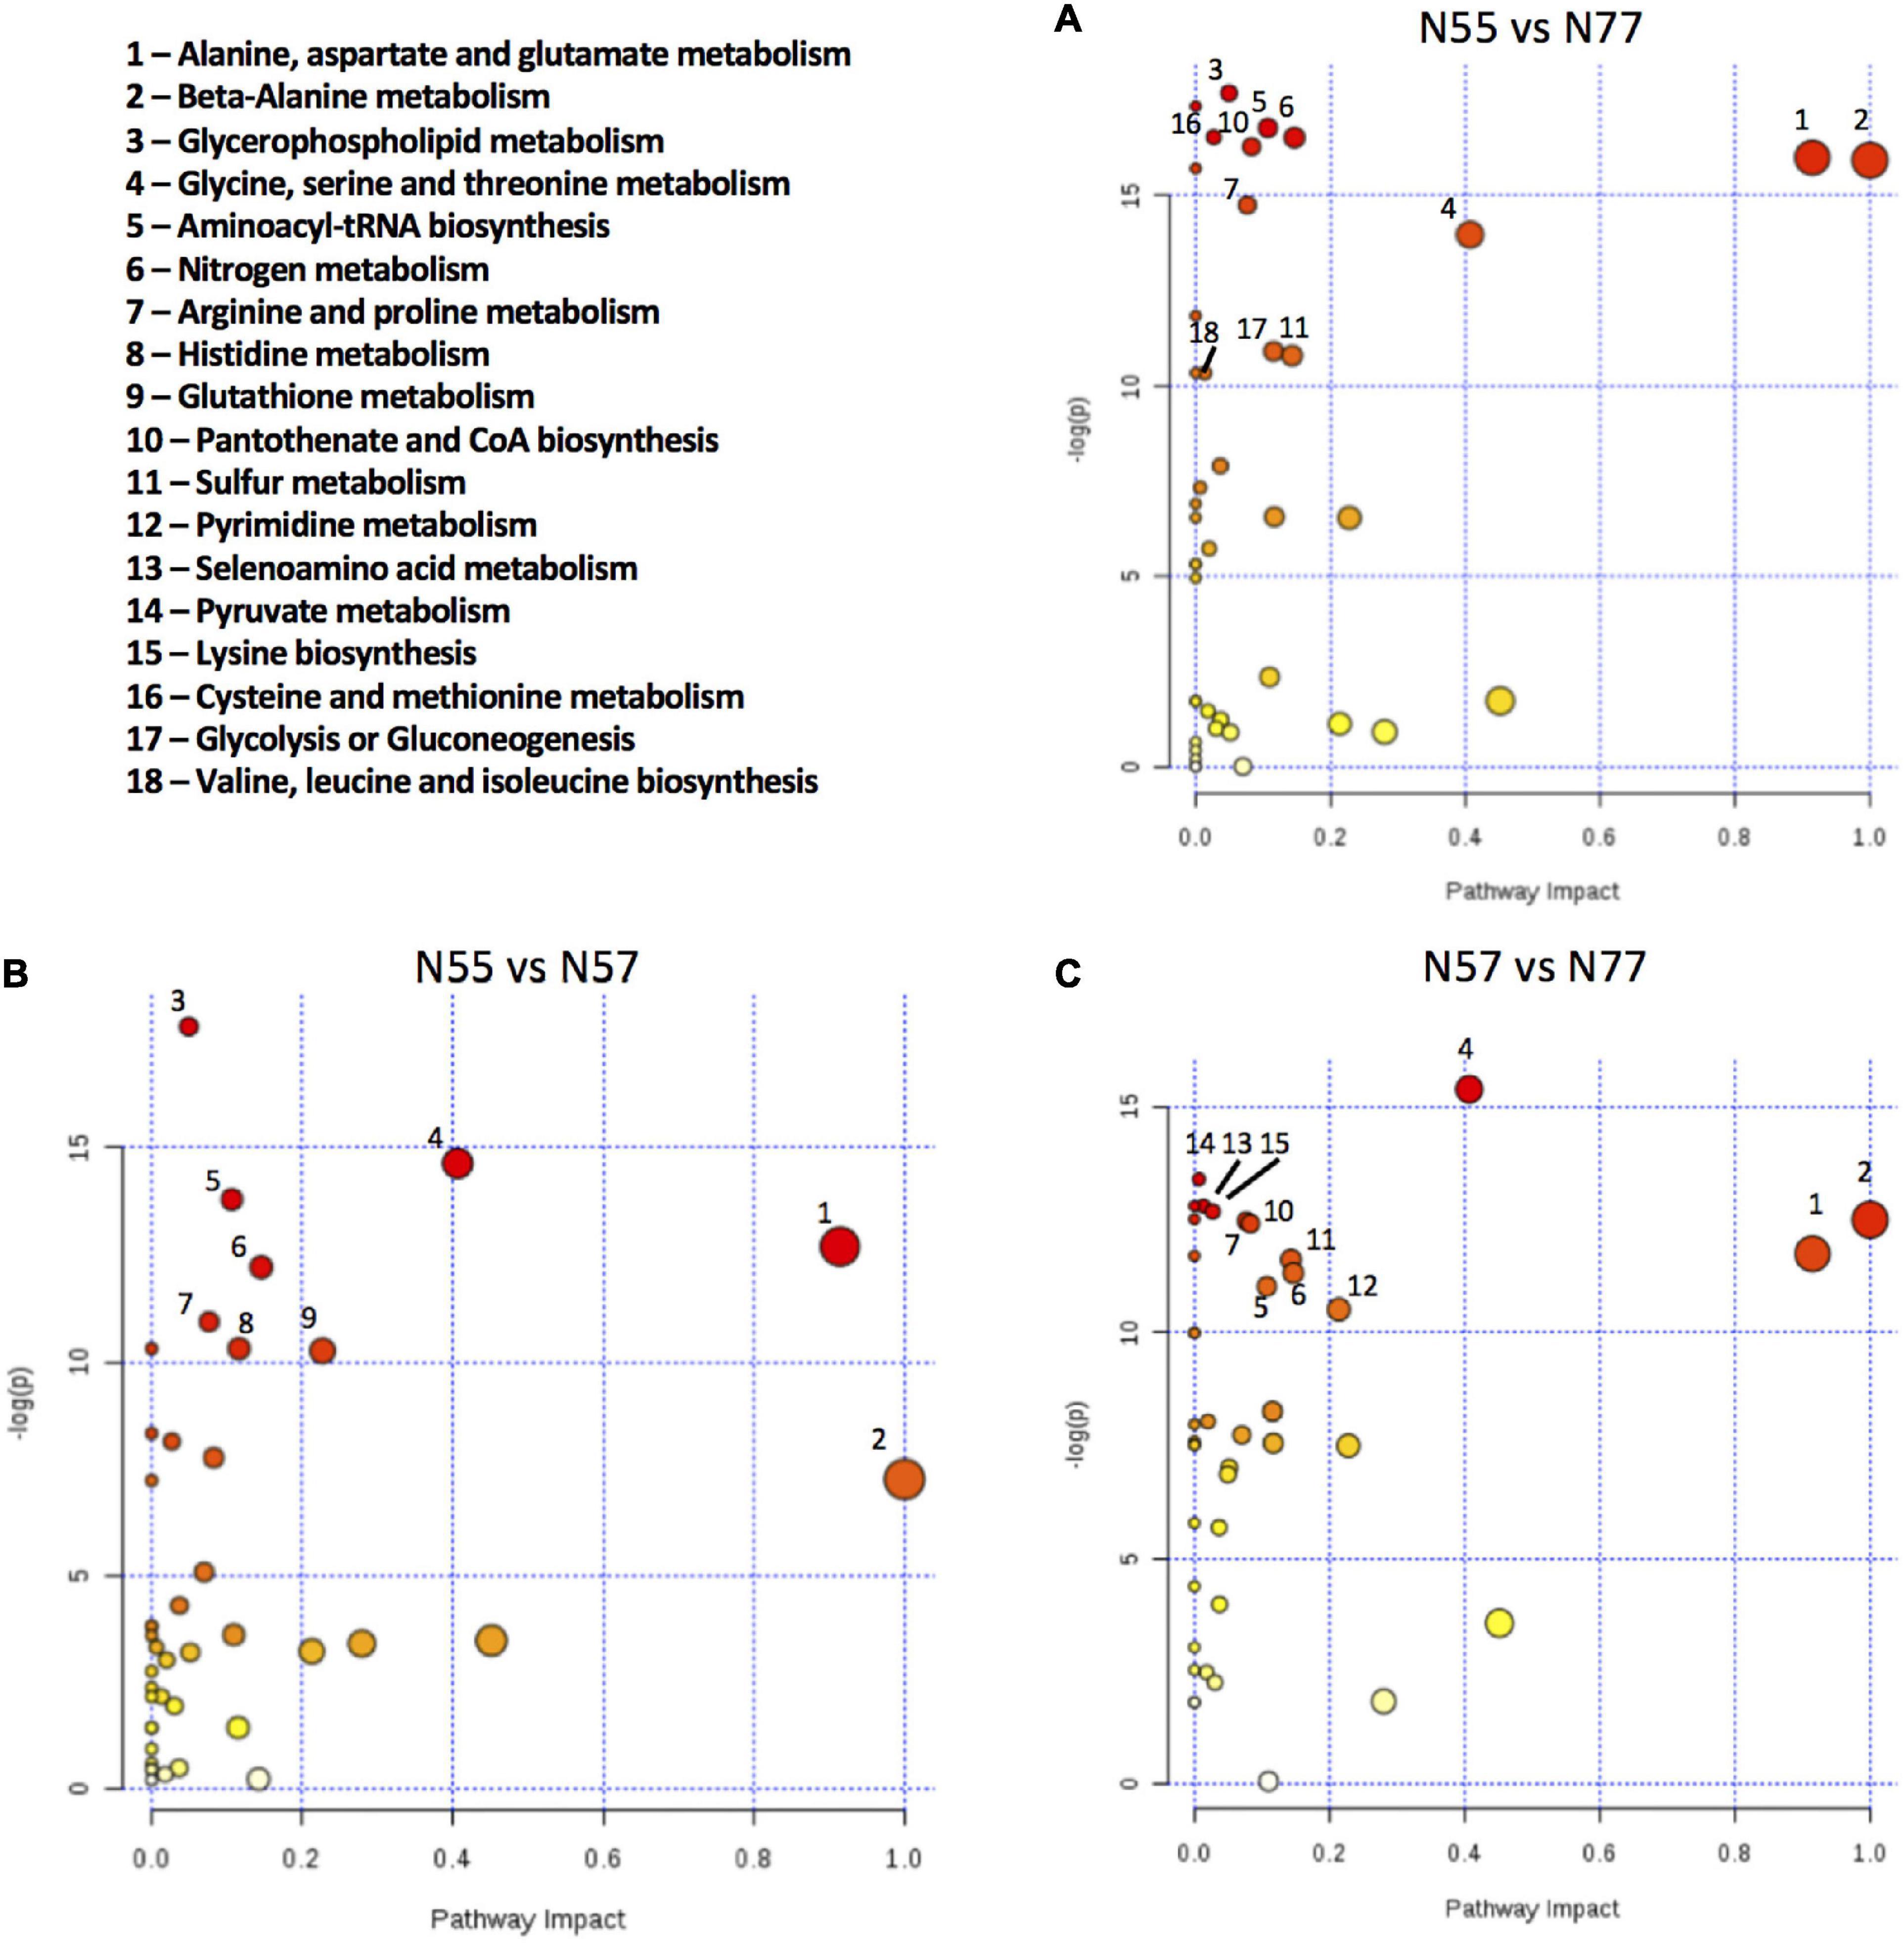
In order to identify the modulated pathways based on the metabolite concentrations and on the created experimental models we used the Pathway Analysis tool implemented in www.metaboanalyst.ca Comparing N55 vs N77, the most significantly altered pathways are related with amino acid metabolism, namely, alanine, aspartate and glutamate metabolism; β-alanine metabolism; glycine, serine and threonine metabolism; nitrogen metabolism; and arginine and proline metabolism (Figure 6A). These data indicate that amino-acid metabolism is an important process for S. epidermidis 19N strain to cope with pH alterations. Also, glycerophospholipid metabolism is altered when comparing S. epidermidis 19N grown at skin pH 5.5 with the blood pH condition N77, despite the reduce number of metabolites involved in glycerophospholipid metabolism (2 of 16) that were detect and quantified.
FIGURE 6
Figure 6. Metabolic pathways altered between the conditions based on metabolite concentrations. Pathway Analysis using the metabolite concentrations, performed in Metaboanalyst, of pairwise comparison among the 3 conditions: (A) N55 vs N77, (B) N55 vs N57, and (C) N57 vs N77; using Staphylococcus aureus N315 as a pathway library reference. Pathways named here obey the criteria of negative logarithm of p-value higher than 10 (y axis) and a pathway impact > 0, or pathway impact > 0.5 (x axis). Circle size is proportional to the pathway impact value and the colour to the -log(p) value, increasing from white to red.
Metabolomic comparison of pH shock adaptation vs blood and skin mimicking conditionsSome metabolites with significantly different levels between N55 and N77 conditions are also differential relative to these conditions when S. epidermidis 19N cells cope with a quick passage from skin to blood pH (condition N57). Variations were found for additional metabolites between N57 and N55 or N77 (Table 1 and Supplementary Figure 6). Those significantly decreased in N57 when compared with N77 are CMP, β-alanine, uracil, succinate, lysine, isovalerate, guanosine, and histidine. Interestingly, N57 presents the lowest levels of betaine and the highest of phosphoenolpyruvate, NADP+ and glycine compared with both N55 and N57. Betaine is an important compatible solute already identified in S. epidermidis, which is usually accumulated in stress conditions by several bacteria (Kunin and Rudy, 1991).
The pathway analysis performed for the comparisons N55 vs N57 and N57 vs N77 (Figures 6B,C) suggests that the major pathways influenced by these conditions are the same as the pathways with higher impact in the comparison N55 vs N77, namely alanine, aspartate and glutamate metabolism; β-alanine metabolism and glycine, serine and threonine metabolism.
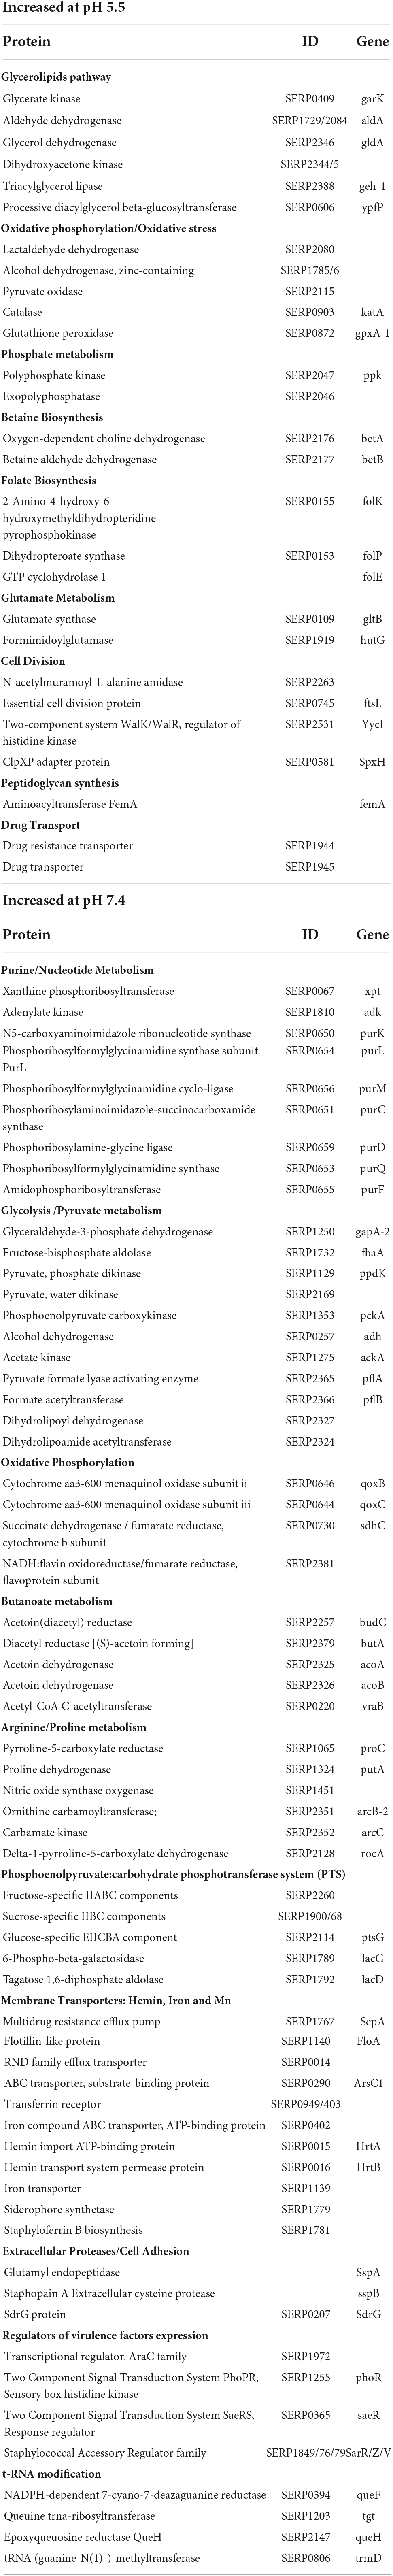
DiscussionStaphylococcus epidermidis is a commensal bacterial species that inhabits human skin, but when the skin barrier is broken and the immune system is immunocompromised it can cause life-threatening infections, which are difficult to treat (Chessa et al., 2016; Deplano et al., 2016). The most common S. epidermidis infections are associated to medical devices. In particular catheters, when introduced through the skin, can give access of skin bacteria to inner regions of the skin and the blood vessels. Catheter-related infections develop through the adhesion of these bacteria to device’s surface followed by the production of biofilms. During the transition from skin to blood, S. epidermidis faces multiple environmental changes, but how this bacterium adapts to these changes during infection development and how these contribute to disease is still elusive. One of the factors that constantly changes from skin to the blood and that has been described to be used by bacteria as a signal to remodel bacterial physiology, is the pH. Our hypothesis was that pH change is a key factor for S. epidermidis disease development. To test this hypothesis, we analyzed the effect of pH on the metabolism of a commensal S. epidermidis strain (19N) through differential proteomics and metabolomics. To mimicking skin we grew S. epidermidis at pH 5.5 (N55); to mimic blood we grew S. epidermidis at pH 7.4 (N77); and to simulate the beginning of the infectious process, we exposed bacteria to an abrupt pH shift from skin to blood (pH 5.5 → 7.4; N57). The more relevant differential proteins between these three conditions and their metabolic and cellular functions are compiled in Table 2. The results obtained reflect the response of S. epidermidis to a change in pH that is similar to the one that it faces when it goes from the skin into the blood. However, the assay conditions are far from mimicking the complex skin and blood environment. As a result, some of the pathways and functions that changed in our experiment might be specific of the growth conditions tested. On the other hand, some of the pH induced changes that occur in vivo might have been missed.
TABLE 2
Table 2. Functional analysis of differentially abundant proteins between N55 and N77 conditions.
S. epidermidis metabolic and biological activities induced at skin pH Promotion of bacterial growthWe found that S. epidermidis 19N at the skin pH had a shorter lag phase, a faster growth rate and reached a higher biomass level when entering the stationary phase (see Supplementary Figure 1) than at blood pH. These results suggest that this strain has a higher fitness at pH 5.5. This is not surprising, given the commensal nature of the 19N strain, and is in accordance with previous data, wherein S. epidermidis strains from B clonal lineage were shown to have higher growth rates when exposed to acidic pH (Espadinha et al., 2019). However, our results contrast with those obtained by Iyer et al. who observed that another S. epidermidis strain belonging to the A/C cluster (S. epidermidis ATCC12228) was insensitive to increasing pH values (pH 5–7) (Iyer et al., 2021). This discrepancy may be explained by the fact that the assays were performed with an A/C cluster strain, with distinct growth conditions: in that case the growth was performed in a microtiter plate.
Differential analysis of the S. epidermidis proteome and metabolome identified significant variations in the metabolic and cellular processes between N55 and N77 conditions, suggesting that this pH shift is an important signal for S. epidermidis metabolic reprogramming (Figure 7).
FIGURE 7
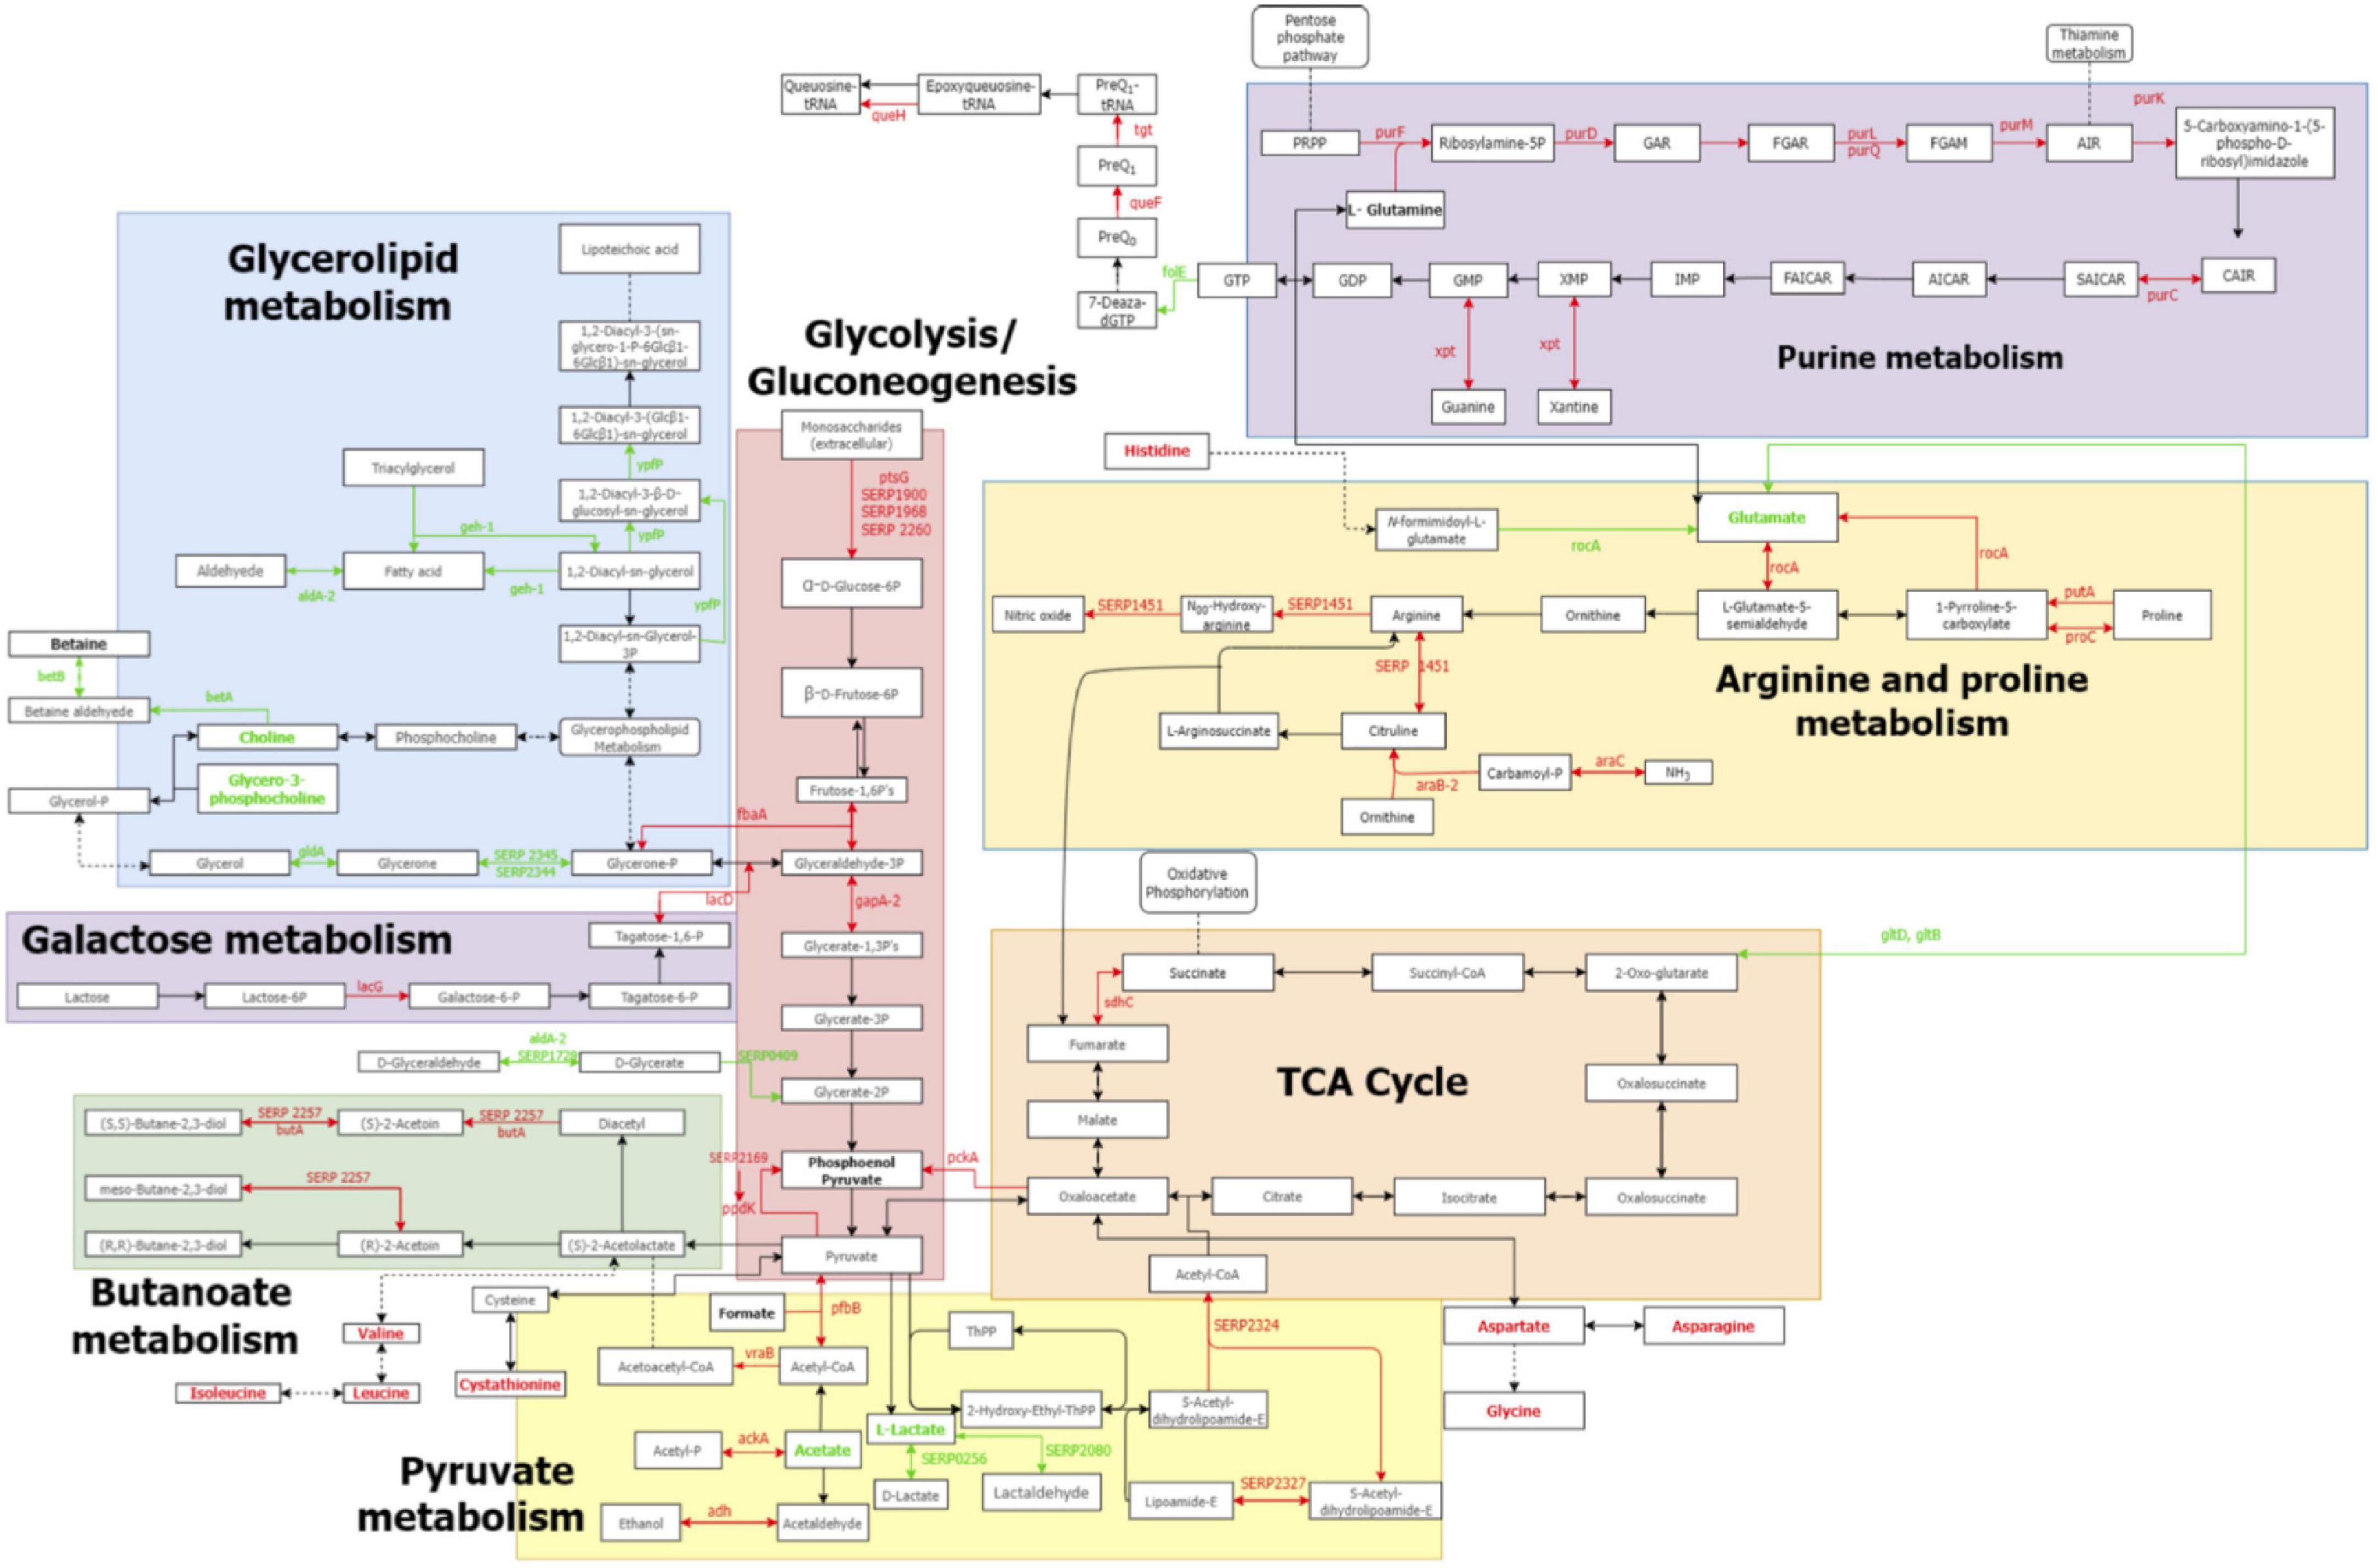
Figure 7. Metabolic pathways altered between N55 vs N77 based on the proteomic and metabolomic data. Reconstruction of the principal metabolic pathways that changed in S. epidermidis 19N when growth at blood pH (N77) when compared with skin pH (N55). Names of metabolites and enzymes increased in N77 are in red, while those increased in N55 are in green. Metabolites determined in the study but that do not show significant differences are in black, while metabolites undetected are in grey. Full arrows represent reactions, dashed arrows represent connections with other pathways or hidden reactions.
The increased growth rate at pH 5.5 observed in this study was corroborated by the proteomic data obtained, in which several proteins involved in peptidoglycan synthesis, cell division and DNA replication were overrepresented in N55 conditions. This is the case of a homologue of FemA, an important enzyme for the synthesis of peptidoglycan pentaglycine bridge (Hegde and Shrader, 2001); N-acetylmuramoyl-L-alanine amidase (Sle1) (Fold Change = 22), FtsL, Yycl (Takada and Yoshikawa, 2018) and SpxH (Awad et al., 2019), involved in cell division; and SERP2046/SERP2047 and FolK/FolP which are associated to the biosynthesis of triphosphate nucleotides (Bowlin and Gray, 2021) and folate, two factors relevant for DNA synthesis.
Cellular membrane composition remodellingA metabolic pathway that was activated at the skin pH was that associated to the metabolism of phospholipids. This is a vital facet of bacterial physiology that begins with the synthesis of the fatty acids by fatty acid synthases and ends up in cellular membrane biogenesis (Zhang and Rock, 2008). Membranes are formed by glycerophospholipids, composed of two fatty acids, a glycerol moiety, a phosphate group and a variable head group. Attached to the cell membrane of Gram-positive bacteria are lipoteichoic acids (LTA), an alditolphosphate-containing polymer that is linked via a lipid anchor to the membrane. It has been previously described that bacteria change the composition of fatty acids or the head groups in the glycerophospholipids in response to several abiotic stresses, modifying the membrane proprieties, like fluidity and charge (Willdigg and Helmann, 2021). Moreover, membrane-linked LTA, can suffer different modifications, including the addition of d-alanyl and glycosyl residues in S. aureus, which can alter their charge, adhesion proprieties and interaction with human host immunity (van Dalen et al., 2020).
When the 19N strain was grown at acidic pH we observed that the levels of enzymes and metabolites involved in glycerolipids and fatty acids metabolism and in lipoteichoic acids biosynthesis were increased. Among these were enzymes responsible for the synthesis of glycerophospholipids precursors, (AldA, GarK, GldA and SERP2344/5). Additionally, we observed the accumulation of choline and glycero-3-phosphocholine, building blocks of glycerolipids. Similarly, we observed that enzymes catalysing the removal of fatty acids from di- and triacylglycerols (Geh-1 and YpfP) were accumulated at the acidic pH, suggesting the occurrence of fatty-acid and LTA composition remodelling in this condition. This is in accordance with a previous report in which Streptococcus mutans strains increased the levels of monounsaturated and longer-chain fatty acids in its membrane to increase membrane fluidity when exposed to acidic pH (Quivey et al., 2000). On the other hand, changes in lipoteichoic acids amount and composition may have implication in both cell division via regulation of autolytic cell wall enzymes (muramidases) and in protection against cationic antimicrobial peptides (Percy and Gründling, 2014), which are part of the innate immunity in human skin. Overall, our results indicate that S. epidermidis respond to acidic stress by increasing the biosynthesis of cell membranes, probably as a result of an increased growth and cell division at this pH, and by remodelling the cellular membrane composition.
Induction of protection against other skin abiotic stressesSkin is a harsh environment for bacteria to live in. In the skin bacteria will have to cope with multiple abiotic stresses like acidic pH, osmotic stress promoted by the high salt concentration, oxidative stress induced by UV exposure, mechanical and chemical stresses by external factors, the presence of antimicrobial peptides and nutrient limitation.
We found that S. epidermidis response to skin acidic stress (pH 5.5) included the induction of pathways associated to response to other abiotic stresses of the skin, like osmotic and oxidative stress. This was the case of the production of choline, a compatible solute (Kunin and Rudy, 1991; Graham and Wilkinson, 1992) described to be associated to resistance to osmotic stress (Kunin and Rudy, 1991; Graham and Wilkinson, 1992; Peddie et al., 1998). Besides, this metabolite is also a precursor of other compatible solutes like betaine. In our study, we observed that betaine levels were very similar in the two pH conditions tested, however, the two dehydrogenases (BetA and BetB) involved in betaine synthesis from choline were incremented in the skin pH. Similarly, we observed that at the skin pH, proteins involved in protection against oxidative stress (KatA and GpxA-1) were also induced.
Our results suggest that the low pH of the skin is a signal for the production of metabolites and proteins that protect against other skin abiotic stresses like osmotic and oxidative stress.
Accumulation of glutamateWhen grown in condition N55, S. epidermidis showed the accumulation of glutamate and higher levels of glutamate synthase (GltB and GltD) and formimidoylglutamase (HutG) (Kocianova et al., 2005). These enzymes are involved in the synthesis of glutamate from 2-oxoglutarate and N-formimino-L-glutamate, respectively, linking the increase in glutamate with TCA cycle and histidine degradation. Simultaneously the level of the enzyme responsible for the introduction of glutamate into the transformation of proline to ornithine (RocA) is also diminished, contributing to the described glutamate increase at N55. This regulation of the urea cycle allows to reduce the consumption of NH3, making it more available to increase the levels of ammonium ion contributing to intracellular pH increase. Glutamate is a key metabolite in Staphylococcus metabolism, being pivotal in the connection between different metabolic pathways. In particular, glutamate was shown to be an important factor for S. aureus survival under acidic conditions (Yee et al., 2019). Moreover L-glutamate is the precursor of poly-γ-glutamate (PGA), a L-glutamate and D-glutamate polymer, that was found to confer resistance to the host innate immunity, namely to antimicrobial peptides, and to protect S. epidermidis from high salt concentrations, key features of its natural environment - the human skin (Kocianova et al., 2005).
Membrane transportersMembrane transporters profile is also altered by the growth at the two different pHs. At skin pH, the levels of two multidrug transporters, SERP1944 and SERP1945, are increased. The function of these transporters is unknown, but it was observed that in the presence of dimeric isoquinoline, an antibiotic, SERP1944 transcripts are increased in S. epidermidis (Cecil et al., 2011). Also, a transporter involved in the copper export, CopA, is increased in this condition. CopA is responsible for the copper export in diverse Staphylococcus species, protecting the organism from the copper antimicrobial effects and being important for copper homeostasis (Kaur et al., 2022).
Generation of chemical energyThe main generators of reducing power at the skin pH were most probably lactaldehyde dehydrogenase (SERP2080) and a zinc-containing alcohol dehydrogenase (SERP1785/6) that were accumulated in this condition. The mechanism were they are involved may generate a higher extrusion of intracellular protons (Korem et al., 2010), and is in accordance with the increment of pyruvate oxidase (SERP2115) involved in menaquinone biosynthesis, also associated with a more active oxidative phosphorylation.
Staphylococcus epidermidis metabolic and biologic activities induced at blood pH Production of chemical energyOne of the most significant changes observed at blood pH was in the central metabolism, including the increase of enzymes involved in glycolysis, pyruvate metabolism and oxidative phosphorylation. These pathways constitute the main means of cellular production of redox potential and ATP that are the major sources of energy for bacteria.
In particular, at blood pH, we observed an increase in the abundance of the phosphoenolpyruvate-dependent sugar phosphotransferase system (PTS)— a major carbohydrate active-transport system that transfers the phosphoryl group of phosphoenolpyruvate to incoming sugar substrates concomitantly with their translocation across the cell membrane. Four proteins from this system (PtsG, SERP1900, SERP1968 and SERP2260) specific for glucose, sucrose and fructose transport, and enzymes generating phosphoenolpyruvate from oxaloacetate (PckA) and pyruvate (PpdK and its regulator SERP2169) support the fuelling of glycolysis in the N77 condition. This is in accordance with the increment at N77 of two proteins from the lactose catabolic process via tagatose-6-phosphate (LacD and LacG). However, the only two metabolites directly involved in glycolysis and TCA cycle that were possible to quantify in our metabolomic analysis, namely phosphoenolpyruvate and succinate, were not significantly different between skin and blood pH conditions.
Other proteins that were increased in N77 condition were several membrane dehydrogenases (GapA-2, SdhC, SERP2324/7, SERP2327, QoxB, and QoxC), suggested by Uribe-Alvarez et al. (Uribe-Alvarez et al., 2016) to be electron donors to menaquinone, the quinone known to be utilised for respiration in S. epidermidis.
In addition to glycolysis, pyruvate metabolism (see Figure 7) was also more active at blood pH, with several enzymes (AckA, Adh, PflB, PflA, and VraB) more abundant at N77. Moreover, the production of acetate and lactate, by-products, or final products of the pyruvate metabolism, were also increased at N77, indicating that in this condition the cells, although in aerobiosis, are also using fermentation to generate energy. Actually, in blood, oxygen is less available to bacteria than in the skin. Thus turning on the fermentative pathway might be an adaptive response that allows S. epidermidis to adapt better to blood/infection environment. Additionally, S. aureus growing in biofilms, considered a micro-aerophilic environment, also accumulate these acid fermentation products. To counteract the consequent drop in cytoplasmic pH driven by these acids, S. aureus is described to induce the activation of butanoate pathway (Zhu et al., 2007)—a system that regulates the NAD/NADH ratio and promotes carbon storage (Vasu et al., 2015). In our study we observed a similar response, wherein proteins involved in butanoate pathway (ButA, SERP2257, SERP2325 and SERP2326) were also accumulated at blood pH when compared to skin pH.
Overall, our results suggest that there is a higher amount of available cellular energy at pH 7.4 than at pH 5.5. Our hypothesis is that S. epidermidis is adapted and optimised to live on the skin, wherein energetic requirements are set to the minimum, whereas exposure to blood pH is an accidental stress that to be resolved requires extra energy levels.
Activation of nucleotide metabolismAnother metabolic pathway that was incremented at blood pH conditions was the synthesis of nucleotides (Figure 7). Nucleotide metabolism plays a crucial function in bacterial physiology, producing the nucleic acids needed for DNA replication and RNA transcription. In addition, nucleobases also constitute the molecular basis of cellular energy molecules such as ATP and NADH, and many coenzymes are derived from nucleobase monomers. The triggering of the nucleotide metabolism at blood pH is thus in accordance with the observed increase of proteins involved in cellular energy production, described above. Also is illustrative of an active cellular metabolism.
Particularly we observed an increase of proteins within pathways associated to the synthesis of purines. These included five of the seven enzymes that convert L-glutamine into the purine 1-(5-Phospho-D-ribosyl)-5-amino-4-imidazolecarboxylate (CAIR), and xanthine phosphoribosyltransferase (Xpt) that catalyzes the conversion of the purine xanthine to its monophosphate form—a metabolite that can then be reused for the synthesis of several RNA forms involved in protein biosynthesis. However, the quantified metabolites participating in these pathways, like glutamine, adenine, guanosine and adenosine, were not found differentially accumulated in none of the pH conditions tested. The increase in purine metabolism was previously described to be crucial for growth in blood and for the infection process of different bacteria like S. aureus (Connolly et al., 2017; Li et al., 2018), Escherichia coli, Salmonella enterica, and Bacillus anthracis (Samant et al., 2008). On the other hand, it was also reported in Bacillus subtilis that one of the consequences of intracellular acidification is the loss of purines and pyrimidines from DNA at a greater rate than at neutral pH (Lindahl and Nyberg, 1972), what might explain the low levels of enzymes involved in purine synthesis in the acidic skin pH.
Our data indicate that exposure of the S. epidermidis commensal to blood pH triggered a similar change toward a more active and pathogenic-like purine metabolism.
Induction of tRNA modificationWe additionally observed that exposure of S. epidermidis to blood pH induced the pathways associated to the modification of tRNA. tRNAs are key factors in protein synthesis, establishing the link between the messenger RNA (mRNA) and the amino acids chain that make up a protein. tRNA modifications constitute an extra layer of protein synthesis regulation, being implicated in the accuracy and efficiency of decoding, on inhibition and induction of toxins and proteins of the translation apparatus, and in the monitoring of tRNA integrity and stability. Moreover, their roles during adaptation to environmental stresses and to infection have started to be acknowledged. Recent examples of tRNA modifications regulating host-pathogen interactions include the regulation of immune responses, antibiotic resistance, expression of virulence genes, and bacterial persistence (Antoine et al., 2021). The most modified region of tRNA is the anticodon stem loop (ASL). In particular tRNA modifications in this region have been implicated in the expansion and restriction of the decoding properties of a given tRNA.
In our study we found that the growth at a higher pH induced the biosynthesis of enzymes involved in tRNA modifications occurring in the ASL region, namely those associated to the replacement of a guanosine by a queuosine (QueF, QueH and Tgt) and to guanine methylation (TmrD). These modifications have been described to be implicated in virulence and response to environmental conditions in different bacterial species. An example of this interaction was observed in Shigella flexneri, wherein a link was established between the reduction of Tgt homolog activity and a decrease in pathogenicity (Durand et al., 2000). Moreover, the ratio between queuosine and its precursor levels, was shown to be regulated by O2 availability in E. coli and Salmonella enterica, which led to the proposal that tRNA modification can be a marker of cellular oxygen requirements (Edwards et al., 2020). On the other hand, the methylation of tRNA guanine 37 promoted by TmrD was found to be essential in diverse pathogenic bacteria, like Pseudomonas aeruginosa, S. enterica, Streptococcus pneumoniae and E. coli because it suppresses translational frameshift errors at proline codons (Edwards et al., 2020).
Our results suggest that S. epidermidis growth at pH 7.4 induced tRNA modifications that are essential to guarantee the fidelity of protein synthesis, but that simultaneously can turn on the pathogenicity pathways and prepare S. epidermidis to the low-oxygen environment of the blood.
Activation of amino acids synthesis and catabolismAmino acids, besides being the building blocks of protein synthesis, are important for sustaining cell integrity and metabolic homeostasis, and are precursors in the synthesis of other molecules (Halsey et al., 2017; Alreshidi et al., 2019). Also they have been described to have a role in cell signalling, stress protection, energy production and host-pathogen interactions (Christgen and Becker, 2019).
In condition N77, we observed that many amino acids such as leucine, isoleucine, valine, glycine, aspartate, asparagine, phenylalanine, and tyrosine were present in a higher concentration than in N55 condition, suggesting the existence of an active metabolism involving these amino acids at the higher pH. These results are in accordance with previous data obtained for S. aureus, for which the total amount of free amino acid levels was described to be higher at pH 7 when compared to a lower pH (Alreshidi et al., 2016; Murphy et al., 2018). These amino acids might be fuelling the synthesis of new proteins to adapt to higher pH. Additionally, they might be being used as carbon sources for energy production.
Actually, we found that a higher amount of the enzymes involved in proline synthesis (ProC) and catabolism (PutA and RocA) was produced at pH 7.4, when compared to pH 5.5 (Figure 7; Halsey et al., 2017). Proline catabolism was recently demonstrated by Fey and coworkers to be important for S. aureus growth, particularly during infection. This is believed to be due to the fact that glucose can become limited in an infectious situation, and proline can function as an alternative source of carbon and energy to the TCA cycle. In S. epidermidis infections, the proline-rich host matrix protein collagen is one of the first to cover the surface of the catheters and prosthesis and the induction of the collagen catabolism may be used as a survival strategy in the low nutrient environment of the infection.
Induction of virulence factorsBecause it is mainly a commensal bacteria, S. epidermidis does not contain many virulence factors, when compared to other more pathogenic staphylococcal species like S. aureus. The majority of virulence factors are associated to adhesion, biofilm formation and evasion of human immune system. In this study when we grew S. epidermidis in pH 7.4 we observed that many systems regulating virulence in S. epidermidis as
留言 (0)