Animals
Female C57BL/6 mice and MRL/lpr mice at age 6–8 weeks were purchased from The Jackson Labs (Bar Harbor, USA). Mice were placed in the SPF facility of the animal center of Nanjing University School of Life Sciences and reared at room temperature 25 ± 2 ℃, relative humidity 65 ± 2%, and a 12 h light / dark cycle. The mice were reared in an animal facility for one week before the experiment.
Mouse nephritis model was induced in an 8-week-old female C57BL/6 mouse by a single intraperitoneal injection of 500 μl of pristane oil (2,6,10,14-tetramethylpentadecane, Sigma-Aldrich, USA).
Macrophage isolation from MRL-lpr mice kidney
Kidneys were processed as previously described [20], and the cell pellet was resuspended in D-hanks containing 0.5% BSA and 2 mM EDTA. Anti-F4/80 coated MACS beads (Miltenyi, Germany) were used to sort macrophages.
Flow cytometry analysis for macrophages
Macrophages were resuspended and blocked for 30 min in D-hanks with 2% BSA. The cells were then incubated with 1:500 diluted FITC-anti-F4/80, or FITC-anti-CD206 and PE-anti-CD86, or FITC-anti-B7H4 or FITC-anti-CD138 antibody (BioLegend; San Diego, CA) for 45 min (room temperature and protected from light). The cells were then washed with D-hanks twice and resuspended in D-hanks with 2% BSA for flow cytometry analysis. The cells incubated with FITC-Isotype or PE-Isotype (BioLegend) were used as the isotype control. The gating strategy is shown in Additional file 1: sFig 1A.
Western blot analysis
Cells were washed with PBS twice and lysed. Protein samples were extracted and then separated on a 4–12% precast Bis–Tris gel (Thermo Fisher Scientific). Later proteins were transferred to polyvinylidene difluoride (PVDF, Rancho Palos Verdes, USA) membranes. The membrane was blocked for 1 h in TBST (with 5% nonfat milk) and incubated with primary antibodies overnight at 4 ℃. Proteins were evaluated by using primary anti-iNOS and anti-Arg-1 (Cell Signaling, MA) antibodies. Membranes were washed with TBST 3 times (a total of 45 min). The washed membranes were incubated with second antibodies for 1 h, at room temperature. Enhanced chemiluminescence reagents were used to illuminate protein and ImageQuant ™ LAS 4000 Luminescent Image Analyzer (GE Healthcare; Chicago, IL) was used to expose protein bands.
ELISA assays
The conditioned medium (CdM) was collected to evaluate the concentration of cytokines. Levels of certain cytokines, including IFN-γ, IL-1β IL-6, IL-12, GM-CSF, IL-10, TGF-β, and M-CSF, were evaluated by using ELISA kits (R&D Systems). The procedures for the cytokine and growth factor assays were carried out according to the manufacturer's instructions. The Molecular Devices SpectraMax spectrophotometer (Marshall Scientific, Hampton, NH) was employed to measure the concentration of cytokines.
Detection of reactive oxygen species
ROS was detected by using Amplex Red Hydrogen Peroxide/Peroxidase Assay Kit (Molecular Probes, Grand Island, NY) according to the manufacturer’s instructions. Briefly, the macrophage-conditioned medium was collected, and the absorbance was checked by using the Molecular Devices SpectraMax spectrophotometer. The results were normalized to a standard curve.
Phagocytosis assays
Mouse kidney epithelial cells (TCMK-1) were incubated with heat shock (45 ℃, 10-min) and cultured for 4 h to induce apoptosis as described previously. The percentage of apoptotic cells was evaluated by flow cytometry. The apoptotic cells were washed with PBS twice and labeled with pHrodo Red (Life Technologies). Then, the 1 × 10 [6] cells were added to 1 × 10⁶ macrophages to determine the phagocytotic capacity. After, being incubated for 2.5 h at 37 ℃, the macrophages were washed three times with ice-cold D-hanks and stained with FITC rat anti-mouse CD11b antibody (BioLegend, USA) for 45 min at 4 ℃. Then, the cells were harvested and examined by flow cytometry.
Flow cytometry analysis for T cells
The cell suspension was blocked for 30 min in D-hanks with 2% BSA. The cells were then incubated with 1:500 diluted FITC-anti-Foxp3, or PE-anti-CD3, or PE/APC-anti-CD4, or APC-anti-IL-17 antibody (BioLegend; San Diego, CA) for 45 min (room temperature and protected from light). The cells were then washed with D-hanks twice and resuspended in D-hanks with 2% BSA for flow cytometry analysis. The cells incubated with FITC-Isotype or PE-Isotype or APC-Isotype (BioLegend) were used as the isotype control. The gating strategy is shown in Additional file 1: sFig 1B.
Cell culture
The Mouse Bone Marrow-derived Mesenchymal Stem Cells were purchased from Cyagen (CA, USA). The cells were cultivated in an OriCell Mouse MSC Growth Medium (Cyagen) containing 100 units/ml of penicillin and 100 μg/ml of streptomycin at 37 ℃, 5% CO2. The medium was changed to fresh medium every 2–3 days.
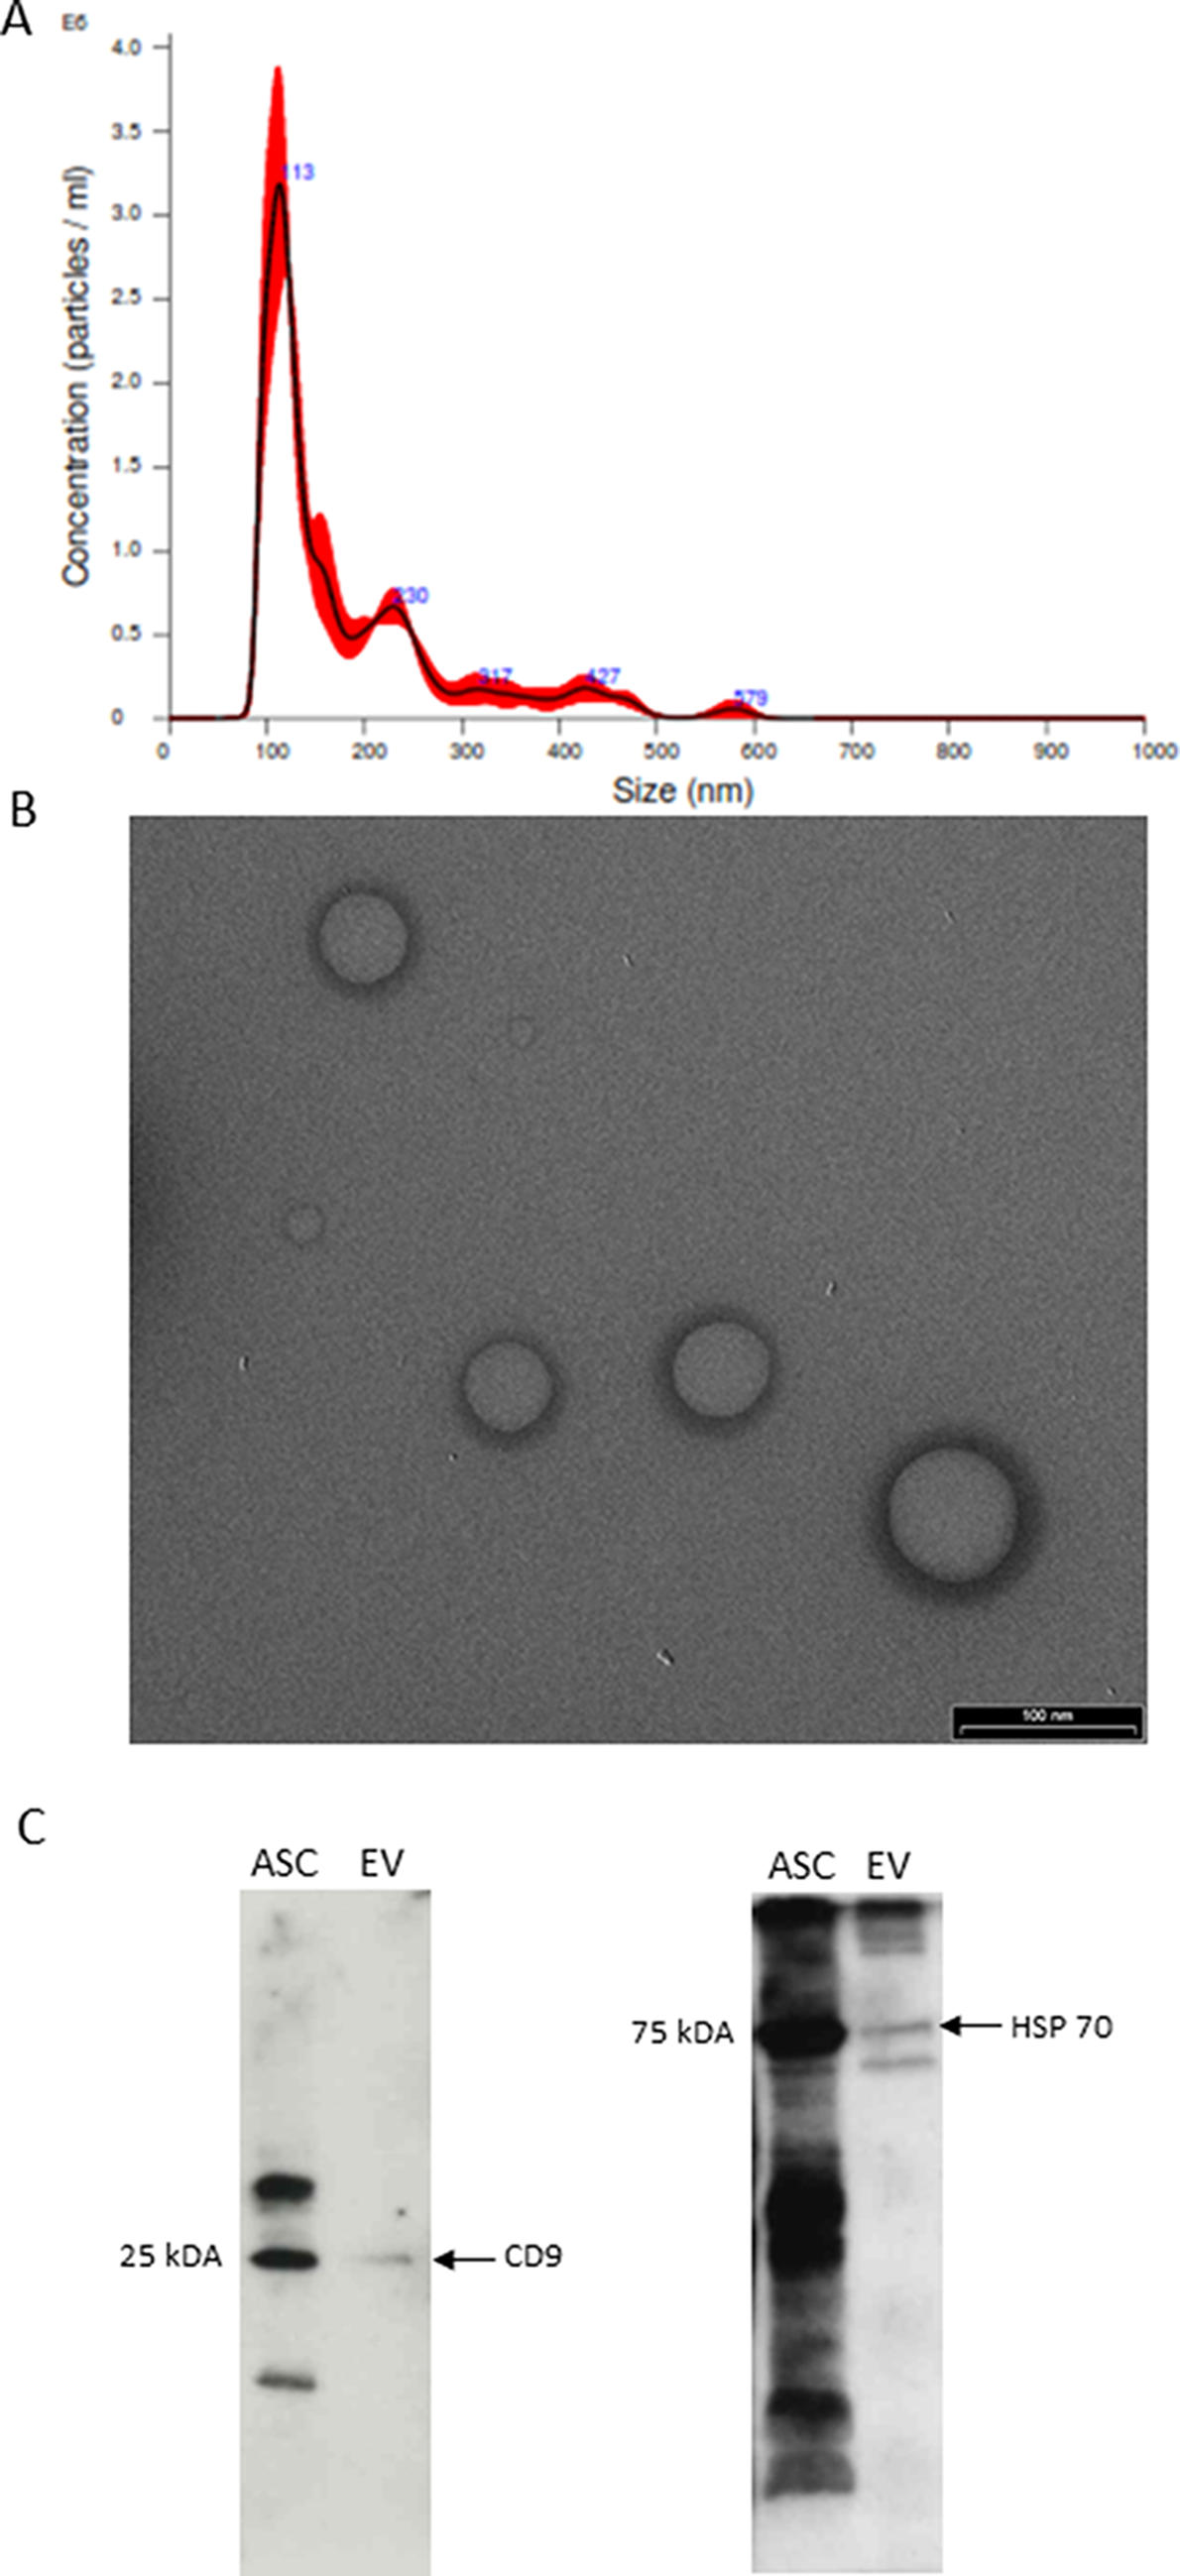
Exosome isolation
Exosomes were isolated from the BM-MSC medium by qEV exosomes isolation kit (iZON Science; MA, USA) according to the manufacturer’s protocol. Briefly, the conditioned medium was collected and centrifuged at 2,500 × g for 20 min to remove unattached cells and debris. A 100 kDa molecular weight cutoff in a centrifugal filter (Millipore Sigma; MA, USA) was employed to concentrate the medium. The concentrated medium was transferred to a size-exclusion chromatography qEV unit. The liquid that contained exosomes was collected and then reconcentrated by using a 10 kDa molecular weight cutoff centrifugal filter (Millipore Sigma).
The isolated exosomes were lysed, and the concentration of total proteins was measured by using a BCA Protein Assay Kit (Thermo Fisher Scientific, NJ, USA) according to the manufacturer’s instructions.
Nanoparticle tracking analysis (NTA)
An LM10 NTA device (Malvern; Amesbury, UK) was used according to the manufacturer’s instructions to analyze the characteristics of microparticles that were isolated.
Exosome uptake
Exosomes were labeled by using an ExoGlow-Protein EV Labeling Kit (Green, System Biosciences; Palo Alto, CA) according to the manufacturer’s instructions. Briefly, the exosomes were incubated with the green fluorescent dye at 37 ℃ for 20 min and then incubated at 4 ℃ overnight. The next day, the labeled exosomes were isolated and resuspended in the macrophage growth medium. Macrophages were incubated in the medium that contained 50 µg/ml exosomes for various times (3 h, 6 h, 12 h, or 24 h). The macrophages were harvested and incubated with a 1:10,000 diluted Hoechst 33,342 (Thermo Fisher Scientific) to label the nucleus. The fluorescent pictures were taken under fluorescent microscopy (Olympus DP70, Japan). For flow cytometry analysis, the cells were collected and analyzed by using a Guava easyCyte flow cytometer (Millipore Sigma). The results were further analyzed by using FlowJo software.
Pathological scoring
The glomerular mesangial expansion was scored as follows: 0, no any expansion; 1, 1–10% glomeruli with mild expansion; 2, 11–25% glomeruli with moderate expansion; 3, 26–50% glomeruli with severe expansion; 4, 50% glomeruli being sclerotic. Twenty glomeruli were examined and scored for each mouse. A pathologist who was blinded to the sample identities performed the evaluation and scoring.
Immunofluorescence staining
Sections of 5-mm thickness of mouse frozen kidney tissues were blocked with 10% FBS and incubated with primary antibodies labeled with FITC, rabbit polyclonal anti-IgG, IgA, IgM, C3, and C1q (DAKO, USA). The images were captured under the Leica microscope (DM5000B).
For IgG, IgA, IgM, C3, and C1q a pathologist blinded to the sample identities examined the glomeruli and scored staining intensity by 0 (no staining), 1 (weak staining), 2 (positive staining), and 3 (strongly positive).
CCL20 analysis
The conditioned medium (CdM) of macrophage was collected to determine the concentration of CCL20 using ELISA kits (R&D Systems). The procedures were carried out according to the manufacturer's instructions. The Molecular Devices SpectraMax spectrophotometer (Marshall Scientific, Hampton, NH) was employed to measure the concentration of CCL20.
Naïve T cell isolation
Mouse naïve T cell was isolated from the spleen by using Mouse Naïve CD4+ T Cell Isolation Kit (R&D Systems) according to the manufacturer's instructions. Briefly, the mouse spleen was teased apart to generate a single cell suspension in D-Hanks’ supplemented with 10% bovine serum. The cells were washed and resuspended in cold 1X MagCellect Buffer at 1 × 10⁸ concentration. Then, the cells were incubated with Mouse Naïve CD4+ T Cell Biotinylated Antibody Cocktail,
RNA isolation and qRT-PCR of miRNAs
Total RNA was extracted from cells or exosomes using TRIzol Reagent (ThermoFisher) according to the manufacturer’s instructions. Quantitative RT-PCR was performed using TaqMan miRNA probes (Applied Biosystems, USA) according to the manufacturer’s instructions. Briefly, total RNA was reverse transcribed to cDNA using AMV reverse transcriptase (ThermoFisher) and a stem-loop RT primer (Applied Biosystems) or RT primer. Real-time PCR was performed using a TaqMan PCR kit and an Applied Biosystems 7900 Sequence Detection System (Applied Biosystems). All reactions, including no-template controls, were run in triplicate. After the reaction, the CT values were determined using fixed threshold settings. miRNA expression in cells or tissues is normalized to U6 snRNA or Cel-miR-39.
Transduction of recombinant lentivirus
The procedures practiced here followed the National Institutes of Health guidelines for recombinant DNA research. All recombinant lentiviruses used in this study were purchased from the AMSBIO (Abingdon, UK). For transduction, macrophages were incubated with the Lenti/PREmiR-16 (PREmiR-16) and Lenti/PREmiR-21 (PREmiR-21) or Lenti/PREmiR-Cont (PREmiR-Cont) at a multiplicity of infection (MOI) of 5. BMMSCs were incubated with Lent/ZIPmiR-16 (ZIPmiR-16) and Lent/ZIPmiR-21 (ZIPmiR-21) to deplete miR-16 and miR-21 levels in the cells. Lent/ZIPmiR-Cont (ZIPmiR-Cont) was used as control.
Data analysis
All values are shown as the means ± SDs. All experiments were repeated at least 4 times (n = 4) unless otherwise noted. Student’s t test analysis was performed to analyze all data. Only p < 0.05 was considered significant.


留言 (0)