Research design and study population
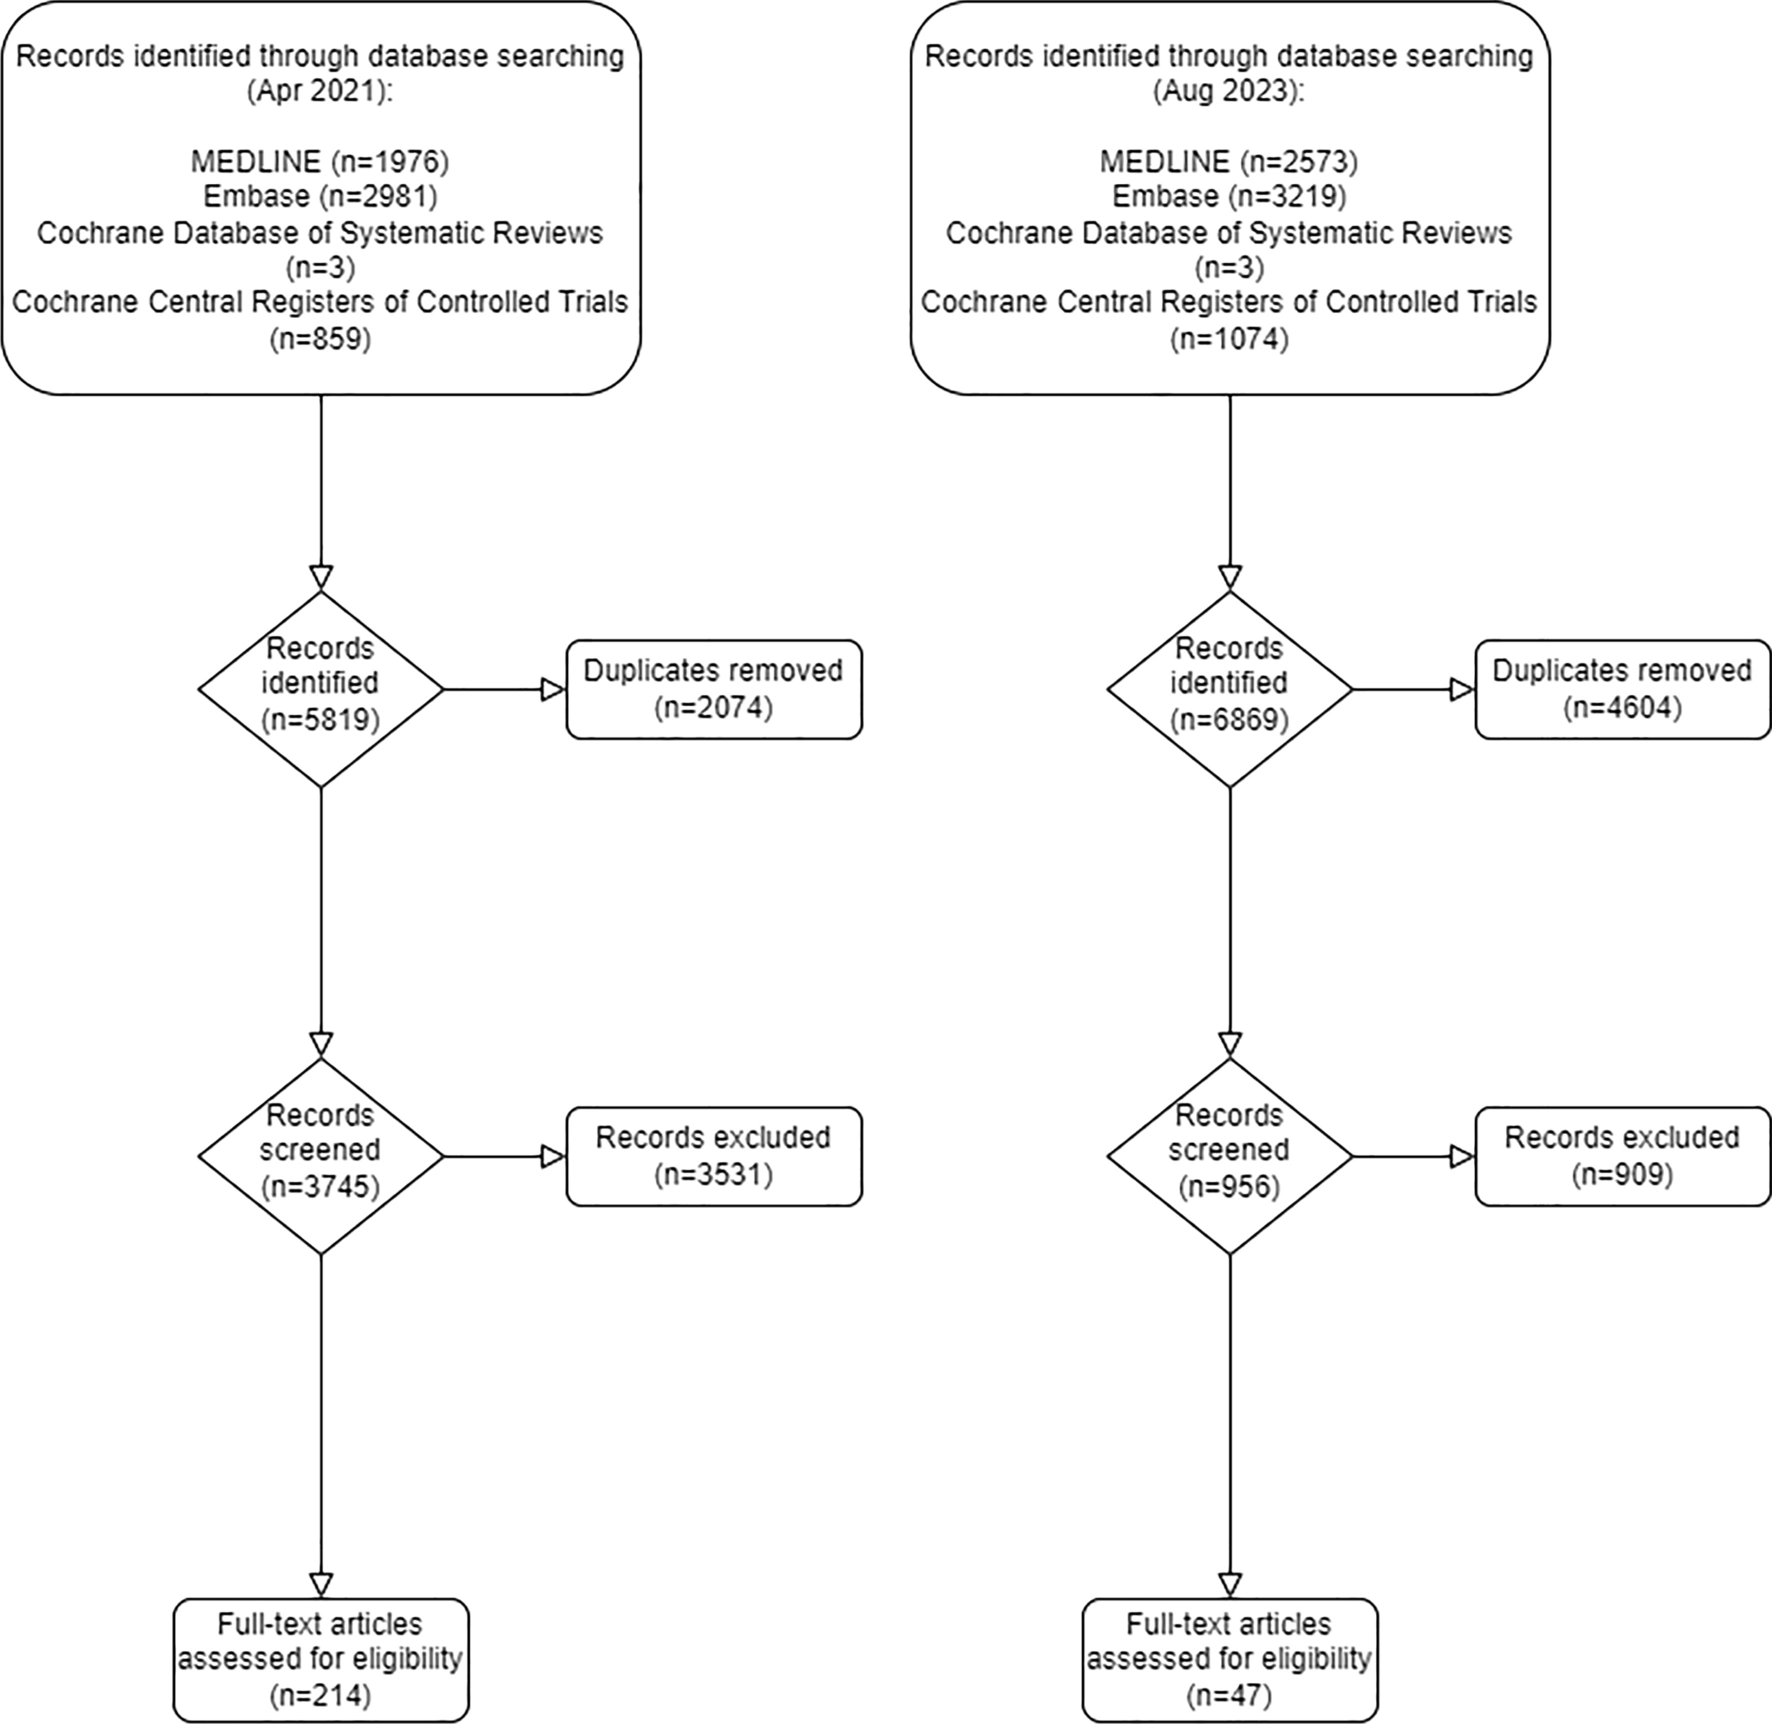
We conducted a historical cohort study of patients ≥ 18 yr of age with septic shock who were admitted to an ICU at either the Health Sciences Center or Saint Boniface Hospital in Winnipeg, MB, Canada between 2006 and 2012. This study was approved by the University of Manitoba Health Research Ethics Board (HS21067, H2017:270). Patients were identified using the Cooperative Antimicrobial Therapy of Septic Shock (CATSS) database.17, 18 The data for this study were developed by linking the CATSS database and laboratory variables from the Laboratory Information System at both participating hospitals. White blood cell count measurements were obtained from Sysmex XE-2100 automated hematology analyzers (Sysmex Canada, Mississauga, ON, Canada). Septic shock is defined in this database by the 1991 Society for Critical Care Medicine/American College of Chest Physicians Consensus Statement on Septic Shock, and remained consistent throughout the study period.19 Data were collected on each case up to time of death, to hospital discharge, or to a maximum of 30 days in hospital.
Seeking to minimize WBC abnormalities unrelated to septic shock, we excluded patients with malignancy, hepatic cirrhosis, human immunodeficiency virus (HIV), or immunosuppression (including cytotoxic chemotherapy). To allow sufficient elapsed time to generate a WBC trajectory and to reduce the potential for survival bias, we limited our analysis to those patients who had an ICU length of stay of at least 48 hr and had at least three serial WBC measurements to determine the trajectory. For participants with more than one eligible ICU admission during the study period, only the first admission was included.
Study variables
Variables in the CATSS database include age, sex, geographic location, Acute Physiology and Chronic Health Evaluation (APACHE) II score,5 number of new organ failures on day one of ICU admission, type of organ failure (cardiovascular, renal, respiratory, metabolic, or hematologic), comorbid conditions (liver failure, chronic obstructive pulmonary disease, diabetes, New York Heart Association Class IV heart failure, dialysis dependency, malignancy, HIV infection or acquired immunodeficiency syndrome), immunosuppression, documented or presumed site and source of infection, supportive treatments (e.g., mechanical ventilation, vasopressors/inotropes, renal replacement therapy), and the time to first appropriate antimicrobial therapy. Appropriate antimicrobial therapy was defined by the administration of antimicrobials with in vitro activity for the isolated pathogen, or appropriate for the clinical syndrome in cases where no pathogen was isolated.20 Organ failures were defined as follows: cardiovascular = systolic blood pressure < 90 mm Hg or more than 40 mm Hg drop from normal OR mean arterial pressure < 65 mm Hg for at least one hour despite adequate fluid resuscitation (2 L saline or equivalent) OR the use of vasopressors; renal = elevation of baseline creatinine to > 1.5 × normal value; respiratory = invasive mechanical ventilation required; hematologic = platelet count < 80 × 109·L–1; and metabolic = lactate > 3 mM·L–1. Endpoints obtained from the CATSS database included ICU survival, survival to 30 days or hospital discharge alive, and ICU length of stay. Laboratory variables collected included WBC; hemoglobin level; platelet count; international normalized ratio; and bilirubin, creatinine, and lactate levels.
Statistical analyses
We used group-based trajectory modelling (GBTM) to segregate patients according to the trajectory of their total WBC. Group-based trajectory modelling is a statistical method used to describe the trend of a variable over time.21 PROC TRAJ is a procedure in SAS (SAS Institute, Cary, NC, USA) that identifies groups of individuals with similar characteristics over time using group-based modelling.21,22,23 Rather than prespecifying groups within a population, GBTM allows for different groups with different trajectories to emerge from the data.
We included up to two WBC measurements per day; if more than two were available, the first within a 12-hr period was included. We anchored the start of the trajectory analysis to the time of the first WBC drawn, as most patients had this done at or shortly after ICU admission. We included measurements for the first seven days after ICU admission to capture the WBC trajectory attributable to septic shock.
We followed a previously described procedure for model building using PROC TRAJ.22 We started with a one-group model and increased up to ten-group model. Trajectories were fitted to third-order polynomials to capture nonlinear patterns over time. The optimal number of trajectories was selected using the standard method of evaluating the Bayesian Information Criterion (BIC),21 augmented by clinical interpretation and sensibility. Clinical interpretation was based on expert opinion reviewed at regular meetings with senior critical care physicians and included an assessment of whether the trajectories were as expected for patients with septic shock. Model fit statistics were performed on the final model. The first model diagnostic assesses the ratio between the probability of group membership (pj) to the actual group membership. The probability of group membership measures the proportion of the population that belongs to a certain group. The ratio for each group should be close to 1. The second model diagnostic test is the average posterior probability (AvePP) for each group. The posterior probability is the probability that an individual with a specific pattern belongs to a specific trajectory group and is calculated for each individual in PROC TRAJ. The AvePP is calculated by taking the average of the posterior probabilities for each trajectory group. It is recommended that each group should have an AvePP of greater than 0.7.23 The third diagnostic test is the Odds of Correct Classification (OCC) and is calculated by taking the ratio of the AvePP odds (AvePP/1-AvePP) to the pj odds (pj/1-pj). The higher the number, the better the odds of being correctly classified are. It is recommended that the OCC should be > 5 for each group. A minimum sample size of 100 participants with at least three data points for each participant is recommended for GBTM.23
We summarized the baseline characteristics of the entire cohort and compared baseline characteristics across the identified trajectory groups using the Kruskal–Wallis or Chi square test. Summary statistics are presented as means with standard deviation (SD) or medians with interquartile range [IQR] for continuous variables, and frequencies and proportions for categorical variables.
To investigate the independent association of WBC trajectories on 30-day mortality, we constructed a multivariable Cox proportional hazard model adjusted for variables known or thought to be associated with mortality, including patient variables (age, sex), illness variables (APACHE II score [modified to exclude the WBC component: APACHE-WBC]), number of organ failures on day 1 of ICU admission, pathogen variables (bacteremia, culture positive or negative) and cointervention variables (time from onset of hypotension to first antibiotic, the provision of appropriate or combination antibiotics). Although not well recognized, P values derived from multivariable regression are not adjusted for inherent multiple comparisons,24 which increases type I errors. To adjust for this, we used Benjamini–Hochberg’s (Simes’) step-up procedure to control the false discovery rate at 5%.25
All statistical analyses were performed using SAS software version 9.4. P values < 0.05 were considered statistically significant.


留言 (0)