
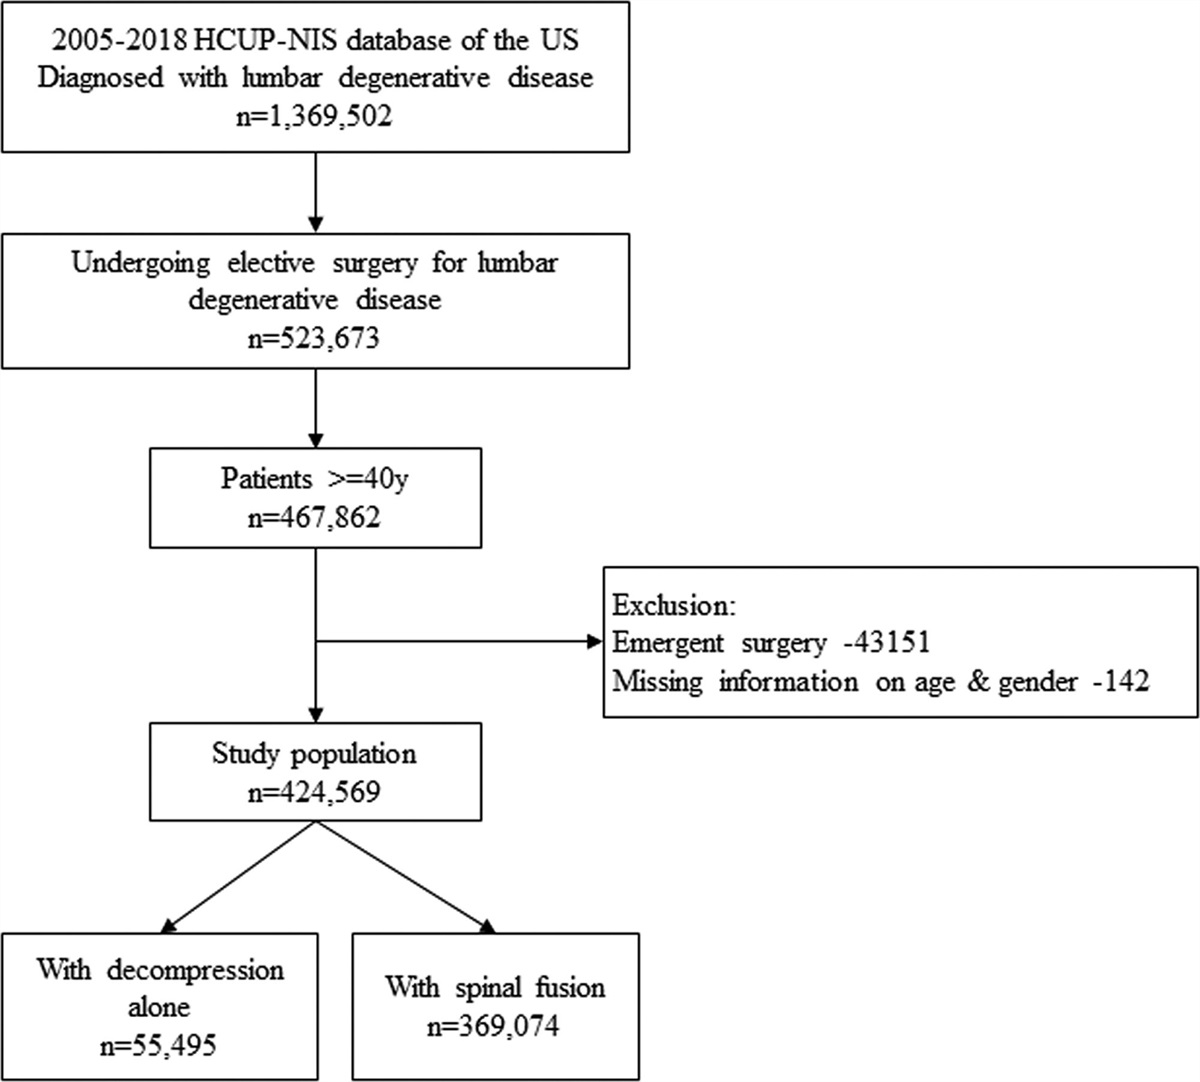
記住我

Castleman disease is a lymphoproliferative disorder first reported by Dr. Benjamin Castleman in 1954. It is also known as giant lymph node hyperplasia or angiofollicular lymph node hyperplasia. Although the etiology of Castleman disease remains unclear, the disease is classified into two subtypes, unicentric and multicentric,1,2 with the former being more prevalent. Unicentric Castleman disease is characterized by a painless mass over the mediastinum, axillary, and cervical lymph nodes and nonspecific clinical presentations,3 with radiographic features that demonstrate intense homogeneous enhancement following contrast on CT (CT).4–6 However, lymphomas share the same features of intense homogeneous enhancement on CT.7,8 One retrospective study found significantly higher Hounsfield units (HU) in patients with Castleman disease than in patients with lymphoma.9 However, the HU of a tumor may be affected by several factors, including the timing of image capture and dose and distribution of contrast. In addition, no quantitative research has been conducted on the homogeneity of both the diseases. Therefore, this study aimed to perform quantitative research on the imaging findings of Castleman disease versus lymphoma.
2. METHODSThis study was approved by the Institutional Review Board of China Medical University and Hospital (Taichung, Taiwan). The requirement for informed consent was waived owing to the retrospective nature of the study. We retrospectively reviewed eight patients with unicentric Castleman disease and 30 patients with lymphoma based on pathological diagnosis by curative resection or excisional biopsy of the neck mass at China Medical University and Hospital between 2015 and 2020. Patients were excluded if they did not undergo preoperative CT with contrast scan completion, which ultimately led us to exclude one patient with unicentric Castleman disease and five patients with lymphoma.
Head-and-neck CT was performed using a GE Optima CT660 CT scanner (64-slice). Omnipaque was administered intravenously at a rate of 2 mL per second for 40 mL, and then 1.5 mL per second for 60 mL. Postcontrast imaging was taken at the 50th second after contrast infusion. Image data were analyzed using the INFINITT PACS (Picture Archiving and Communication System) at our institution. In our study, the HU of each tumor were measured, and the mean HU was defined as the index of enhancement of a tumor, while the relative standard deviation, which is the ratio of the standard deviation to the mean, was considered to be related to heterogeneity. As for factors that may influence the HU of a tumor, such as the timing of image capture and dose and distribution of contrast, the mean HU over the tumor should be adjusted by the HU of the external carotid artery (ECA), which is the main arterial supplement to the neck mass. We prefer the ECA to the muscle because the former is more homogenous than the latter and is easier to standardize.
3. RESULTS 3.1. Patient demographicsIn this study, we finally included seven patients with unicentric Castleman disease and 25 patients with lymphoma. The characteristics of the patients with Castleman disease are summarized in Table 1. The patients comprised four men and four women, ranging in age from 10–57 years (mean age, 33 years). Histology of the neck mass showed that all were hyaline vascular types. Patients presented with no specific symptoms except for a neck mass, and laboratory data revealed no abnormalities. The locations of the neck masses ranged from levels I to V and in the parotid region. All patients underwent surgical intervention, and no recurrence was noted.
Table 1 - Characteristics of patients with Castleman disease Age Gender Histology Symptoms Lab Location Treatment 1 27 F Hyaline vascular NECK mass Normal Level II Surgery 2a 46 M Hyaline vascular Neck mass Normal Level III Surgery 3 28 F Hyaline vascular Neck mass Normal Parotid Surgery 4 10 M Hyaline vascular Neck mass Normal Level III–Va Surgery 5 57 F Hyaline vascular Neck mass Normal Level IV Surgery 6 21 F Hyaline vascular Neck mass Normal Level II–III Surgery 7 33 M Hyaline vascular Neck mass Normal Level I Surgery 8 42 M Hyaline vascular Neck mass Normal level Ib surgeryaExcluded due to a lack of preoperative CT scan data.
Regarding lymphoma, this study included 25 patients, comprising 11 men and 14 women, ranging in age from 8–79 years (mean age, 53 years). The neck mass histology is summarized in Table 2, which demonstrates that follicular lymphoma accounts for the largest proportion (32%), while diffuse large B-cell lymphoma accounts for the second largest proportion (28%).
Table 2 - Characteristics of patients with lymphoma Age Gender Histology 1 18 F Nodular sclerosis classical Hodgkin lymphoma 2 56 F Peripheral T-cell lymphoma, not otherwise specified 3 72 F Small lymphocytic lymphoma with large cell transformation 4 54 F Follicular lymphoma 5 69 M Follicular lymphoma 6 58 M Diffuse large B-cell lymphoma 7 51 M Follicular lymphoma 8 8 F T-lymphoblastic leukemia/lymphoma 9 59 F Diffuse large B-cell, nongerminal center type 10 42 F Diffuse large B-cell, nongerminal center type 11 45 M Peripheral T-cell lymphoma, not otherwise specified 12 63 M Diffuse large B-cell lymphoma, germinal center type 13 59 M Diffuse large B-cell lymphoma, nongerminal center type 14 62 F Diffuse large B-cell, nongerminal center type 15 65 M Nodal marginal zone lymphoma 16 59 F Follicular lymphoma 17 69 F Follicular lymphoma 18 41 F Lennert lymphoma 19 48 M Follicular lymphoma 20 62 F Follicular lymphoma 21 79 M Diffuse large B-cell, nongerminal center type 22 60 F Mantle cell lymphoma 23 50 M Follicular lymphoma 24 48 F Classical Hodgkin’s lymphoma 25 31 M Mixed cellularity classical Hodgkin lymphomaIn our study, the index of heterogeneity was defined by the relative standard deviation. The mean heterogeneity index (Fig. 1) of lymphoma (0.239 ± 0.063) was higher than that of Castleman disease (0.161 ± 0.052); however, the difference was not significant (p = 0.22). If we used the index of heterogeneity as a diagnostic tool, the area under the curve (AUC) of the receiver operating characteristic curve (ROC) was 0.695, indicating a barely satisfactory diagnostic tool. The cutoff point was 0.19, with a sensitivity 0.86 and specificity of 0.56.
 Fig. 1:
 Manual measurement of (A) lymphoma, (B) Castleman disease, and (C) ECA. ECA = external carotid artery.
 Fig. 2:
 Relationship between the HU of tumors and arteries. HU = Hounsfield units.
3.3. EnhancementIn our study, we considered the index of enhancement to be related to the mean HU value of the tumor. The enhancement index was significantly higher in Castleman disease (126.40 ± 31.90) than that of lymphoma (74.19 ± 7.11). Using the index of enhancement as a diagnostic tool, the AUC of the ROC was 0.95 (Fig. 1), which indicates an excellent diagnostic tool. The cutoff point was approximately 88.5–91.3, with a sensitivity of 0.86 and specificity of 0.88.
Regarding the factors that may influence the HU of a tumor, such as the timing of image capture and dose and distribution of contrast, the mean HU over the tumor should be adjusted by the HU of the ECA, which is the main arterial supplement to the neck mass.
To confirm the relationship between the HU of a tumor and the HU of the ECA, we used simple regression analysis through least-squares estimation and related techniques. The coefficient of determination (R2) demonstrated a highly linear correlation in Castleman disease (R2 = 0.804), while a linear correlation was absent in lymphoma. Analysis of variance (ANOVA) revealed a significant linear correlation in Castleman disease (F = 17.495, p < 0.05); however, no significant correlation was observed in lymphoma (F = 0.409, p = 0.529).
4. DISCUSSIONIn our study, the clinical presentation of Castleman disease was nonspecific, except for the neck mass; laboratory data revealed no abnormalities. Additionally, we found no specific distribution of age, sex, or location of the neck mass.
 Fig. 3:
 Diagnostic tool made by the relationship between the HU of tumors and arteries. HU = Hounsfield units.
For imaging findings, heterogeneity was higher in lymphoma than in Castleman disease; however, this difference was not significant. In other words, CD is more homogeneous in contrast-enhanced CT imaging findings, but this would not serve as a good diagnostic tool for distinguishing lymphoma. In contrast, Castleman disease displayed higher enhancement than lymphoma, which could make it a good diagnostic tool with a cutoff point around 88.5–91.3. Li et al9 reached a similar conclusion in their comparative study, which indicated a cutoff value of 92.5 HU.
Considering the factors that affect tumor enhancement, we further considered the HU of the ipsilateral ECA as an adjustment factor. Drawing the chart of tumor HU and ECA HU, we found a highly linear relationship in Castleman disease, but no specific relationship in lymphoma. This finding is promising, as no other study has yet described it. It may be a good diagnostic tool if a linear relationship can be confirmed in a larger study.
The different relationships between Castleman disease and lymphoma may be related to the pathological characteristics of the two diseases. Unicentric Castleman disease is usually of the hyaline vascular type, which represents high vascularity,10 and the HU of the tumor is thus highly related to the HU of the ECA.11 In contrast, lymphoma does not share the same presentation; therefore, tumor HU is less related to ECA HU.
The linear relationship of Castleman disease can make a clear differentiation at the cutoff point of 200 ECA HU and 100 tumor HU. With an ECA HU greater than 200, when the tumor HU is higher than 100, Castleman disease has a high probability. Otherwise, the condition is more likely to be diagnosed as lymphoma. However, differentiating between the two diseases when the ECA HU is less than 200 is difficult; therefore, a biopsy is usually needed.
This study has several limitations. First, the sample size was too small to determine whether the findings are universal. Second, the range of tumors on CT imaging was determined by visual assessment, which may have produced errors and bias. Third, the reason for the wide range of ECA HUs is not clear and may have influenced the accuracy of quantization. Fourth, the relationship between the HU of tumors and arteries has not been previously described and thus may require more discussion and consensus. Finally, in most of our cases, we used only postcontrast imaging, and there was no noncontrast imaging in our data. Therefore, subtraction imaging could not be analyzed in our study, which is a limitation.
In conclusion in this study, we found that the heterogeneity of tumors on contrast-enhanced CT was not a good diagnostic tool. However, enhancement of the tumor is a good diagnostic tool, and we observed a highly linear relationship between the HU of Castleman disease and ECA. If confirmed in a large-scale study, this relationship can be a promising diagnostic tool for differentiating Castleman disease from lymphoma before performing a biopsy.
ACKNOWLEDGMENTSThis study was funded by a grant from CMUH (DMR-110-056).
REFERENCES 1. Castleman B, Iverson L, Menendez VP. Localized mediastinal lymphnode hyperplasia resembling thymoma. Cancer. 1956;9:822–30. 2. Gaba AR, Stein RS, Sweet DL, Variakojis D. Multicentric giant lymph node hyperplasia. Am J Clin Pathol. 1978;69:86–90. 3. Roca B. Castleman’s disease. a review. AIDS Rev. 2009;11:3–7. 4. Gossios K, Nikolaides C, Bai M, Fountzilas G. Widespread Castleman disease: CT findings. Eur Radiol. 1996;6:95–8. 5. Wen L, Zhang D, Zhang ZG. CT characteristics of cervical Castleman’s disease. Clin Imaging. 2005;29:141–3. 6. Jiang XH, Song HM, Liu QY, Cao Y, Li GH, Zhang WD. Castleman disease of the neck: CT and MR imaging findings. Eur J Radiol. 2014;83:2041–50. 7. Fishman EK, Kuhlman JE, Jones RJ. CT of lymphoma: spectrum of disease. Radiographics. 1991;11:647–69. 8. Choi EJ, Jin GY, Chung MJ. Serial chest CT findings of intravascular large B-cell lymphoma of the lungs. J Thorac Dis. 2018;10:E218–20. 9. Li J, Wang J, Yang Z, Wang H, Che J, Xu W. Castleman disease versus lymphoma in neck lymph nodes: a comparative study using contrast-enhanced CT. Cancer Imaging. 2018;18:28. 10. Haap M, Wiefels J, Horger M, Hoyer A, Müssig K. Clinical, laboratory and imaging findings in Castleman’s disease - The subtype decides. Blood Rev. 2018;32:225–34. 11. Horger M, Bares R, Wiefels J, Schöber W, Müssig K. Imaging findings of angiofollicular lymphoid hyperplasia (Castleman’s disease). Georg Thieme Verlag KG Stuttgart. 2007; 179: 991–6.
留言 (0)