
記住我


Aphasia is an acquired language disorder following brain injury occurring in over 1/3 of hospitalized stroke patients; an estimated 165,000–380,000 Canadians are affected with chronic aphasia (Simmons-Mackie, 2017). Aphasia can lead to various degrees of difficulty in speaking, understanding, reading, or writing. Among the plethora of symptoms, the most common, persistent, and debilitating symptom is anomia – a difficulty in finding words. Speech and language therapy (SLT) effectively improves anomia [see Brady et al. (2016) for a meta-analysis], but there is little consensus on which anomia therapies are most effective and efficient.
Over half the world’s population is considered bilingual (Grosjean, 2015), and in Canada, 19.4% of the population speaks two or more languages at home (Statistic Canada, 2017). The increasing bilingual population also leads to a higher incidence of bilingual persons with aphasia (Ansaldo and Saidi, 2014). Research shows that knowing more than one language entails a cognitive advantage at the executive function level (Bialystok et al., 2004; Abutalebi and Green, 2007; Ansaldo et al., 2015; Zhou and Krott, 2016; Dash et al., 2019; DeLuca et al., 2019), which induces neuroplasticity and structural adaptations (Abutalebi and Green, 2016). Studies on neurologically intact bilingual adults report better cognitive control1 than monolinguals, referred to as the bilingual advantage (Bialystok et al., 2004; Bialystok, 2009; Costa et al., 2009; Ansaldo et al., 2015; Berroir et al., 2017). In addition, more studies are pointing toward anatomical differences between bilingual and monolingual adults in cortical and subcortical grey matter structures (Mechelli et al., 2004; Li et al., 2014; Abutalebi and Green, 2016; Olulade et al., 2016; Marin-Marin et al., 2022). According to these results, bilingualism is comparable to other life-long experiences that significantly alter the structural makeup of the brain when learning and maintaining a new skill (Marin-Marin et al., 2022). This advantage is also present in gray matter structures in both left and right hemispheres (Li et al., 2014; Abutalebi and Green, 2016). Studies using structural magnetic resonance imaging (MRI) found a difference in the cortical morphology of the bilateral anterior cingulate cortex, the left anterior temporal lobe, bilateral cerebellum, the left caudate nucleus, the left Heschl’s gyrus, the left inferior frontal gyrus (IFG) and the left inferior parietal lobe when comparing bilingual and monolingual participants (Li et al., 2014). Olulade et al. (2016) found greater gray matter volume for the IFG and middle frontal gyrus (MFG) in the right hemisphere (among others) in neurologically intact bilinguals when compared to monolinguals. The increased structural density in critical areas related to language processing and cognitive control, along with the correlations between structural density and behavioral performances such as naming and grammatical processing in a second language (Abutalebi et al., 2014; Pliatsikas et al., 2014), and other measures of bilingualism such as the age of acquisition and proficiency (Mechelli et al., 2004), provide substantial evidence for the bilingual cognitive advantage hypothesis.
Over the years, many studies have discussed predictors of aphasia recovery (Watila and Balarabe, 2015; Doogan et al., 2018) – aphasia-related, such as initial severity and aphasia type (Lazar et al., 2010), lesion-related (Sims et al., 2016; Benghanem et al., 2019; Sul et al., 2019), and, more recently, bilingualism-related (Lahiri et al., 2020). Another aphasia-related factor recently discussed is the level of cognitive control skills in persons with aphasia (PWA; Villard and Kiran, 2018; Simic et al., 2019). In a systematic review, Simic et al. (2019) found that PWA’s baseline executive control and linguistic skills appear to predict therapy success. Cognitive control is critical in showing consistent attention necessary to benefit from therapy (Villard and Kiran, 2018). Initial impairment severity has also been linked to the therapy outcome, where the more severe the aphasia, the less likely the PWA is expected to improve. Furthermore, studies looking at lesion size and location have reported that bigger lesions lead to more severe deficits (Watila and Balarabe, 2015), and lesions in the left IFG (Sims et al., 2016; Daria et al., 2019), the middle temporal gyrus (MTG; Sims et al., 2016; Daria et al., 2019), the superior temporal gyrus (STG; Daria et al., 2019) and angular gyrus (AnG)/supramarginal gyrus (SMG; Sims et al., 2016) lead to more severe aphasia. Interestingly, studies have also shown changes in grey matter structures of posterior dorsal stream language homologues in the right hemisphere (RH), resulting in better language production abilities in chronic aphasia (Xing et al., 2016). The role of RH is often discussed with respect to stroke-induced aphasia recovery. The recruitment of homotopic areas in the RH is one of the effective methods of post-stroke reorganization leading to recovery. It is commonly hypothesized that RH recruitment and overall lesion size in the left hemisphere may be related (Heiss et al., 1999; Anglade et al., 2014). Moreover, studies looking at treatment-induced brain plasticity in chronic aphasia provide additional evidence for RH recruitment to assist language recovery, revealing higher RH activity linked with treatment gains (Fridriksson et al., 2006, 2007; Meinzer et al., 2007; Kiran et al., 2015).
To this day, there remains little consensus in the literature, much less in the bilingual literature, on the predictive value of variables such as lesion size, lesion location, and role of the RH. Recent studies on bilingual persons with aphasia (bPWA) report a bilingual advantage in cognitive performances in stroke survivors (Dash and Kar, 2014; Alladi et al., 2016; Paplikar et al., 2018; Dekhtyar et al., 2020; Lahiri et al., 2020; Penaloza et al., 2020; Mooijman et al., 2021). Concerning aphasia symptom severity, bPWA have milder language deficits in their mother tongue (Paplikar et al., 2018; Ardila and Lahiri, 2020). These results suggest that bPWA show better cognitive control, less severe aphasia, and more recovery. However, the relationship between cognitive control, word retrieval, and bilingualism remains unclear based on the recent findings from Faroqi-Shah et al. (2018), which showed a lack of association between Stroop performance and both category fluency and picture-naming in PWA. The interplay between such bilingual advantage and the potential benefits of specific therapy approaches remains to be understood, especially knowing that cognitive control could be a significant predictor of recovery (Simic et al., 2019).
In impairment-based therapies targeting anomia, phonological therapies, such as Phonological Component Analysis (PCA; Leonard et al., 2008; Madden et al., 2017; Kristensson and Saldert, 2018; Marcotte et al., 2018), aim to facilitate lexical retrieval by activating the phonological representation of words (Goldrick and Rapp, 2002) and by assimilating the trained cueing strategies. Leonard et al. (2008) developed the PCA protocol as the phonologically oriented version of semantic feature analysis (Boyle and Coelho, 1995; Coelho et al., 2000); it includes a series of five cues based on phonological components of the target word. As per the original therapy protocol, the multiple consecutive phonological cues in PCA are cognitively demanding and require both flexibility and inhibition. Studies have linked therapy gains with PWA’s cognitive control associating it with their ability to benefit from the trained cues (Gilmore et al., 2019; Simic et al., 2019). Moreover, generalization following ortho-phonological cues has been related to inhibition – a subcomponent of cognitive control (Yeung and Law, 2010). Previous case studies with PCA have established the treatment efficacy in terms of acquisition, improvement as measured by treated items (Leonard et al., 2008; Bose, 2013; Kristensson and Saldert, 2018), within-level generalization, improvement as measured by untreated items (Leonard et al., 2008), and across-level generalization, improvement as measured by linguistic tasks other than the one targeted in treatment such as discourse (Kristensson and Saldert, 2018). For a detailed paper on the different levels of generalization, please see Webster et al. (2015).
Studies have been performed using phonological approaches to treat anomia in bilingual PWA and have reported good results, focusing on cross-linguistic therapy effects (Abutalebi et al., 2009; Croft et al., 2011). To this day, there has been little development in specific therapy-induced recovery studies in bPWA. In general, studies in bilingual aphasia recovery have been criticized for lack of methodological rigorousness (Faroqi-Shah et al., 2010; Simic et al., 2019), hence limiting the interpretations from these studies and generalizations possible. The only paper to this date investigating the impact of bilingualism on aphasia recovery found that bPWA improved more than their monolingual counterparts from the acute phase (3–7 days post-stroke) to the sub-acute phase (90–100 days post-stroke) (Lahiri et al., 2020). However, there is limited information on the potential bilingual advantage in aphasia recovery in the chronic phase. Moreover, considering the cognitive control advantage reported in bilinguals, and given the large proportion of bilinguals in the world population, it is important to improve the understanding of the relation between the cognitive control performance and naming therapy outcome in monolingual and bilingual PWA.
This study aims to investigate the effects of Phonological Component Analysis delivered in French (Fr-PCA) with French monolingual (mPWA) and French-English bPWA on their linguistic and cognitive profiles, in relation to their respective lesion locations, and cortical thickness in the undamaged hemisphere. The specific questions concerning the efficacy of Fr-PCA, the lesion location’s impact, and the RH’s role addressed in this paper and their corresponding hypotheses are listed below. For each research question, we are interested in looking at improvement or performance for all participants, and across groups (mPWA vs. bPWA) when possible, allowing us to evaluate the efficacy of Fr-PCA and the potential influence of bilingualism.
Efficacy of French-Phonological Component AnalysisDoes Fr-PCA lead to improvements in naming accuracy for treated items (acquisition), untreated items and other object naming tasks (within-level generalization), and other linguistic abilities and cognitive tasks (across-level generalization and transfer)? If so, do bPWA show more significant treatment effects (in acquisition, within- and across-level generalization and transfer) when compared to mPWA?
In line with previous research on the English version of PCA (Leonard et al., 2008; Bose, 2013; Kristensson and Saldert, 2018; Marcotte et al., 2018), it is hypothesized that Fr-PCA will improve naming abilities for treated (acquisition) and untreated words (untreated items and TDQ60; within-level generalization), as reflected by higher accuracy scores on picture-naming probes. It is also hypothesized that Fr-PCA will improve standardized language test scores, connected-speech main concept scores (across-level generalization), and cognitive control task performance (transfer). Moreover, in line with recent works and with the load of Fr-PCA on cognitive control, it is expected that improvement will be observed in both groups, with bilinguals showing better improvement levels (Gilmore et al., 2019; Lahiri et al., 2020).
Impact of lesion locationDoes lesion location play a role in pre-therapy cognitive-linguistic abilities and subsequent therapy outcomes?
In line with previous results, we hypothesize that more damage to regions of interest (ROIs) involved in language and cognitive control networks will lead to more severe linguistic and cognitive difficulties (Abutalebi et al., 2008; Luk et al., 2011; Daria et al., 2019). We thus expect significant correlations between pre-therapy cognitive-linguistic test outcomes and lesioned voxels in the ROIs. Furthermore, regarding therapy outcome, it is hypothesized that participants with lesions within the ROIs associated with lexical retrieval and phonological processing would improve less (Fridriksson, 2010).
Role of the right hemisphereDoes RH cortical thickness vary across monolingual and bilingual PWA, and if so, does it relate to performance in cognitive and language tasks?
Given the role of RH in language processing in PWA (Lukic et al., 2017) and structural differences in bilinguals in key cognitive control regions (Felton et al., 2017), we wanted to assess the differences in RH regions between bPWA and mPWA. In line with work by Li et al. (2014), it is expected that cortical thickness in RH areas known for their role in cognitive control will show higher cortical thickness bPWA as compared to their monolingual peers and that such differences will correlate with scores on cognitive and linguistic tasks.
An exploratory research framework addresses the questions regarding the impact of lesion location (question 2) and the role of the RH (question 3).
Materials and methods DesignThis is a pre-, post-therapy study with multiple baselines and repeated measures before and after Fr-PCA (three baseline probes and one post-therapy probe) across groups. To answer the specific questions, we use a mixed design with case series analysis accompanied by group analysis. Specific methods are described in section “Data analysis plan.”
ParticipantsEight participants with aphasia took part in this study; four monolingual and four bilingual participants with aphasia (mPWA – bPWA), matched for age, education, and time post-aphasia onset (TPO). See Table 1 for demographic information. Groups did not differ significantly in lesion size or baseline linguistic profile [mean baseline picture-naming probes accuracy rate, object naming as measured with the TDQ60 (Macoir et al., 2017), verb naming as measured with the DVL38 (Hammelrath, 2005), oral comprehension measured with the MT86 subtest (Nespoulous et al., 1986), repetition measured with the MT86 subtest, verbal fluency measured with the MT86 subtest, and Cinderella storytelling main concepts score (Dalton and Richardson, 2015; Richardson and Dalton, 2016)]. Please see Supplementary Appendix A for detailed group comparison statistics.
TABLE 1
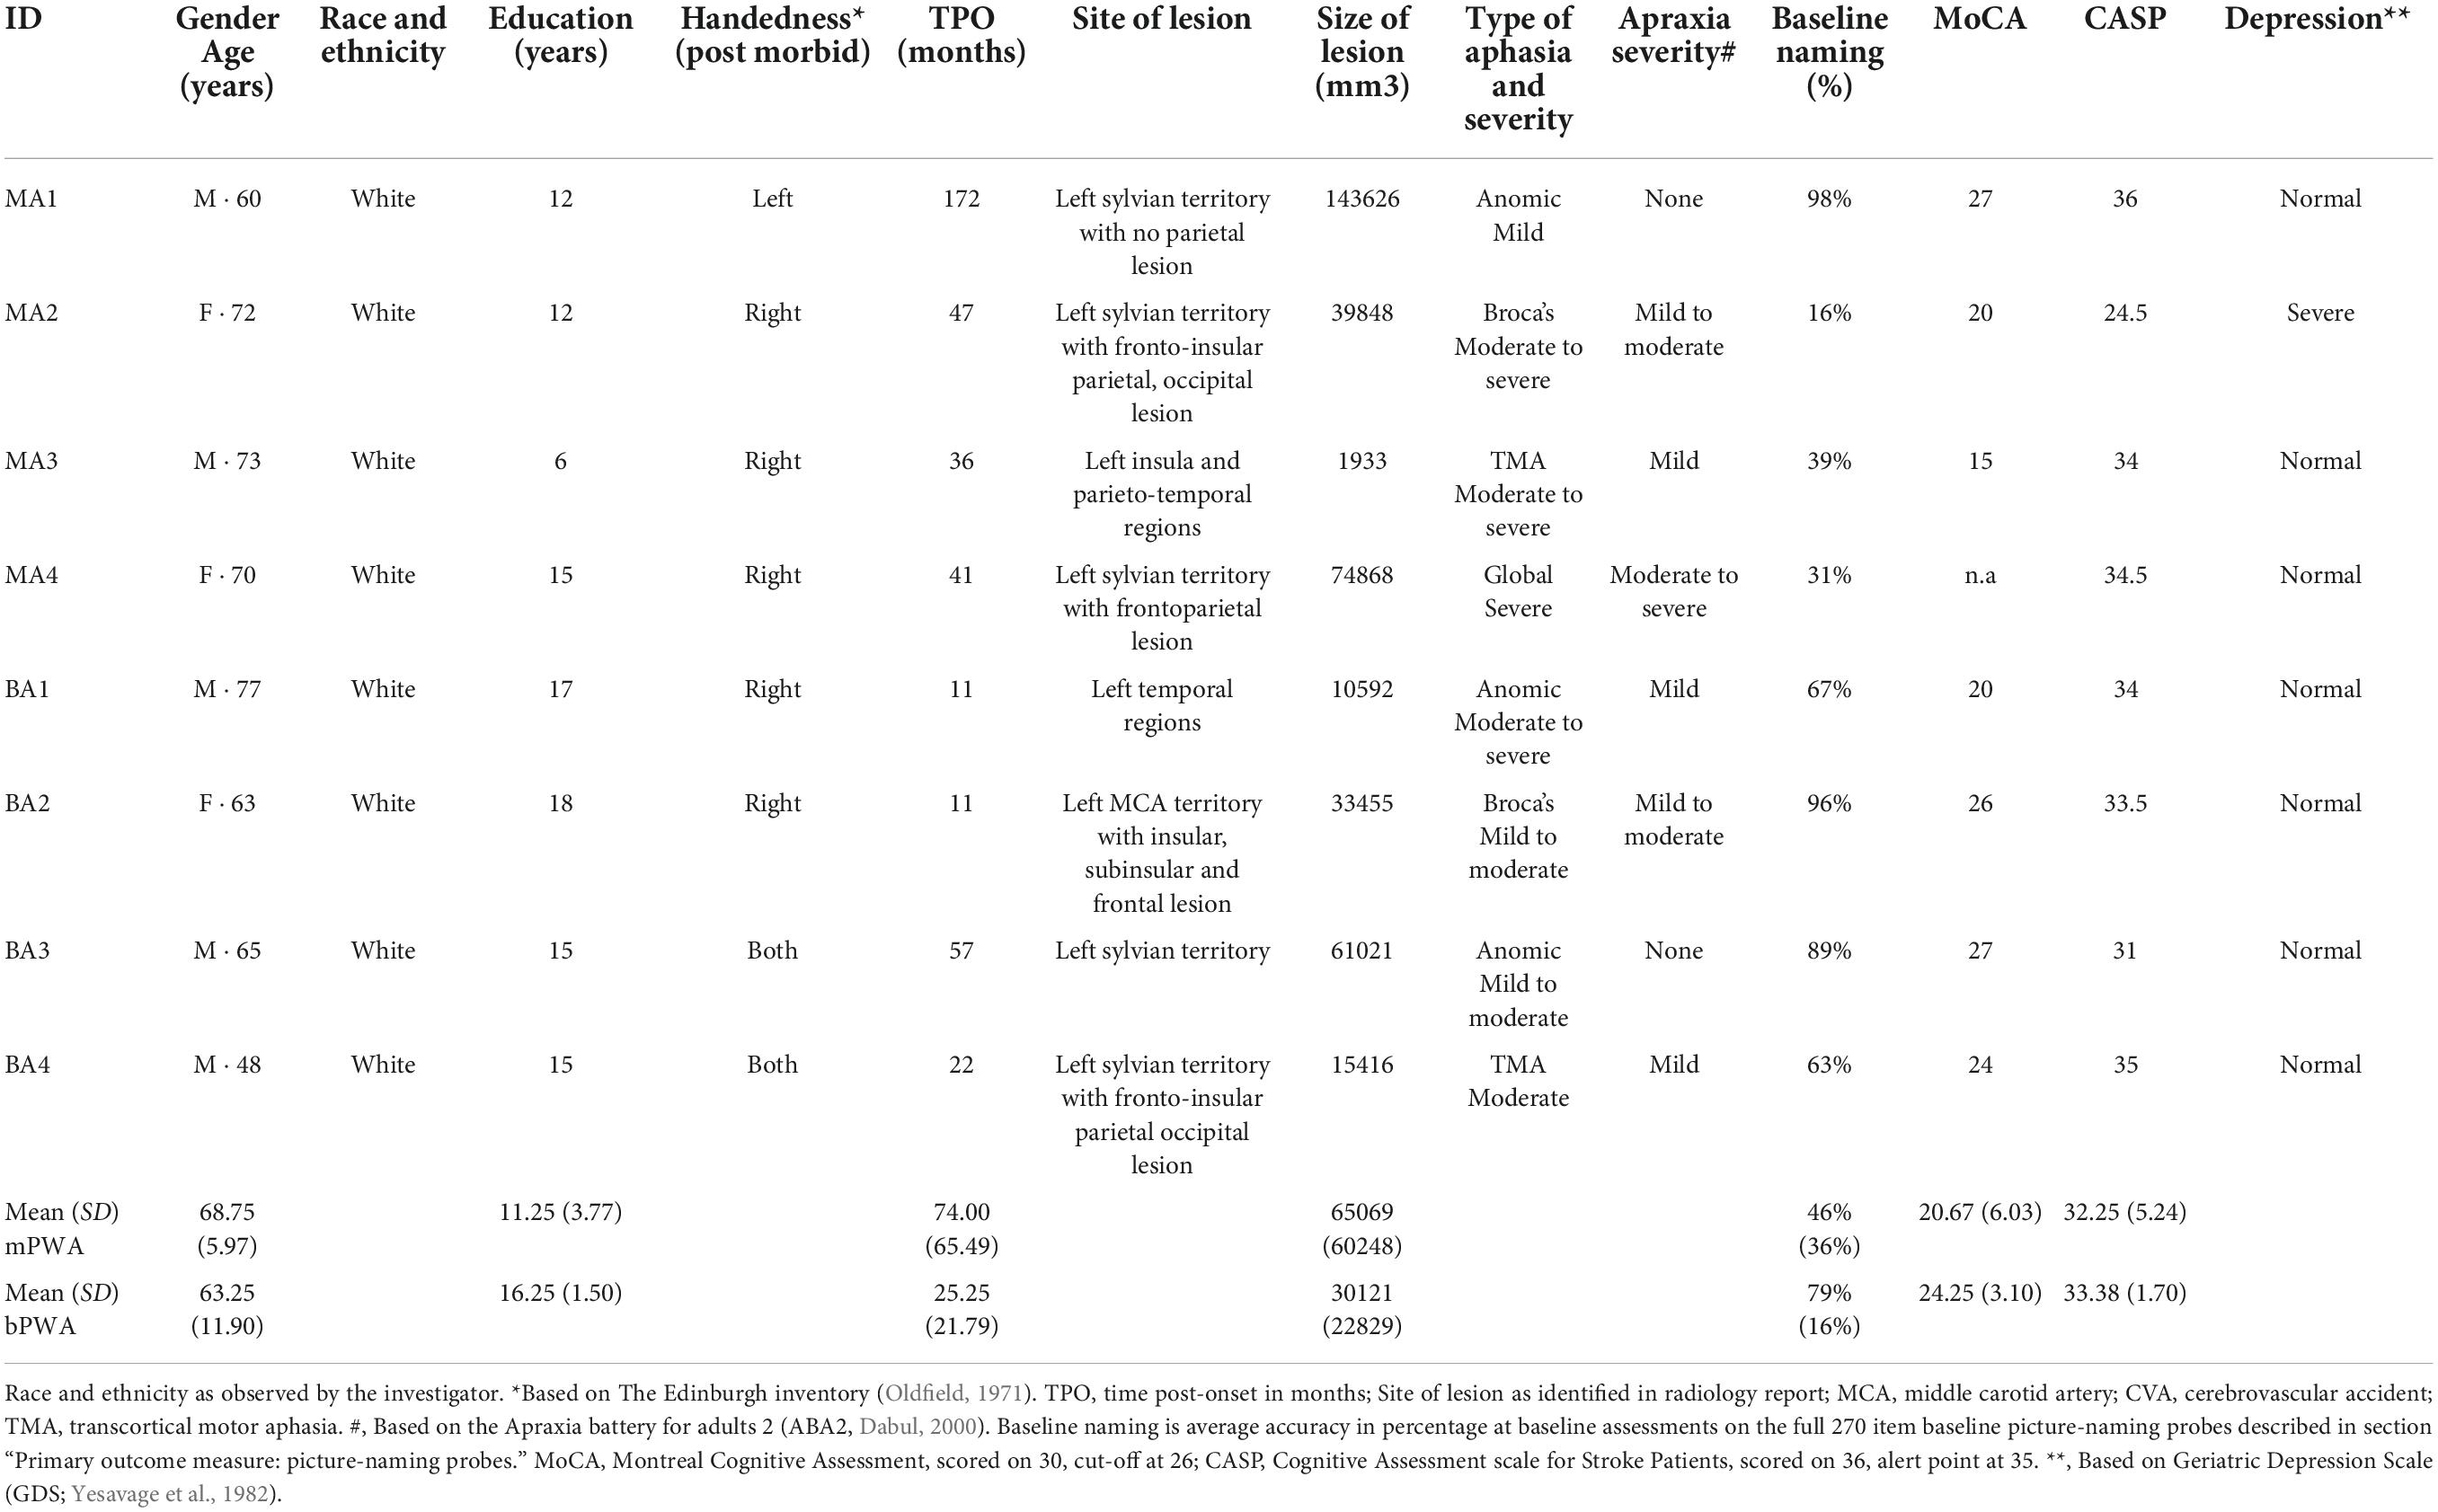
Table 1. Demographic information, clinical data, and standardized neuropsychological background test scores of participants with aphasia.
Mother tongue (L1) was French for all participants, and for bPWA, English was the second language (L2). All participants lived in the province of Quebec, a predominantly francophone province within the bilingual English-dominant country of Canada. Table 2 displays LEAP-Q language proficiency details. Figure 1 illustrates lesion overlay for both groups.
TABLE 2
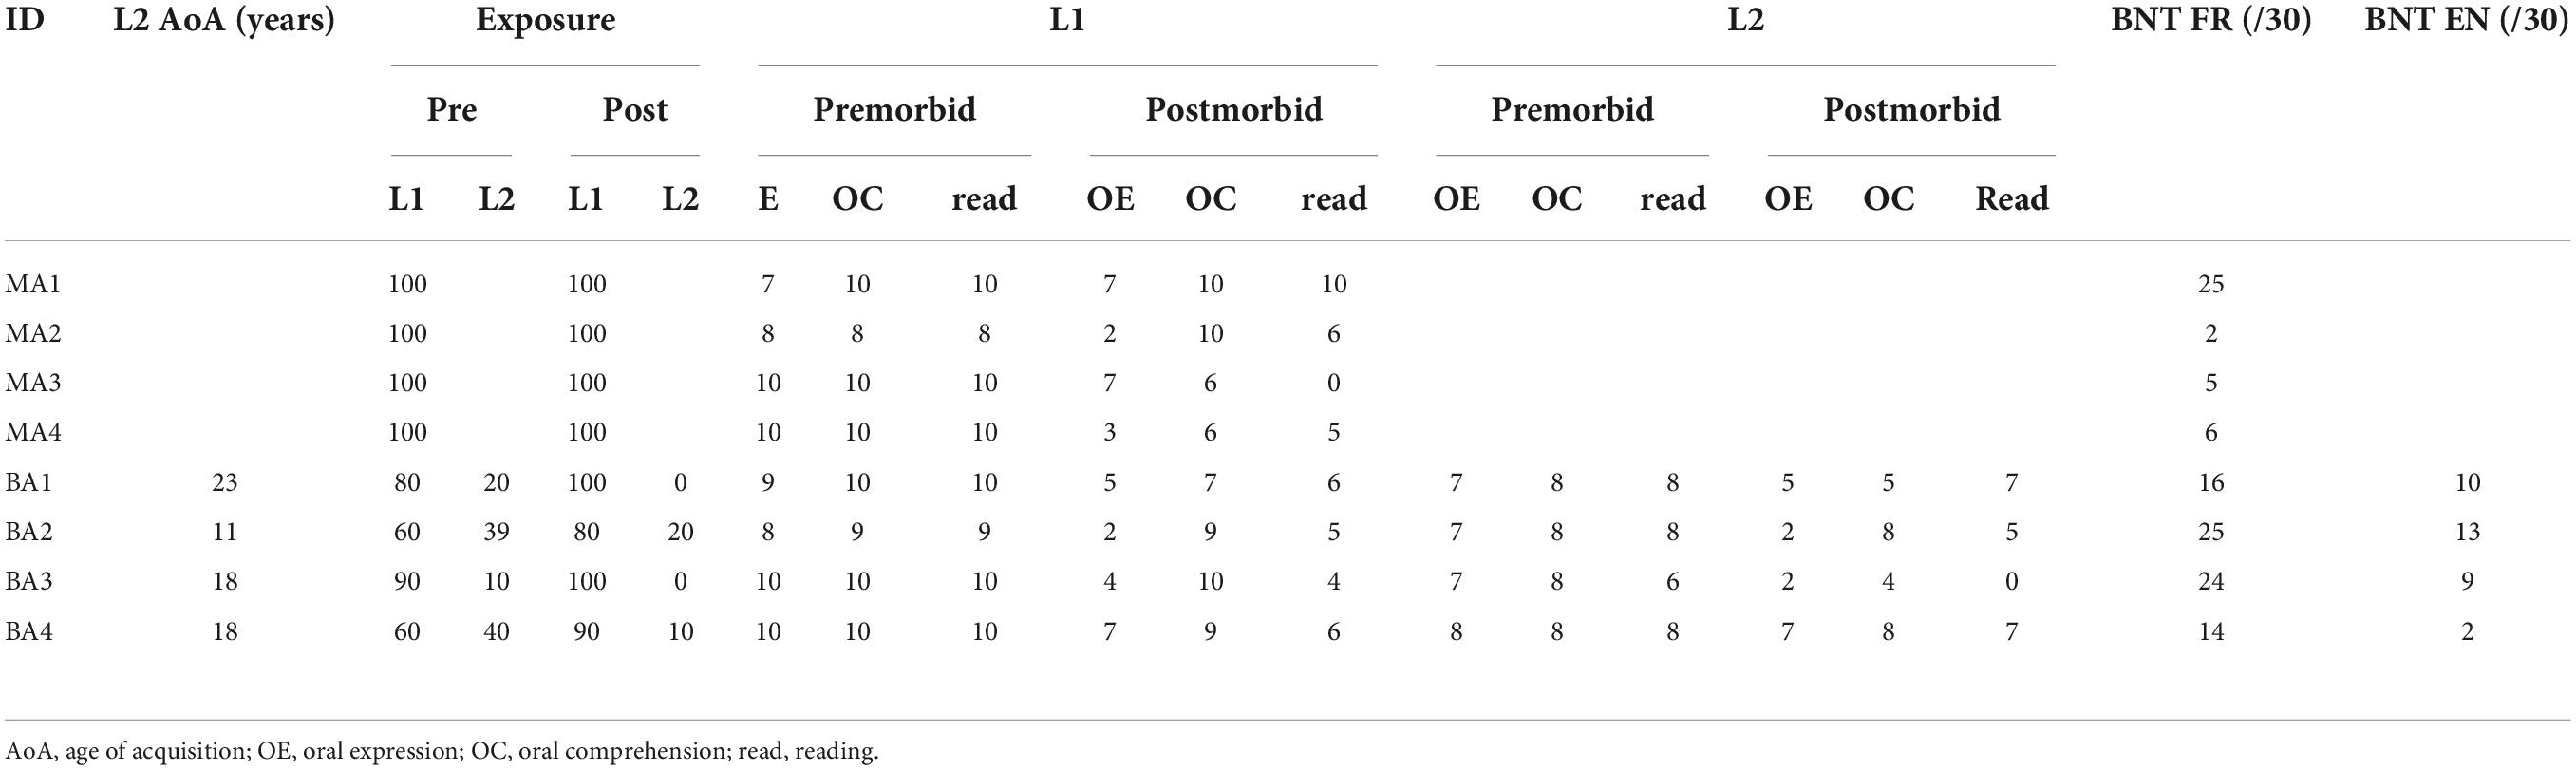
Table 2. Individual scores on language experience and proficiency questionnaire (LEAP-Q) for all participants.
FIGURE 1
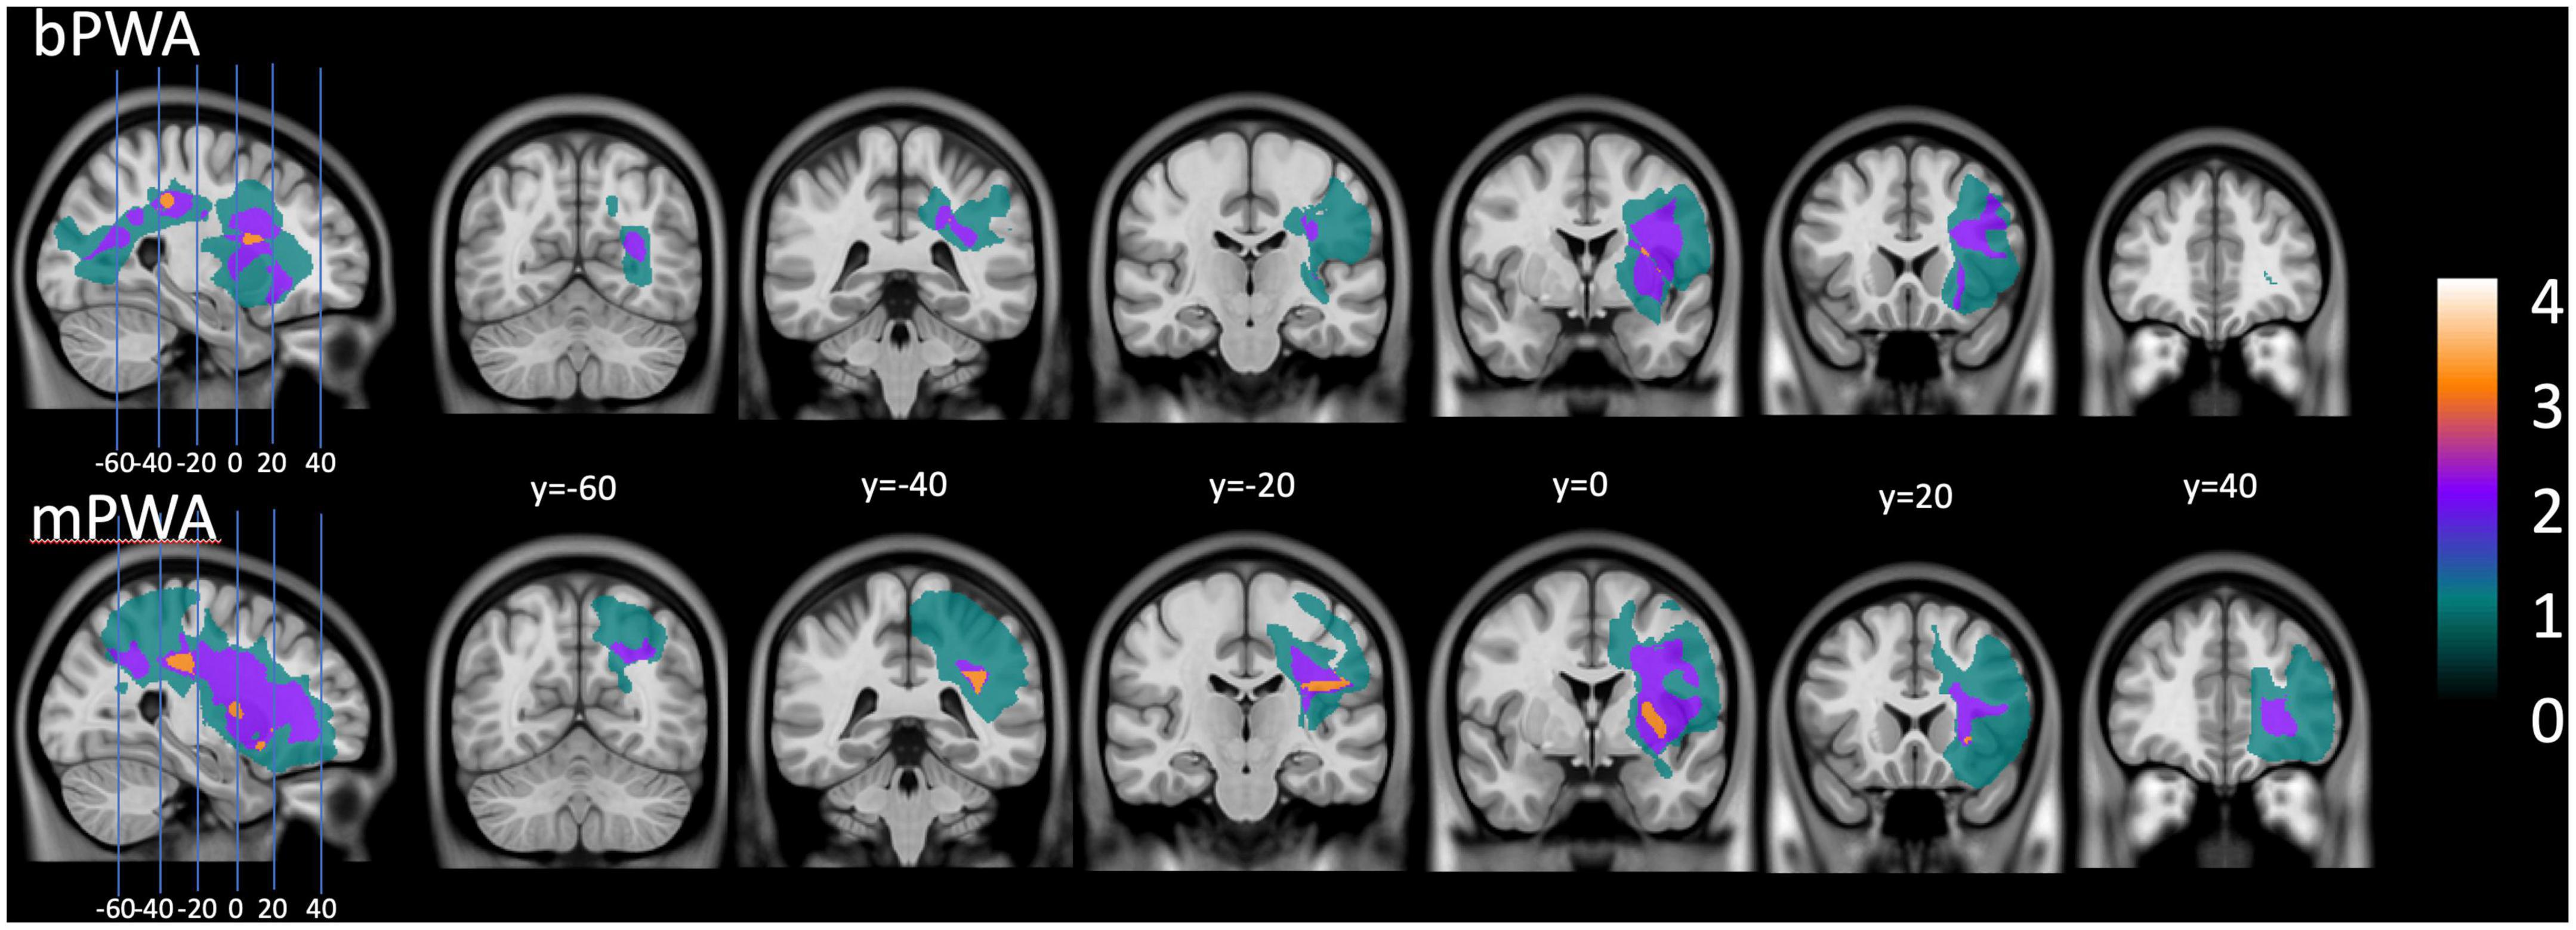
Figure 1. Lesion overlay plot: on the (upper section), lesion size for all bilingual participants with aphasia. On the (lower section), lesion size averaged for all monolingual participants with aphasia.
Participants were recruited as part of a larger research project studying the efficacy of Fr-PCA through community-based aphasia associations and community advertising. They all presented with chronic aphasia following a single left hemisphere stroke (minimum of 6 months post-onset) and were MRI compatible. Participants did not have premorbid or concomitant neurological conditions (e.g., developmental language disorder, neurodegenerative disorder, TBI, etc.), uncorrected hearing, or vision loss. Throughout the study, they did not receive any other speech-language therapy or therapy of any sort.
The CRIUGM’s aging and neuroimagery research ethics committee (CMER RNQ 15-16-02) approved this project. All participants provided informed written consent to participate in the study.
AssessmentsParticipants completed a comprehensive battery of language and cognitive tests before and after Fr-PCA therapy (see section “Language tasks” and Table 1 for battery tests). An SLP (MMT) administered the tests and split them into three 2.5-h assessment sessions to collect three picture-naming baselines and reduce fatigue. Still, some participants were unable to perform the Flanker task pre-therapy. Participants completed an adapted version of the Language Experience and Proficiency Questionnaire (Marian et al., 2007) with the SLP’s help and underwent a structural MRI (T1 image).
Primary outcome measure: Picture-naming probesThe baseline picture-naming probe comprises 270 pictures selected from the Bank of Standardized Stimuli (BOSS; Brodeur et al., 2011) and validated among healthy elderly French speakers (Masson-Trottier et al., 2016). It includes various categories such as fruits, vegetables, clothes, animals, body parts, furniture, and other objects. To be scored as a correct answer, participants had to name the picture correctly within 10 s (Evans et al., 2020). The baseline picture-naming probes were repeated in all three assessment sessions to generate two independent lists balanced for frequency, number of phonemes, and syllables (New et al., 2004). List 1 is composed of 20 items chosen with the participant to be treated in therapy, and List 2 is composed of 40 items not to be treated in therapy (i.e., to measure within-level generalization). Items selected for Lists 1 and 2 were named incorrectly on 2 or 3 baselines.
Secondary outcome measures Language tasksDuring the assessment sessions, several relevant language tasks were selected to be part of the comprehensive language assessment to characterize the type of aphasia in our participant sample and to measure the effect of Fr-PCA on within-level and across-level generalization (Webster et al., 2015). The tasks included in the comprehensive language assessment are the Test de denomination de Québec-60 (TDQ60; Macoir et al., 2017) for object naming, the Test de dénomination de verbes lexicaux en images-38 (DVL38; Webster et al., 2015) for verb naming, sub-tasks from the Montreal-Toulouse aphasia battery; oral comprehension, repetition, and verbal fluency with semantic criteria (Béland and Lecours, 1990), and a narrative discourse sample of the Cinderella story analyzed with the main concepts (MC) method (Dalton and Richardson, 2015; Richardson and Dalton, 2016).
The tasks used to measure within-level generalization are picture-naming accuracy variation on List 2 (untreated items) and performance variation on TDQ60, a francophone object-naming test. Tasks used to measure across-level generalization are the variation on DVL38, a verb naming test, on the sub-tasks in the MT86, and the variation on the narrative discourse main concept score.
Flanker taskParticipants underwent the Eriksen’s Flanker task (Eriksen and Eriksen, 1974) presented via the E-Prime 2.0 software (Psychology Software Tools, Inc., Sharpsburg, PA). The Flanker task assesses participants’ ability to suppress interference from irrelevant non-verbal stimuli. Processing verbal stimuli is difficult for PWA, making the Flanker task suitable for this population. They were presented with an array of five arrows in the middle of the screen and asked to determine whether the central arrow pointed left or right. A target stimulus (i.e., central arrow), which points leftward or rightward, is surrounded by two flankers on each side. There are two flanker conditions: congruent (arrows that point in the same direction as the central arrow) and incongruent (arrows that point in the opposite direction from the central arrow). The Flanker task began with a short instruction phase followed by 20 practice trials and 240 experimental trials consisting of an equal number of congruent and incongruent trials. Each began with a fixation cross of 400 ms, followed by the target window. The stimuli appear at the center of the screen for 3000 ms. The next trial starts as soon as the participant responds or after 3000 ms (whichever comes first). For the Flanker test, the outcome measures are the Flanker effect (incongruent RT – congruent RT), indicating interference effect, response times (RT), and error rates for congruent and incongruent conditions.
MRI structural image acquisitionImages were acquired using a 3 T MRI Siemens Trio scanner, which was updated (Prisma Fit) with a standard 32-channel head coil during data collection. A high-resolution structural image was obtained using a 3D T1-weighted imaging sequence using an MP-RAGE (TFE) sequence (TR = 2300 ms; TE = 2.98 ms; 192 slices; matrix = 256 × 256 mm; voxel size = 1 × 1 × 1 mm; FOV = 256 mm).
MRI image preprocessing and anatomical measurementsThe MRIs were acquired at the Functional Neuroimaging Unit in Montreal. For each participant, a lesion map was manually drawn, considered the golden standard for lesion mapping (Meinzer et al., 2013; Liew et al., 2021). FreeView visualization tool, a FreeSurfer (Fischl, 2012) feature, was used to perform the lesion mapping. On each axial slice, the border of the necrotic tissue was carefully delimited, and additional manual corrections were applied on coronal and sagittal planes to smooth the edge of the lesion volume and to remove enclaves of cerebrospinal fluid (CSF). Sometimes CSF can be mingled with necrotic tissue. The lesion volume was computed and stored for further analysis.
Since each MRI contained extensive lesions, we used the “Clinical toolbox” (Rorden et al., 2007) to replace the necrotic tissue with synthetic tissue, which was generated based on the gray and white matter distribution in the contralateral hemisphere. All MRI data were processed locally with FreeSurfer v6.0.02, Linux Mint 17 Ubuntu 14.04_x86_64 (Fischl et al., 1999, 2004; Fischl, 2012). The Destrieux atlas was used to apply the sulco-gyral parcellation and to build a surface-based atlas that included 74 labels per hemisphere (Fischl, 2012). The results enabled the obtaining of the thickness of cortical ROIs, which was computed as the average of (1) the distance from each white surface vertex to their corresponding closest point on the pial surface (not necessarily at a pial vertex) and (2) the distance from the corresponding pial vertex to the closest point on the white surface (Fischl and Dale, 2000). Further, for the lesioned left hemisphere of each participant, the output volume was filtered with the original lesion map to remove the segmentation portions corresponding to synthetic tissue. Considering the objective of generating cortical thickness data for each participant’s ROIs in the native space, normalization was not performed.
French-Phonological Component Analysis therapyThe PCA treatment protocol allows reproducibility of methodology. Fr-PCA was administered according to the standard protocol (Leonard et al., 2008) by an experienced SLP (MMT). The phonological components include: giving the first sound of the target (Question: “What sound does it start with?”), the final sound (”What sound does it end with?”), the number of syllables (”How many beats does the word have?”), providing a first sound associate (”What other word starts with the same sound?”) and a rhyme to the target (”What does this rhyme with?”) (Leonard et al., 2008).
Fr-PCA therapy started immediately after the assessment. Participants received Fr-PCA for the items on List 1 (see above) for 15 1-h face-to-face sessions, three sessions per week for 5 weeks. Participants were met either at their homes or the research center, whichever they preferred. The PWA was asked to generate the answers to each cue; if this was not possible, they could choose between three valid options to promote active participation (Hickin et al., 2002). All items on List 1 were repeated 1 to 4 times during the session according to the participant’s pace and tolerance. Fr-PCA was presented on a laptop and coded into a python program allowing automatic randomization of items from session to session and online scoring of naming performance for each item. The SLP controlled therapy display on the laptop, writing the cues on the therapy screen, rating the answers given by the PWA, and giving appropriate feedback during the therapy.
Data analysisFor all standardized language tests (TDQ60, DVL38, repetition, verbal fluency, and oral comprehension), z-scores were calculated using the normative mean and standard deviation values for the participant’s age and education level (see Table 1). The following formula was used to calculate the z-scores where the mean and standard deviation are from the normative data available:
zscore=(RawScore-Mean)/StandardDeviation.(1)
Z-scores allow comparing language abilities and improvements following Fr-PCA across age and education levels. As per standard clinical guidelines used in speech-language pathology, z-scores below – 1.5 SD were considered mild impairment, and z-scores below – 2 SD were considered severe impairment (Spaulding et al., 2012; Satoer et al., 2019). Raw scores can be found in the Supplementary material.
To describe narrative discourse, main concepts were identified in the narrative discourse for the Cinderella storytelling task and then scored for accuracy and completeness (Nicholas and Brookshire, 1995). A main concept that was accurate and complete received a score of 3, an accurate incomplete or inaccurate complete main concept was given 2, and an inaccurate incomplete was scored 1 (Richardson and Dalton, 2016). The main concept score is the sum of all main concepts.
Data analysis planData analysis was completed on SPSS 26 (IBM Corp, 2019) using an α-value of 0.05. The data analysis plan is presented for each specific question. We used a mixed method case-series analysis to draw interpretation from converging evidence.
Efficacy of French-Phonological Component AnalysisTo answer the question of therapy efficacy, a case series analysis was conducted to investigate the acquisition following Fr-PCA, and group analyses were additionally performed to answer the within- and across-level generalization and transfer questions.
Acquisition: Case seriesFour analysis methods appropriate for single-subject research designs were used to investigate the effect of Fr-PCA on naming accuracy for treated items. The results of these methods were merged to indicate if there was strong evidence (if all methods were large or significant), moderate evidence (if two or three of the methods were large or significant), weak evidence (if only one of the methods was large or significant), or no evidence of a treatment effect.
First, visual inspection was performed to judge whether change across the treatment phase was large enough to be seen by the naked eye (Franklin et al., 1996). Changes in performance were determined to be substantial if: (1) the mean probe score was greater than the mean baseline score, (2) there was no overlap of probe scores with baseline phase scores, and (3) probe scores surpassed the extended baseline trend line. For the visual inspection, accuracy from baseline assessments (3), therapy sessions (15), and post-therapy assessment (1) are used.
Second, effect size (d) was calculated to determine clinical significance using the standardized difference approach (Allison et al., 1996; Neumann, 2018), where
d=(scorepost-meanbaseline)/standarddeviationbaseline.(2)
For the analysis of effect size, the data from both assessments are used (three baselines and post-therapy). Following the guidelines given by Beeson and Robey (2006), it is not possible to perform d calculation when standard deviationbaseline = 0. When this happened, we calculated a pooled standard deviation using the last three therapy sessions, where
standard deviationpooled=standard deviationbaseline+standard deviationtherapy 13−14−152.
An effect size equal to or greater than 4.0, 7.0, and 10.1 was considered a small, medium, or large magnitude of treatment effect (Beeson and Robey, 2006).
Third, the Tau U Test of Trend, a non-parametric method used to measure non-overlap between two phases (A and B), was used to compare baseline accuracy scores to intervention accuracy scores. This analysis was performed using the Tau-U Calculator (Vannest et al., 2016). For the calculation of Tau-U, accuracy from baseline assessments (3) and therapy sessions (15) are used.
Finally, individual participant naming accuracy (i.e., correct/incorrect) was analyzed by item, using the WEighted STatistics (WEST) method outlined by Howard et al. (2014). This method overcomes problems of autocorrelation inherent in repeated measures designs; a single weighted score representing repeated measurements of an item is obtained and analyzed using a one-sample t-test. More specifically, WEST-ROC and WEST-Trend were calculated to respectively verify that the rate of change (ROC) post-therapy is significantly greater than the expected null ROC at baseline while also accounting for existing trends in the data, and that existing linear trends in the data are accounted for, indicating significant improvement, over and above existing trends in the data (Howard et al., 2014). In this specific analysis, for WEST-ROC, item naming scores for the three baselines and post-therapy assessment were multiplied by factors of 2, –1, –4, and 3, whereas for WEST-Trend, three baselines and post-therapy assessment were multiplied by factors of –3, –1, 1, and 3. For the WEST procedure, 4 one-sample t-tests (one-tailed) were conducted per participant. Using the Holm–Bonferroni procedure, alpha was initially set at 0.05 and adjusted accordingly for all subsequent comparisons to 0.05/4 = 0.0125.
Within- and across-level generalization: Case series and group analysisFirst, to assess within-level generalization, we calculated individual effect sizes and WEST statistics with the untreated items following the same method described above. Furthermore, to complete the within-level generalization and to assess across-level generalization, Wilcoxon signed-rank tests3 were performed with the pre-therapy and post-therapy language z-scores for all PWA to see if Fr-PCA significantly improved language performance.
To verify the potential impact of bilingualism on therapy within- and across-level generalization, a non-parametric independent sample Mann–Whitney U test was completed comparing pre- and post-therapy score differences (called variation score) between groups for standardized language tests z-scores(variationscore = z−scorepost−therapy−z−scorepre−therapy).
Transfer: Group analysisFinally, to investigate improvement transfer following Fr-PCA, a Wilcoxon signed-rank test was also performed for the pre- and post-therapy outcome measures of the Flanker task to examine therapy transfer. A non-parametric independent sample Mann–Whitney U test was applied to compare post-therapy Flanker outcome measures between bPWA and mPWA to verify the potential impact of bilingualism on cognitive control, given that 2 monolingual participants could not perform the Flanker task before therapy.
Impact of lesion locationConsidering the variability in lesion location among participants with strokes, a subset of ROIs damaged in at least 2 mPWA and 2 bPWA (see section “MRI image preprocessing and anatomical measurements” MRI Image Preprocessing and Anatomical Measurements for procedure) was identified to perform the correlations described below. To account for potential differences in lesion location across groups (mPWAs and bPWAs), a Mann–Whitney U test was performed to compare the number of voxels within each identified ROI between groups.
To answer the question regarding the impact of lesion location on pre-therapy skills, a Spearman’s rank-order correlation was performed with the number of voxels in each ROI within the lesion mask and scores on language and cognitive performance tasks before therapy for all PWA. To assess the impact of the lesion location on therapy-induced improvements (within- and across generalization), a Spearman’s rank-order correlation was also performed between the number of voxels in each ROI within the lesion mask and variation scores on language performance tasks.
To interpret the Spearman’s correlation, rs = 0.00–0.19 was considered a very weak correlation, rs = 0.20–0.39, a weak correlation, rs = 0.40–0.59, a moderate correlation, rs = 0.60–0.79, a strong correlation, and rs = 0.80–1.0, a very strong correlation (Schober et al., 2018).
Role of right hemisphereFinally, to answer the question concerning the potential experience-induced RH compensatory neuroplasticity, a non-parametric independent sample Mann–Whitney U test was completed comparing cortical thickness between bPWA and mPWA (Felton et al., 2017). For ROIs with significantly different cortical thickness between groups, a Spearman’s rank correlation was performed between cortical thickness and language and cognitive control scores pre-therapy and corresponding variation scores.
ResultsThe result section for this paper is outlined in three main sections. Firstly, the efficacy of Fr-PCA is investigated with both case series analysis and group comparisons in terms of acquisition (improvement on treated items – List 1), within-level generalization (improvement on untreated picture-naming accuracy; untreated items – List 2 and TDQ60), across-level generalization (improvement on other language abilities) and transfer (improvement on cognitive control task). Secondly, the impact of the lesion location on pre-therapy linguistic and cognitive performances is examined using correlations. Finally, the role of the RH is explored in relation to the status of bilingualism and pre-therapy linguistic and cognitive performances.
Efficacy of French-Phonological Component AnalysisTo determine the efficacy of Fr-PCA, a mixed method was employed. Case series analysis is used to examine the acquisition with treated items using visual inspection of the data, analysis of effect size, Tau-U Test of Trend, and WEST statistics.
Furthermore, therapy-induced generalization (within- and across-levels) is examined with case series analysis and group analysis. Within-level generalization (naming accuracy of untreated items) is also investigated with two case series methods: analysis of effect size and WEST statistics. Then, we investigate the effect of Fr-PCA by comparing pre-therapy scores on standardized language tests to post-therapy scores. Finally, we compare the improvements of mPWA and bPWA for a potential impact of bilingualism on therapy outcomes.
AcquisitionTo examine acquisition following Fr-PCA, case-series analyses were performed. The summary of the case series analysis incorporating four analysis methods can be found in Table 3. Figure 2 shows each participant’s accuracy for items on list 1 used to measure acquisition. This figure is used for the visual inspection in the case study. Each participant will be discussed below.
TABLE 3
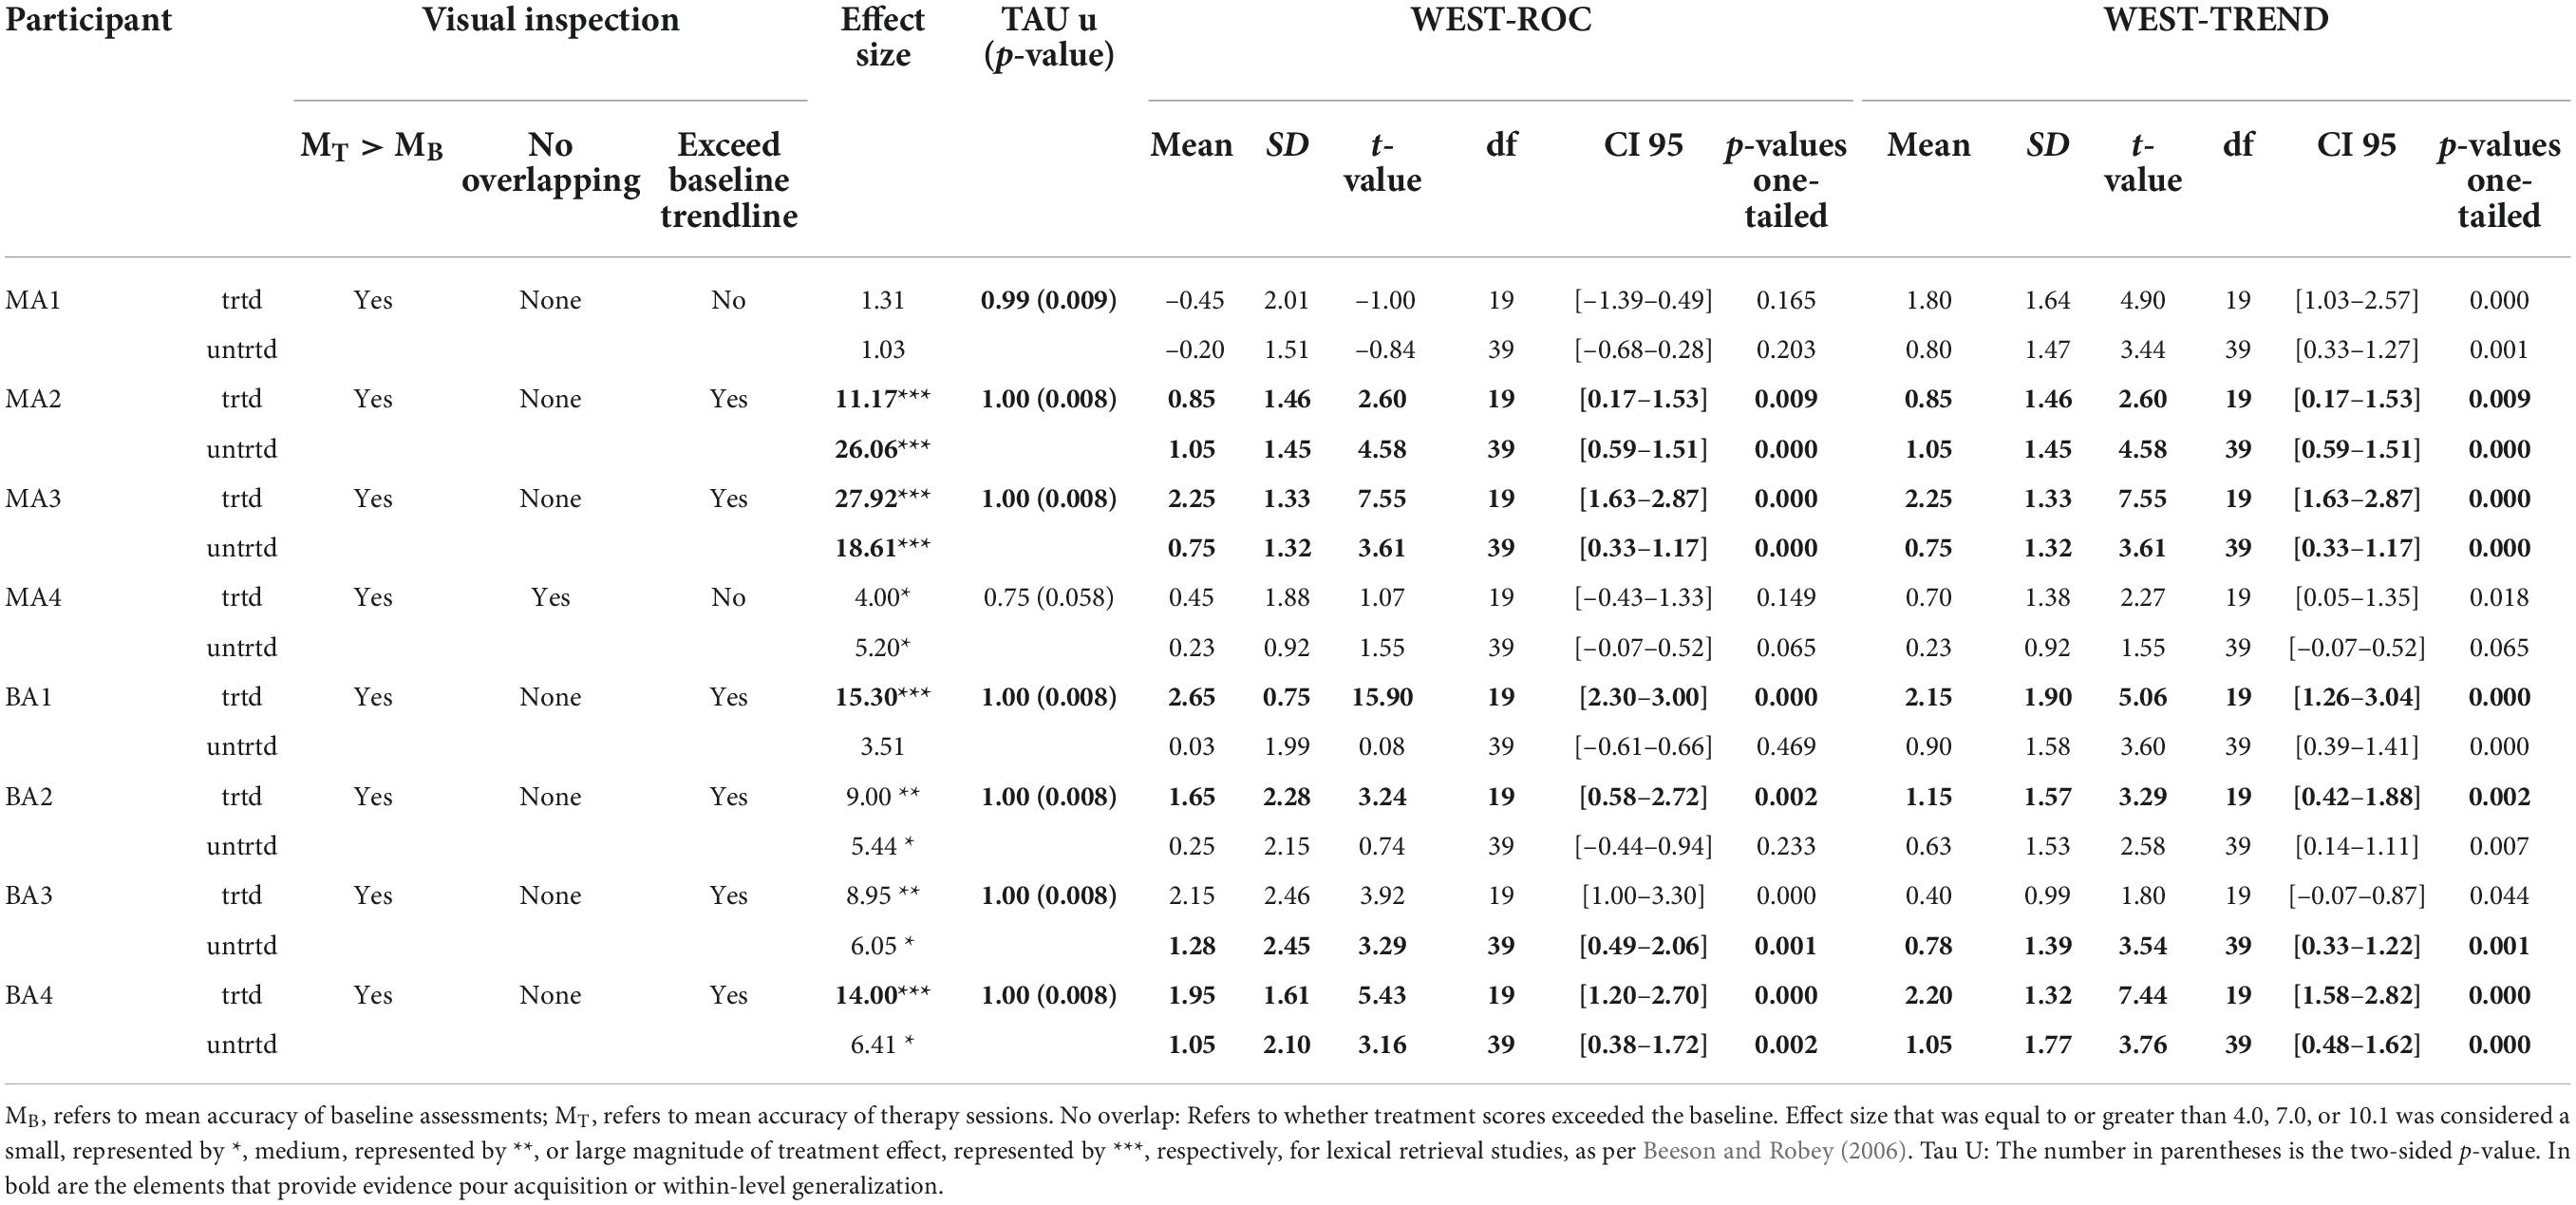
Table 3. Case-study result summary: Evidence of acquisition and within-level generalization comparing baseline and treatment performance phases.
FIGURE 2
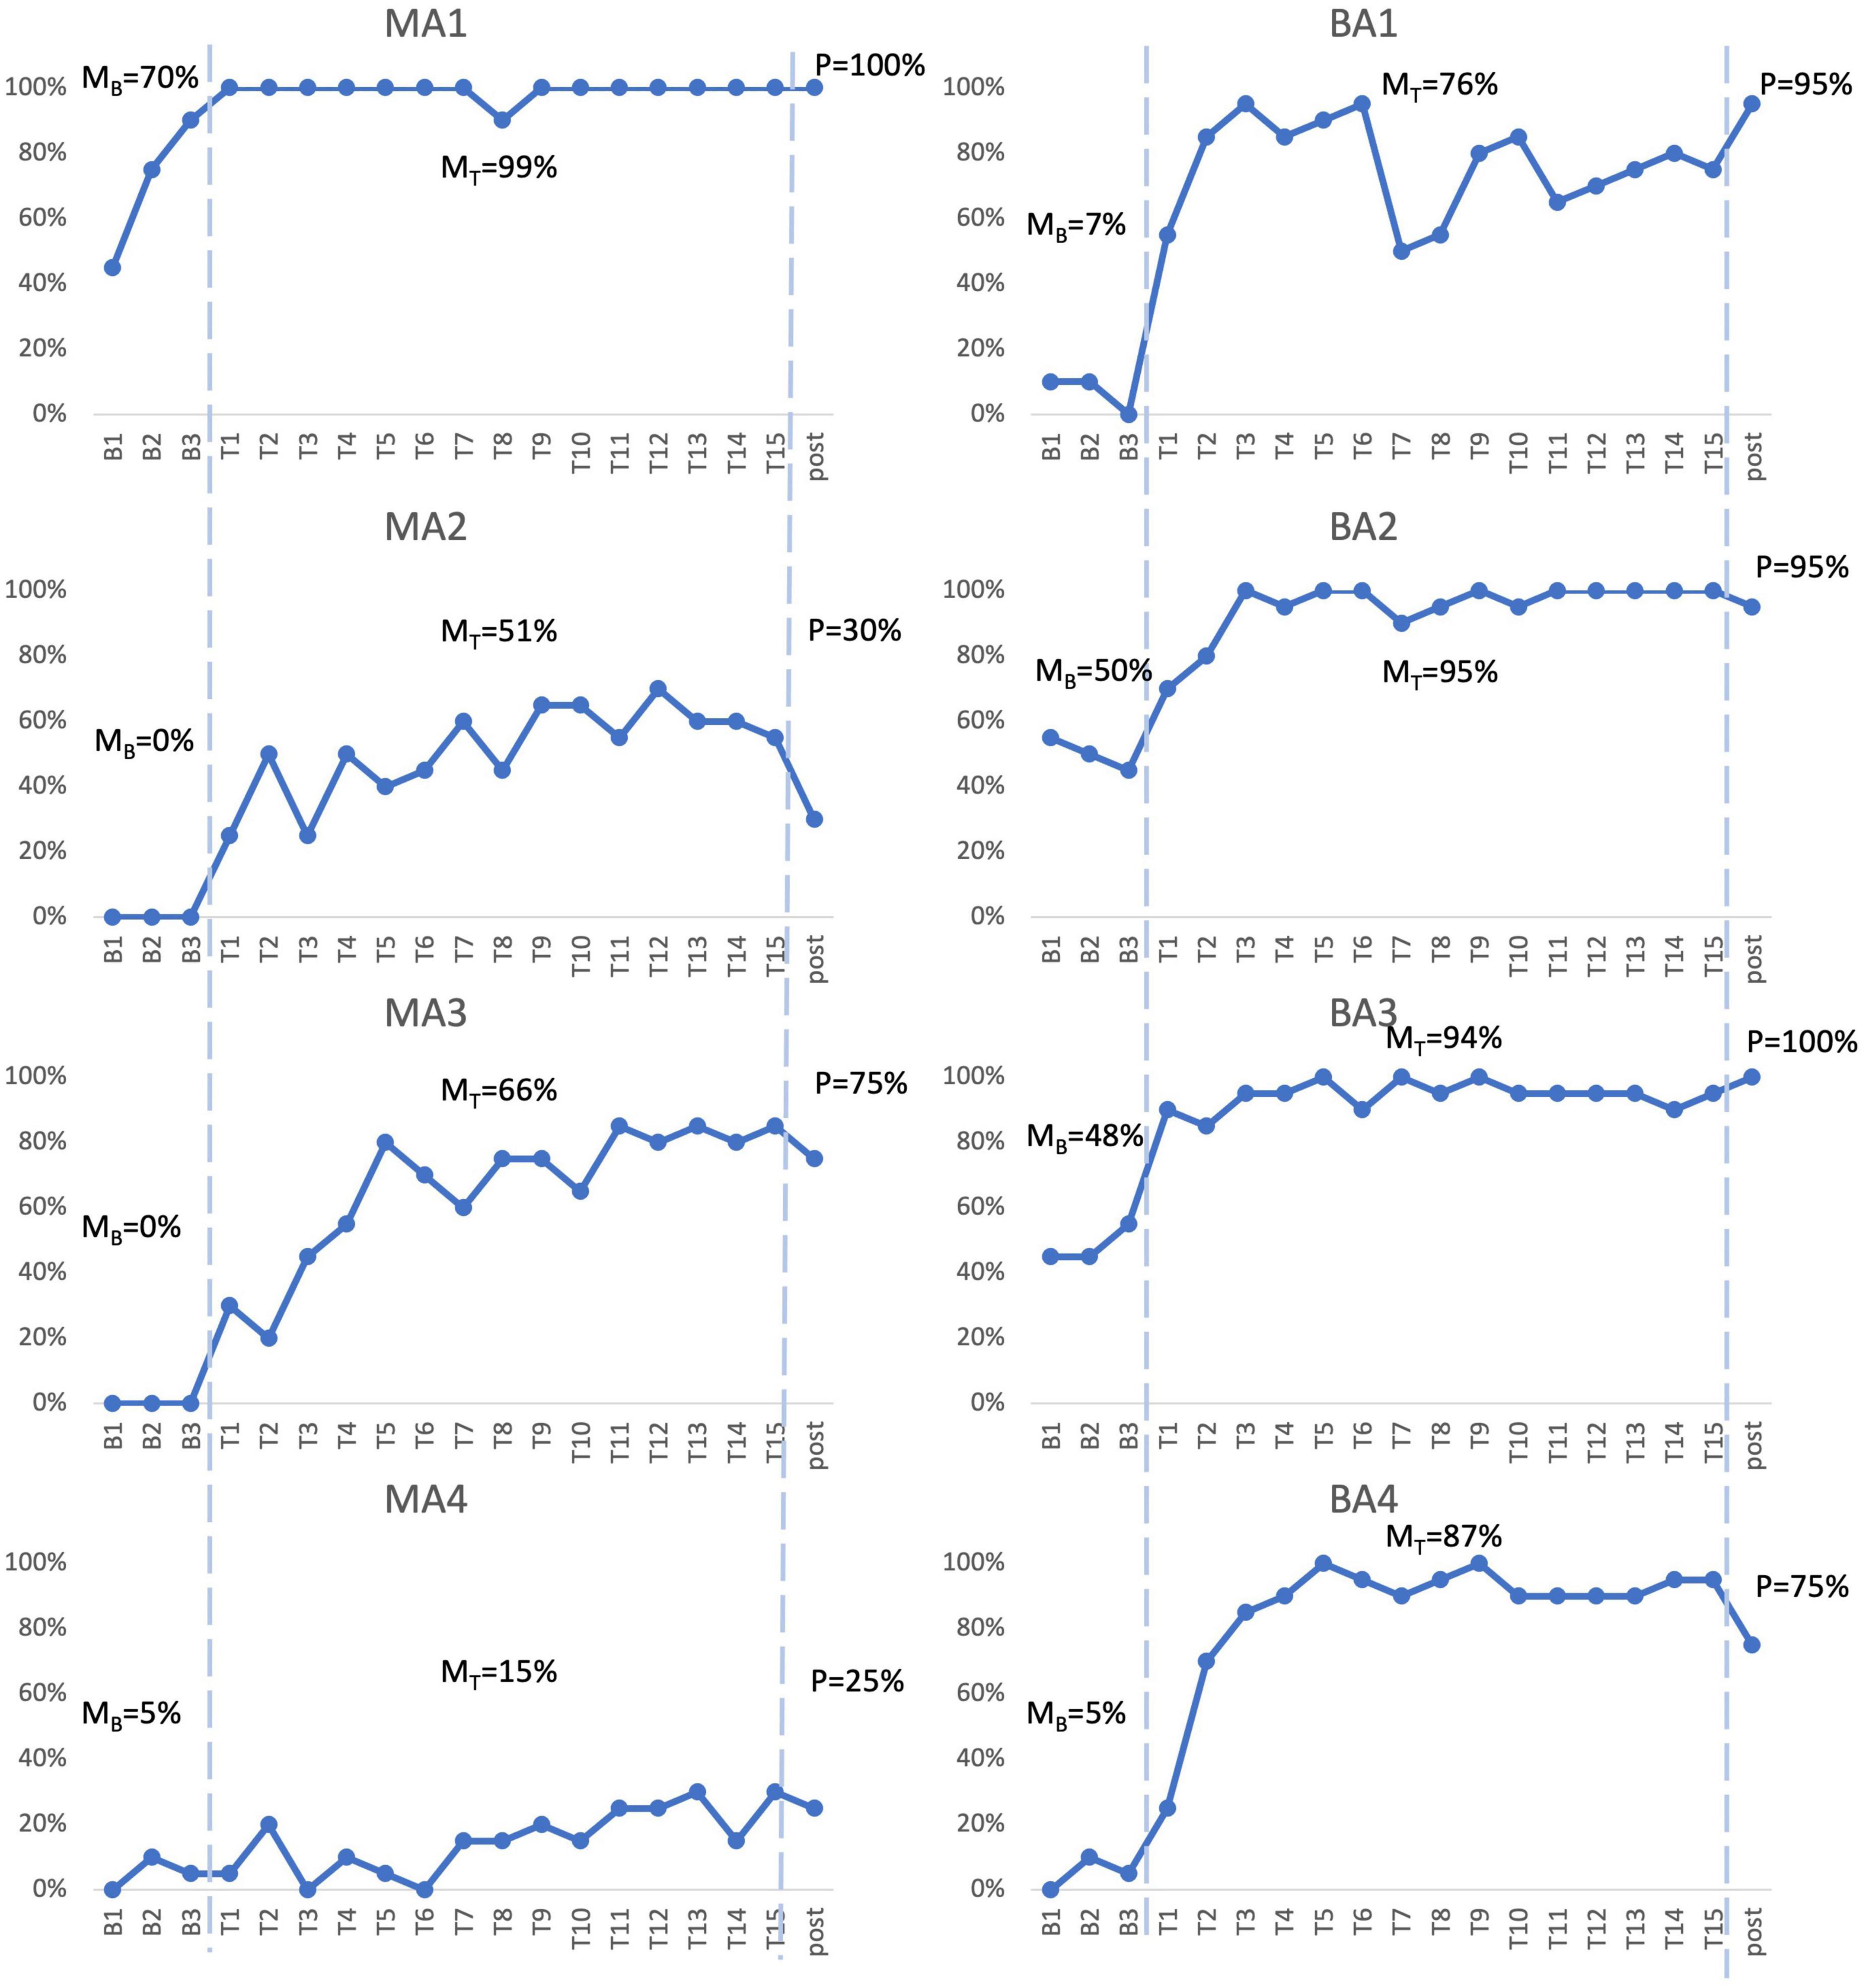
Figure 2. Picture-naming probe results. Repeated probe data for all participants. Graphs reflect percent accurate production for treated items at baseline assessments, each therapy session, and post-treatment assessment. MB refers to mean accuracy of baseline assessments, MT refers to mean accuracy of therapy sessions, P refers to accuracy at post-therapy assessment.
MA1, the mPWA with the mildest aphasia (mild aphasia, no apraxia), demonstrated weak acquisition following Fr-PCA. Although MA1 showed a higher mean accuracy rate during therapy phase (99%) than baseline phase (70%) and no overlapping points between the phases, visual inspection revealed that points in therapy phase did not exceed baseline trendline, as he showed a noticeable improvement between baseline sessions in terms of accuracy. Indeed, after improving at each baseline assessment, MA1 reached ceiling effect at the first therapy session. This suggests that therapy performances do not surpass the improvement already initiated during baseline assessments. Even if WEST-Trend is significant, it is recommended that the effect of treatment be considered significant when both the WEST-Trend and WEST-ROC analyses yield significant results (Howard et al., 2014). Thus, given the non-significant result of WEST-ROC, this analysis is considered inconclusive, as is his effect size (ES = 1.31; non-significant). Finally, MA1 showed a significant Tau-U (Tau U = 1.00; p = 0.008), the only analysis method supporting acquisition for MA1. Although MA1 showed a limited gain in accuracy, Fr-PCA produced improvement in response time and pronunciation level, not reflected with the main outcome variable in this study.
MA2, who had moderate to severe aphasia and mild to moderate apraxia, showed strong evidence of acquisition following Fr-PCA. She demonstrated a greater mean accuracy rate during the therapy phase (51%) than during the baseline phase (0%), she did not show overlap in performance between therapy and baseline phases, and therapy improvements exceeded baseline trendline. When looking at the effect size, MA2 showed a large effect size for acquisition following Fr-PCA (ES = 11.17) and a significant Tau-U result (Tau U = 1.00; p = 0.008). Finally, both WEST-ROC and WEST-Trend yielded significant results. All four methods support MA2’s acquisition following Fr-PCA.
MA3, who presented moderate to severe aphasia and mild apraxia, showed strong evidence of acquisition following Fr-PCA. There was greater mean accuracy rate during the therapy phase [compared to baseline phase (0%)], with no overlap in performance between therapy and baseline phases. Therapy improvements exceeded baseline trendline. When looking at the effect size, MA3 showed a large effect size for acquisition following Fr-PCA (ES = 27.91) and a significant Tau-U result (Tau U = 1.00; p = 0.008). Finally, both WEST-ROC and WEST-Trend yielded significant results. All four methods support MA3’s acquisition following Fr-PCA.
MA4, who presented the most severe aphasia and moderate to severe apraxia, demonstrated no evidence of acquisition following Fr-PCA. Although MA4 showed a higher mean accuracy rate during therapy phase (15%) than baseline phase (5%), visual inspection revealed overlapping points between the baseline and therapy phases, and mean accuracy during therapy phase did not exceed baseline trendline. The non-significant Tau-U test (Tau U = 0.75; p = 0.058) further indicated overlap between phases. In addition, there were non-significant WEST-ROC and WEST-Trend results, indicating the improvement is neither greater than the null ROC expected at baseline, nor greater than the baseline trend. MA4 did show a small effect size for acquisition (ES = 4.00). However, none of the methods provided large or significant support for acquisition following Fr-PCA for MA4.
BA1, who had moderate to severe aphasia and mild apraxia, showed strong evidence of acquisition following Fr-PCA. He demonstrated a greater mean accuracy rate during therapy phase (76%) than during baseline phase (7%), he did not show overlap between performance during therapy phase compared to baseline phase, and therapy improvements exceeded baseline trendline. This was confirmed by a significant Tau-U result (Tau U = 1.00; p = 0.008). When looking at the effect size, MA3 showed a large effect size for acquisition following Fr-PCA (ES = 15.30). Finally, both WEST-ROC and WEST-Trend yielded significant results. All four methods converge in supporting BA1’s strong acquisition following Fr-PCA.
BA2, who presented mild to moderate aphasia and mild to moderate apraxia, showed moderate evidence of acquisition following Fr-PCA. There was a greater mean accuracy rate during therapy phase (95%) than during baseline phase (50%), she did not show overlap between performance during therapy phase compared to baseline phase and showed therapy improvements that exceeded baseline trendline. This was confirmed by a significant Tau-U result (Tau U = 1.00; p = 0.008). When looking at the improvement during therapy phase, both WEST-ROC and WEST-Trend yielded significant results, indicating the ROC post-treatment was significantly greater than the null ROC and that improvement was above existing trends in the data. However, looking at the effect size, BA2 showed a moderate effect size for acquisition following Fr-PCA (ES = 9.00). Thus, only three methods give large or significant support of acquisition following Fr-PCA for BA2.
BA3, who had mild to moderate aphasia, showed moderate evidence of acquisition following Fr-PCA. He demonstrated a greater mean accuracy rate during the therapy phase (94%) than during the baseline phase (48%), did not show overlap between performance during therapy phase compared to baseline phase and showed therapy improvements that exceeded baseline trendline. This was confirmed by a significant Tau-U result (Tau U = 1.00; p = 0.008). However, looking at the improvement during therapy phase, although WEST-ROC yielded a significant result, WEST-Trend did not survive correction for multiple comparisons, indicating the improvement did not surpass existing trends in the data. Furthermore, looking at the effect size, BA3 showed only a moderate effect size for acquisition following Fr-PCA (ES = 8.95). Thus, only two of the four methods give large or significant support of acquisition following Fr-PCA for BA2.
BA4, who had moderate aphasia and mild apraxia, showed strong evidence of acquisition following Fr-PCA. He demonstrated a greater mean accuracy rate during the therapy phase (87%) than during the baseline phase (5%), he did not show overlap between performance during therapy phase compared to baseline phase and showed therapy improvements that exceeded baseline trendline. This was confirmed by a a significant Tau-U result (Tau U = 1.00; p = 0.008). When looking at the effect size, MA3 showed a large effect size for acquisition following Fr-PCA (ES = 14.00). Finally, both WEST-ROC and WEST-Trend yielded significant results. All four methods converge in supporting BA4’s strong acquisition following Fr-PCA.
In sum, for the mPWA group, one participant showed strong evidence of acquisition (MA3), one participant showed moderate acquisition (MA2), one participant showed weak evidence (MA1), and one participant showed no evidence (MA4). Figure 2 shows, for MA2, MA3 and MA4, some variability between therapy sessions in terms of performance. For the bPWA group, two participants showed strong evidence (BA1 and BA4), and two showed moderate evidence (BA2 and BA3) with more stable and rapid improvement rates.
Within-level generalizationTo examine within-level generalization, mixed-methods analyses were carried out. Two case series methods, namely analysis of effect size and WEST-ROC and WEST-Trend statistics, were employed to examine the improvement of untreated items. Figure 3 shows the response accuracy for each participant at assessment points for both treated and untreated items. The pre- and post-therapy scores on the TDQ60 – a francophone object-naming standardized task – were then compared to investigate the within-level generalization effect of Fr-PCA.
FIGURE 3
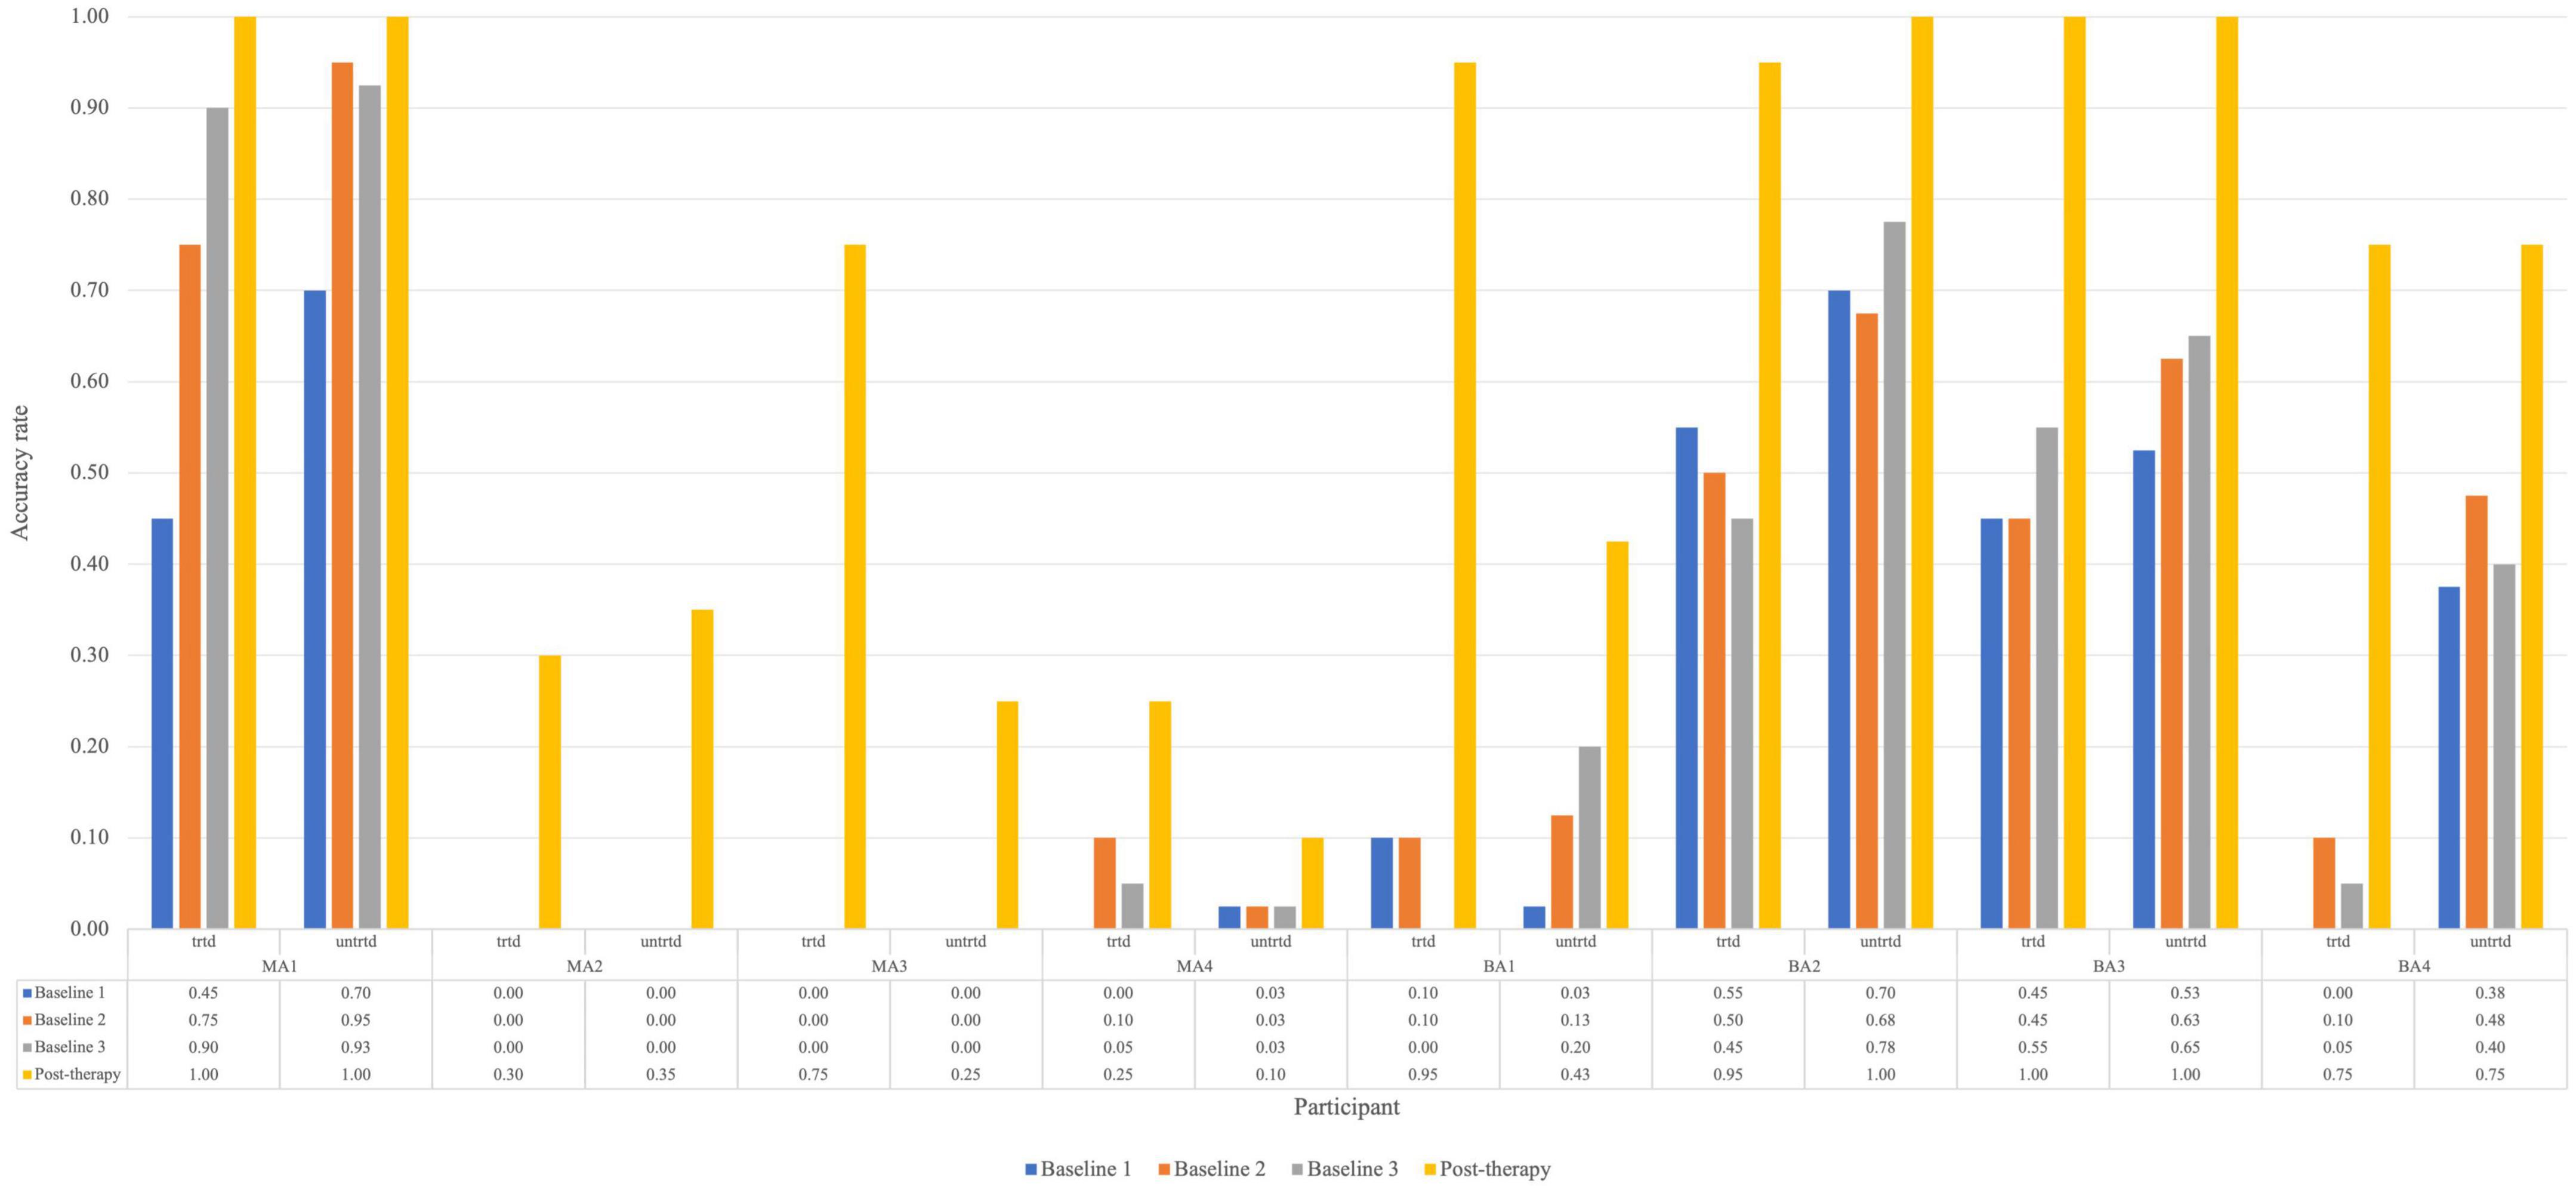
Figure 3. Accuracy rate for each participant for treated and untreated items at each picture-naming probe. Trtd, treated items (20) and untrtd, untreated items (40).
For untreated items, the analysis is based on baseline and post-therapy performance. When looking at Figure 2, all participants improved from the average baseline accuracy to post-therapy. Looking at the effect size of within-level generalization following Fr-PCA to untreated items, two participants show large effect sizes (MA2, ES = 26.06; MA3, ES = 18.61), four participants show small effect size of improvement on untreated (MA4, ES = 5.20; BA2, ES = 5.44; BA3, ES = 6.05; BA4, ES = 6.41), and two participants show non-significant effect size (MA1 and BA1). As for the WEST analysis, four participants show both significant WEST-ROC and WEST-Trend (MA2, MA3, BA3 and BA4). Additionally, one participant shows a significant WEST-ROC (BA3), and two show a significant WEST-Trend (MA1 and BA1).
Pre- and post-therapy z-scores, along with variation scores for the comprehensive language assessments, are included in Table 4. These scores were compared to assess within- and across-level generalization. A sign test4 was conducted to determine if Fr-PCA significantly affected participants’ performance variance pre-therapy to post-therapy on standardized language tests. When examining within-level generalization with regard to a standardized test, Fr-PCA led to statistically significant improvements for object naming (TDQ-60) within our participants (p = 0.016). Participants BA2 and BA3 performed within the normal range pre-therapy, and participant MA1 was at ceiling performance pre-therapy on this test. All other participants showed severe impairment (<–2 SD) and improved significantly following Fr-PCA. Please refer to the Supplementary material for a detailed description of the sign-test results in Table 4.
TABLE 4
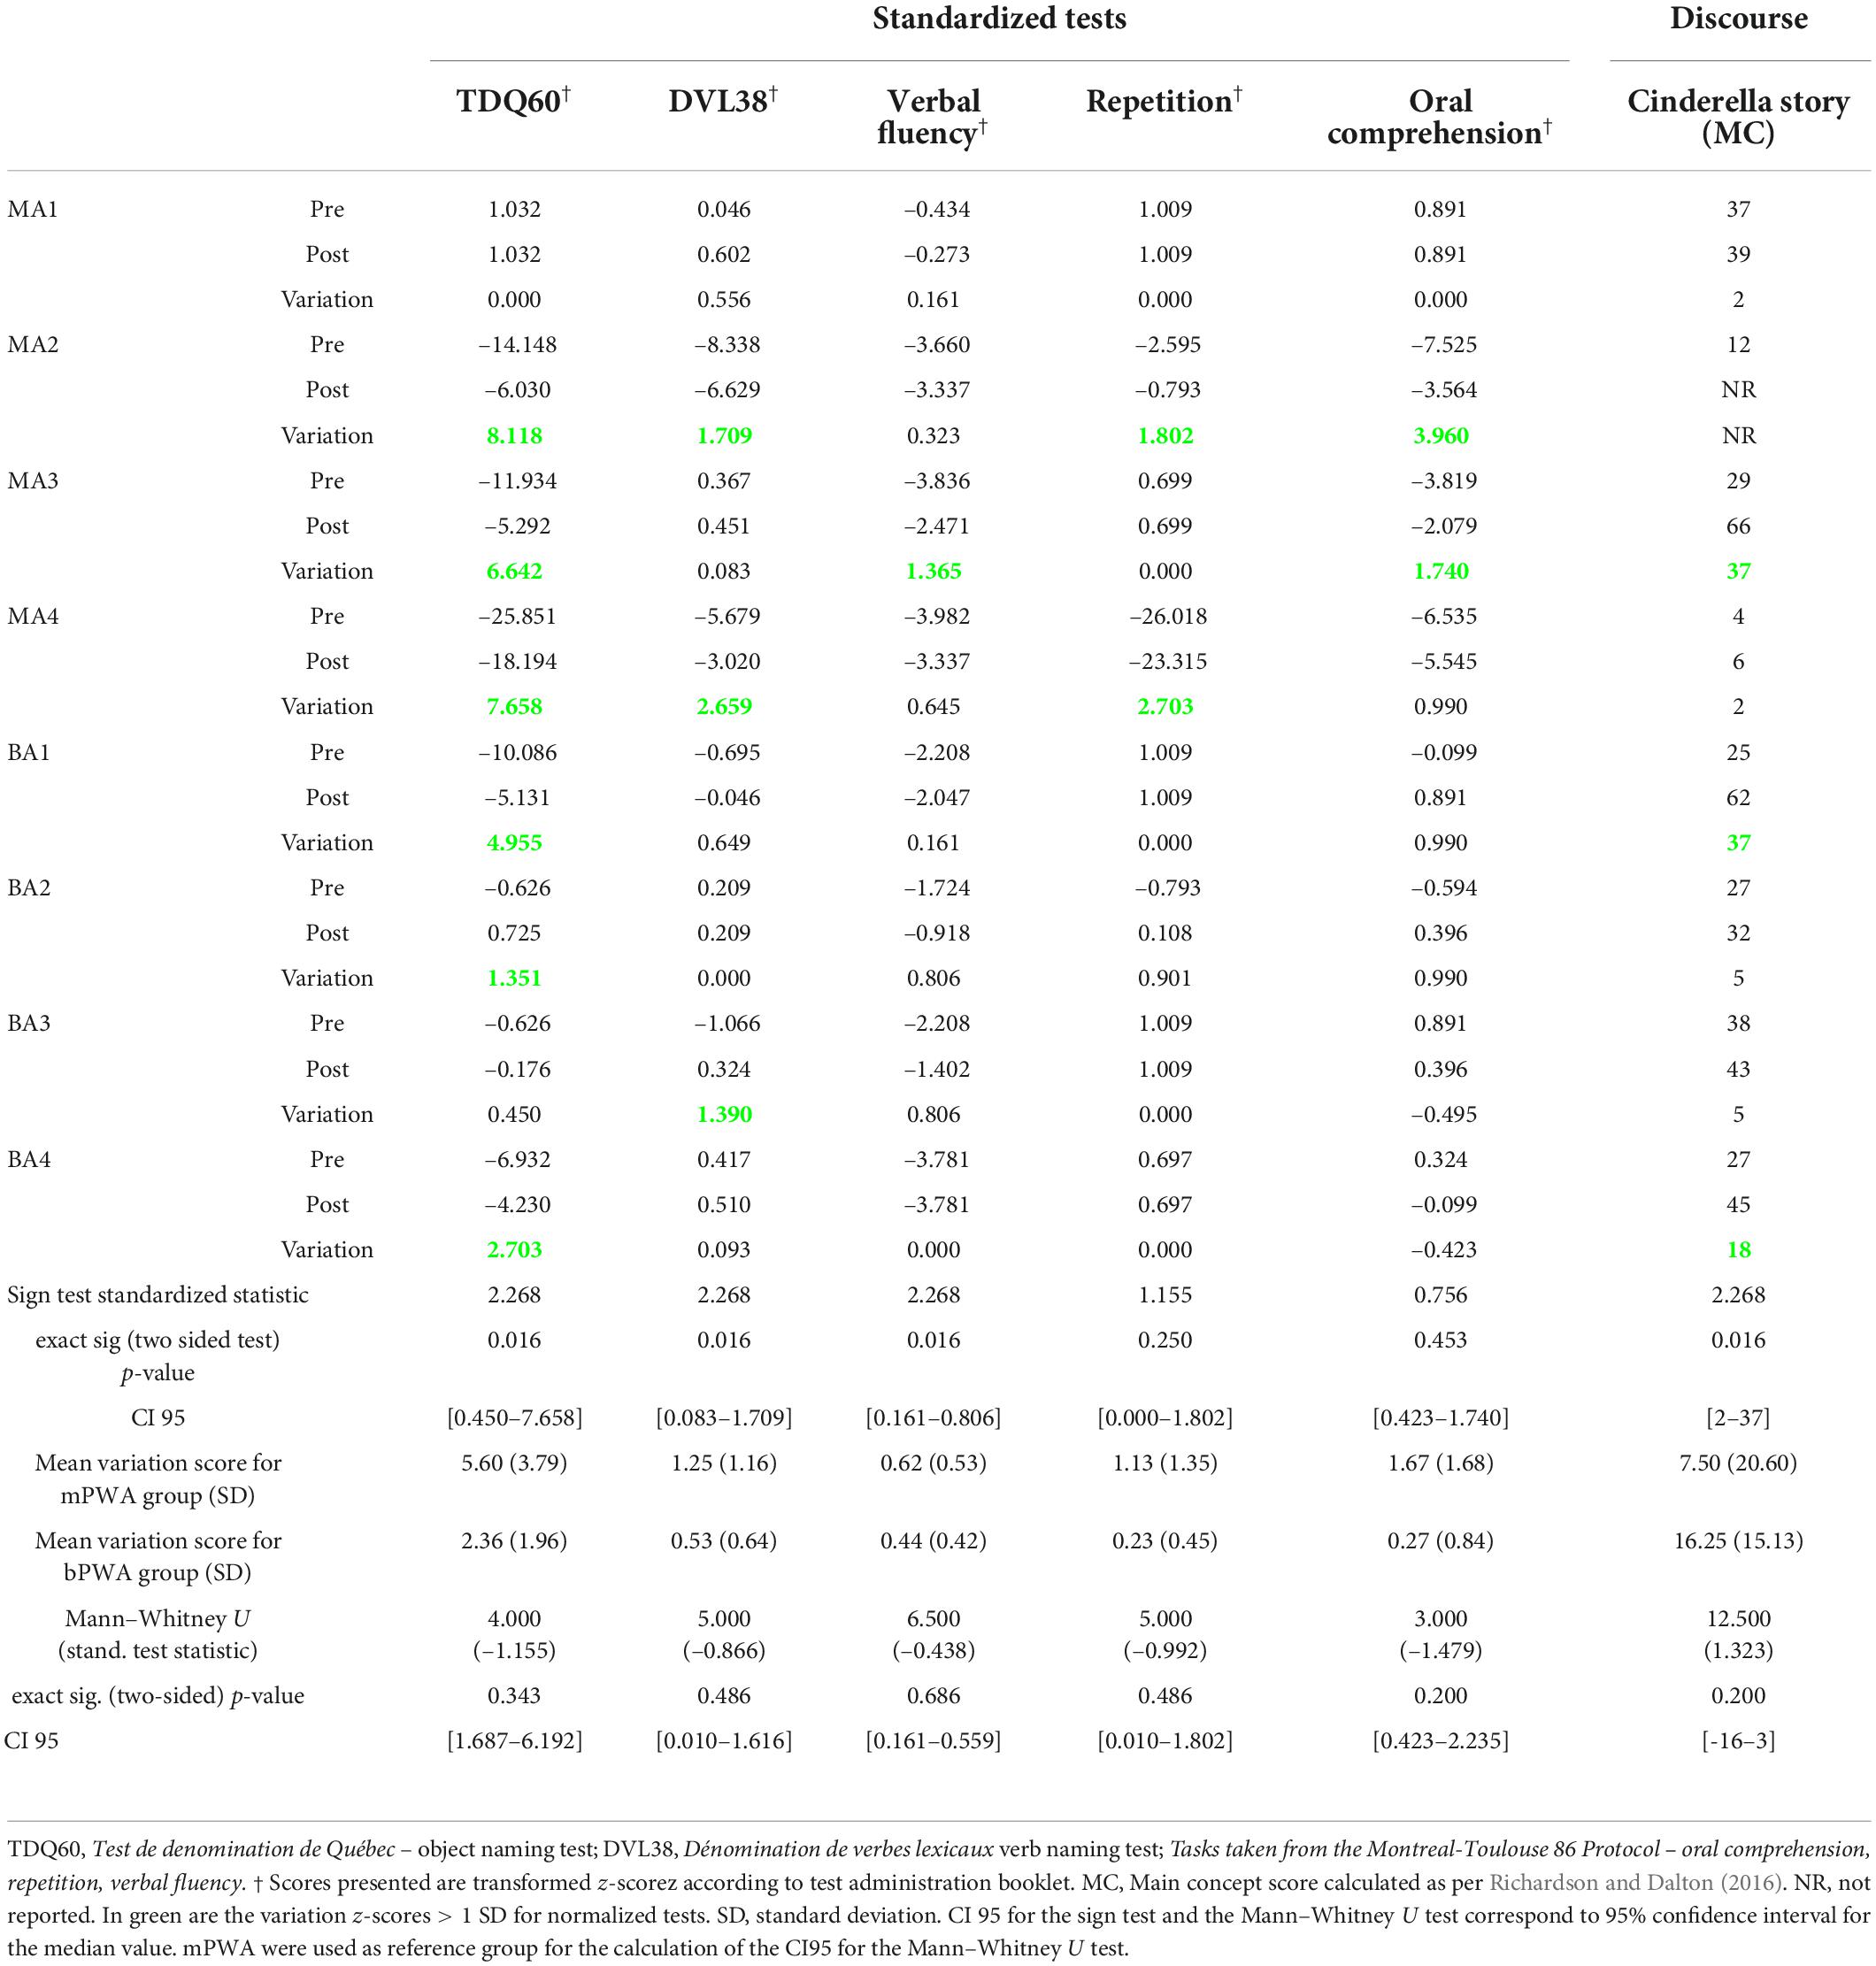
Table 4. Pre-therapy, post-therapy and variation of z-scores for all participants, exact sign test results testing the statistical difference between pre- and post-therapy for within-level generalization (TDQ60) and across-level generalization (DVL38, Verbal fluency, Repetition, oral comprehension, Cinderella story (MC)) and the Mann–Whitney U test results testing for statistical difference between groups’ variation scores.
Clinically, a variation greater than +1 SD generally indicates a significant improvement. Following Fr-PCA, on the TDQ60, MA1 showed no variation as he was already at ceiling pre-therapy, and BA3 showed only slight improvement (+0.450). All other participants showed significant variation scores (MA2, MA3, MA4, BA1, BA2, BA4).
A Mann–Whitney U test was conducted to see if there was a difference between mPWA and bPWA in variations from pre-therapy to post-therapy on the TDQ60 performance (see Table 4). There was no statistically significant difference in the z-score variation between monolinguals and bilinguals.
In sum, the converging results of effect size and WEST statistics for the untreated item and the improvement on the TDQ60 suggest variable within-level generalization. MA2 and MA3 show strong evidence of within-level generalization, BA3 and BA4 show moderate evidence, MA4, BA1, and BA2 show weak evidence, whereas MA1 shows no evidence.
Across-level generalizationWhen measuring across-level generalization with standardized tests, Fr-PCA led to statistically significant improvements for verb naming (DVL-38), verbal fluency task, and narrative discourse informativeness, showing across-level generalization in all participants with PWA, except for MA1, who was within normal range for all standardized test and did not improve significantly for the main concept score. These results are displayed in Table 4.
Looking closer at the DVL38 results, in this sample, two participants showed severe impairments (MA2 and MA4) pre-therapy and made clinically significant gains (respectively +1.707 and +2.659). BA3, who showed impairments that did not quite reach the mild impairment criteria (z-score = –1.066), also made clinically significant gains. All other participants performed within the normal range and did not show clinically significant variations. Considering the verbal fluency task performance, among the seven participants with severe impairment (MA2, MA3, MA4, BA1, BA2, BA3, BA4), only one participant (MA3) made clinically significant improvements. Post-therapy, two participants (BA2 and BA3) made sufficient gains to no longer meet the criteria for a severe impairment. Finally, when looking at the main concept scores for the Cinderella discourse, all participants that completed the task at both assessments improved, though a wide range of gains was found (CI95 [2–37]).
To compare group differences (mPWA vs. bPWA), a Mann-Whitney U test was conducted using variation scores from the standardized test (see Table 4). None of the variation scores on standardized tests showed a statistically significant difference between monolinguals and bilinguals.
TransferSix PWA completed the Flanker task before and after therapy (two mPWA and four bPWA). Pre-therapy and post-therapy Flanker task outcome measures are included in Table 5. An exact sign test was conducted due to the asymmetrical distribution of differences. The sign test was conducted to determine if Fr-PCA had induced a statistically significant change in participants’ performance from pre-therapy to post-therapy on the Flanker task. For our sample of PWA, no statistically significant change in any cognitive control outcome measure (Flanker effect, error rate, and RT for both conditions) was found.
TABLE 5
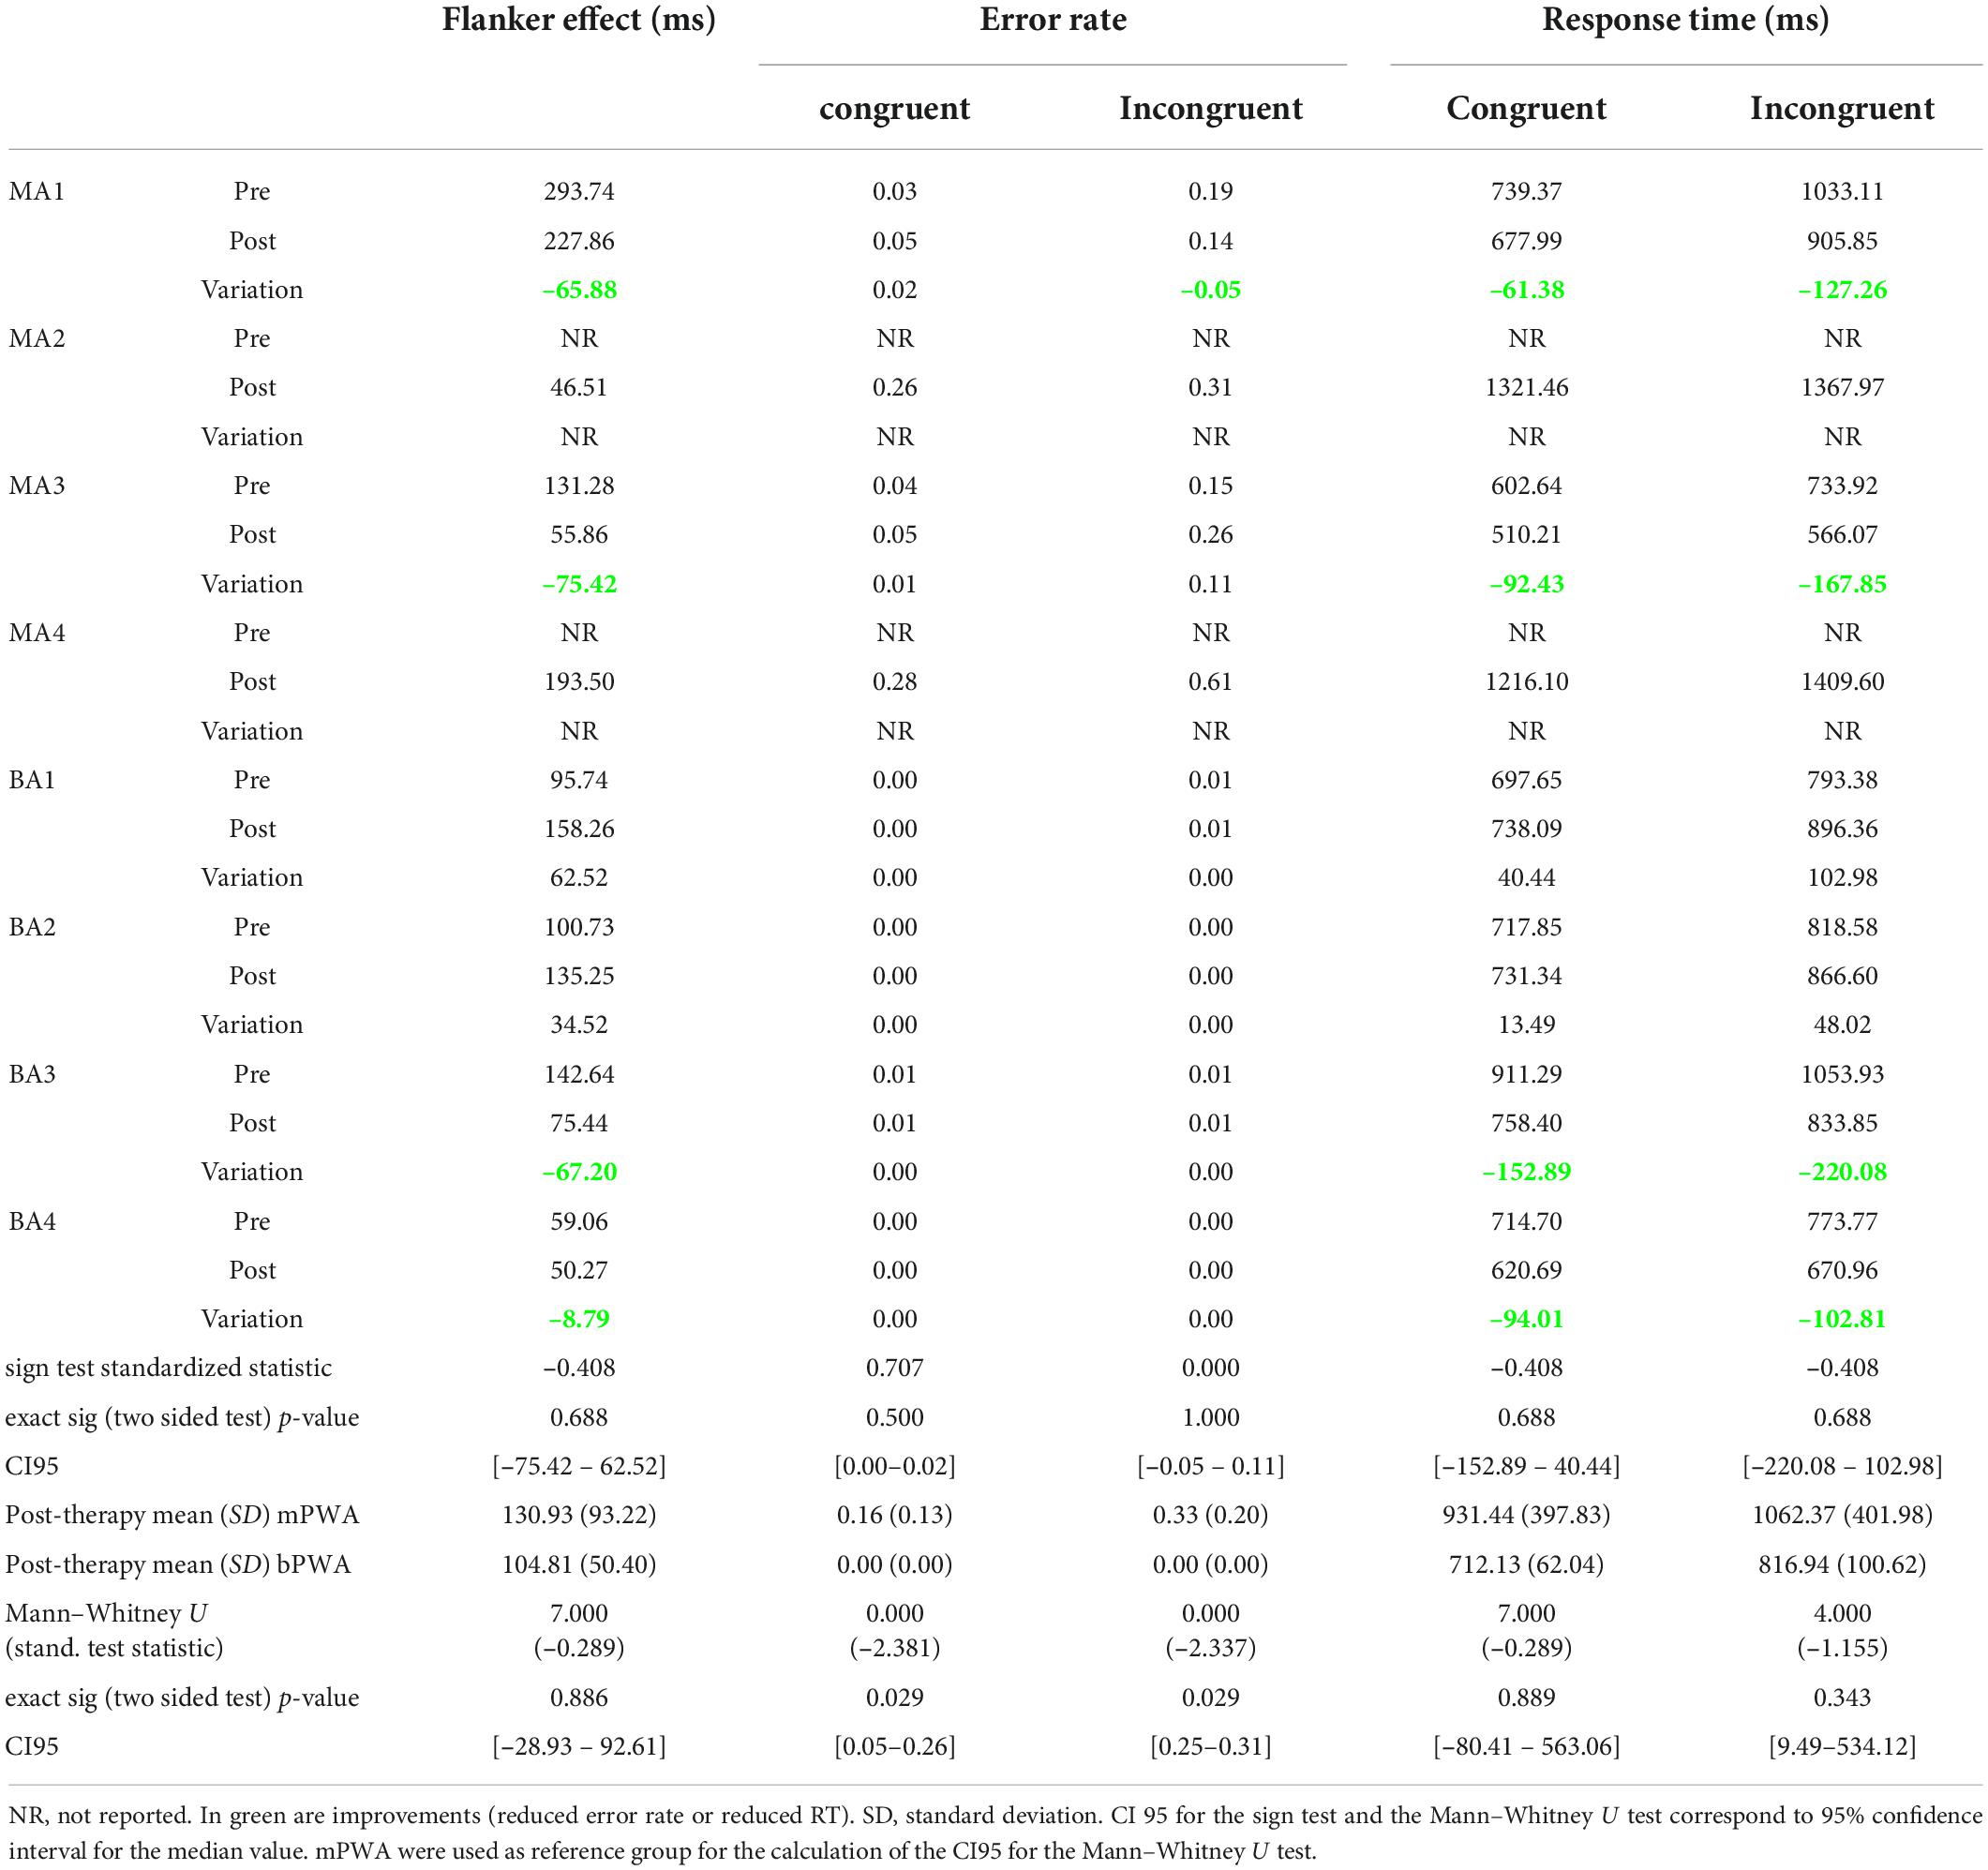
Table 5. Pre-therapy and post-therapy Flanker task outcome measure performances, exact sign test results testing the statistical difference between pre- and post-therapy, and Mann–Whitney U testing if groups significantly differ post-therapy.
Looking at the Flanker effect and raw response times for both conditions, 4 of the 6 participants who completed the task at both assessments (MA1, MA3, BA3, BA4) improved in terms of interference suppression and speed. BA1 and BA2 showed increased response times post-therapy for both conditions and an increased Flanker effect. In terms of error rates, MA1 showed an improvement for the incongruent condition (–0.05 in error rate), whereas MA3 showed an important increase (+0.11 in error rate) at the post-therapy assessment. BA1, BA2, BA3, and BA4 did not show any variation; all demonstrated between 0.00 and 0.01 error rates in both conditions. It is noteworthy that two monolingual participants who were unable to perform the task before therapy were able to perform the task after, an improvement that statistical analysis cannot capture.
A Mann–Whitney U test was performed to determine if there is any difference between mPWA and bPWA in the post-therapy Flanker task performance (Table 5). There was no statistically significant difference between groups for the Flanker effect and raw RTs in the congruent and incongruent conditions. There was, however, a statistically significant difference between groups for error rates. In the congruent and incongruent conditions, mPWA (mean rank = 6.5) had a statistically significantly higher error rate than bPWA (mean rank = 2.5) (respectively, U = 0.000, z = –2.381, p = 0.029, U = 0.000, z = –2.337, p = 0.029).
Looking closer at the data, MA4 showed a lower Flanker effect than all bPWA, and MA3 showed a lower Flanker effect than BA1, BA2, and BA3, whereas MA1 and MA4 showed more significant Flanker effects than all bPWA. Regarding response times, MA2 and MA4 responded the slowest (RT > 1200 ms in both conditions). MA3 showed the fastest response times in all conditions, and MA1 showed faster response times than BA1, BA2, and BA3 for the congruent condition (at the cost of making more errors). In the incongruent condition, bPWA were faster than MA1, MA2, and MA4. In terms of error rates, in both conditions, mPWA showed higher error rates than bPWA (CI95 = [0.05–0.26] for the congruent condition and CI95 = [0.25–0.31] for the incongruent condition). MA3 was thus the fastest participant but maintained a higher error rate than bPWA.
Impact of lesion locationA subset of ROIs damaged in at least two mPWA and two bPWA was identified to perform the statistical analysis. All participants have a single left hemisphere stroke; thus, the damaged ROIs are all in the left hemisphere. The Table in Supplementary Appendix B details the participants with damage to each ROI and the number of voxels damaged in each ROI per participant. The Mann–Whitney U test results are provided for all ROIs for which at least one participant per group shows damage. There was no significant difference between groups for lesion location and extent of damage (in voxel numbers).
留言 (0)