
記住我


Neurons in the inferotemporal cortex prefer basic shapes. They could selectively respond to certain objects and maintain this preference when the size and position of objects change (Tanaka, 2003; Cao et al., 2020). Some of the basic shapes are very similar to symbolic numbers, such as star, a figure-of-eight, and T junctions. Their combination could distinguish most shapes, such as Arabic numerals, letters, and words (Tsunoda et al., 2001; Tanaka, 2003). This ability is selected in the process of biological evolution and reflects the evolutionary history of the visual system (Mccandliss et al., 2003). Therefore, the brain may have the ability to distinguish symbolic numbers and non-symbolic numerosities without training.
Humans are not born to understand the meaning of symbolic numbers (Sella and Lucangeli, 2020). From a cognitive neuroscience perspective, the brain’s response to symbolic numbers should be expected to change over the course of learning and development as children go from initially perceiving symbolic numbers as meaningless shapes or sounds to having a rich representation of their meanings. This phenomenon is often referred to as “cultural brain plasticity” (Rathé et al., 2019, 2020). However, before the brain could understand the meaning of symbolic numbers, symbolic numbers must first be perceived and distinguished (Ansari, 2016). Studies on preschool children pointed out that children around the age of 2 years have not yet fully understood the meaning of symbolic numbers but only regard these numbers as a group of unexplained symbols (Suggate et al., 2018; Verschaffel et al., 2020). After 1–2 years of learning, children can deal with the meaning of symbolic numbers (Nisan and Kiziltepe, 2019; Bugden et al., 2021; Vogel and Smedt, 2021). At present, extensive studies have been conducted on how the trained brain represents symbolic numbers (Ferres-Forga and Halberda, 2020; Sokolowski et al., 2021a,b). However, how it distinguishes between different symbolic numbers before training remains to be studied.
Many models are dedicated to explaining the brain’s recognition of symbolic numbers (Shamim et al., 2018; Ali et al., 2019; Ahlawat et al., 2020; Chychkarov et al., 2021; Khanday and Dadvandipour, 2021; Mitani et al., 2021). Verguts and Fias (2004) believe that symbolic numbers and non-symbolic numerosities were converted into internal location codes through different paths, thus explaining the cause of the distance effect when comparing different symbolic numbers. The triple-coding model proposed by Dehaene and Cohen (1995) assumed that quantity processing may adopt three different representation systems and predicted a brain region specialized in processing symbolic numbers in the ventral visual stream. These two models explain the discriminant process of symbolic numbers from a biological point of view. However, researchers did not consider whether the model could have the asemantic processing abilities of symbolic numbers without training. In addition, many models were built by traditional artificial neural networks, such as convolutional neural networks, support vector machines, and k-nearest neighbor models (Grover and Toghi, 2018; Shamim et al., 2018; Hossain and Ali, 2019; Tahir and Pervaiz, 2020; Chychkarov et al., 2021; Khanday and Dadvandipour, 2021; Mitani et al., 2021). The experimental results of these models are difficult to explain from the perspective of biophysics. The structure of some models is complex, including multiple convolution layers and pooling layers; thus, explaining the symbolic number recognition process is difficult (Hossain and Ali, 2019; Ahlawat et al., 2020; Mitani et al., 2021). Therefore, using the spiking neural network model with biophysical significance is necessary to investigate whether and how the untrained model distinguishes symbolic numbers.
A spiking neural network based on biological interpretability was constructed in this work to explore whether untrained animals could distinguish different symbolic numbers and compare the difference between non-symbolic numerosity recognition and symbolic number recognition. This model and the previously constructed number sense model (Zhou et al., 2022) consist of a two-layer neural network and have lateral inhibition. The difference is that the model proposed in the present work belongs to the spiking neural network. The LIF neuron based on current was used as the neural network unit. In addition, lateral inhibition was achieved by negative connection weights. Therefore, the information processing process of the model has a strong biological basis. Under the condition of randomly setting the network connection weight without adjustment, the symbolic number dataset was inputted into the model to investigate the recognition abilities of the untrained model.
Materials and methods Stimulus datasetsA non-symbolic numerosity dataset mimicking the dataset of Nasr et al. (2019) was constructed to test whether the model could reproduce the non-symbolic numerosity recognition abilities that animals had prior to training. The dataset consisted of 150 images. The number of items in the image was between 1 and 5. Therefore, each non-symbolic numerosity was represented by 30 different images. Each image in the stimulus set contained 28×28 pixels, and the stimulus intensity of each pixel ranged from 0 to 1. Each item was a circle with an area of 25 pixels.
The symbolic number dataset MNIST was used to investigate whether and how untrained animals recognize symbolic numbers. Symbolic numbers 0–9 were inputted into the model, and the output response of the model was observed. MNIST and the non-symbolic numerosity dataset are shown in Figure 1A.
FIGURE 1
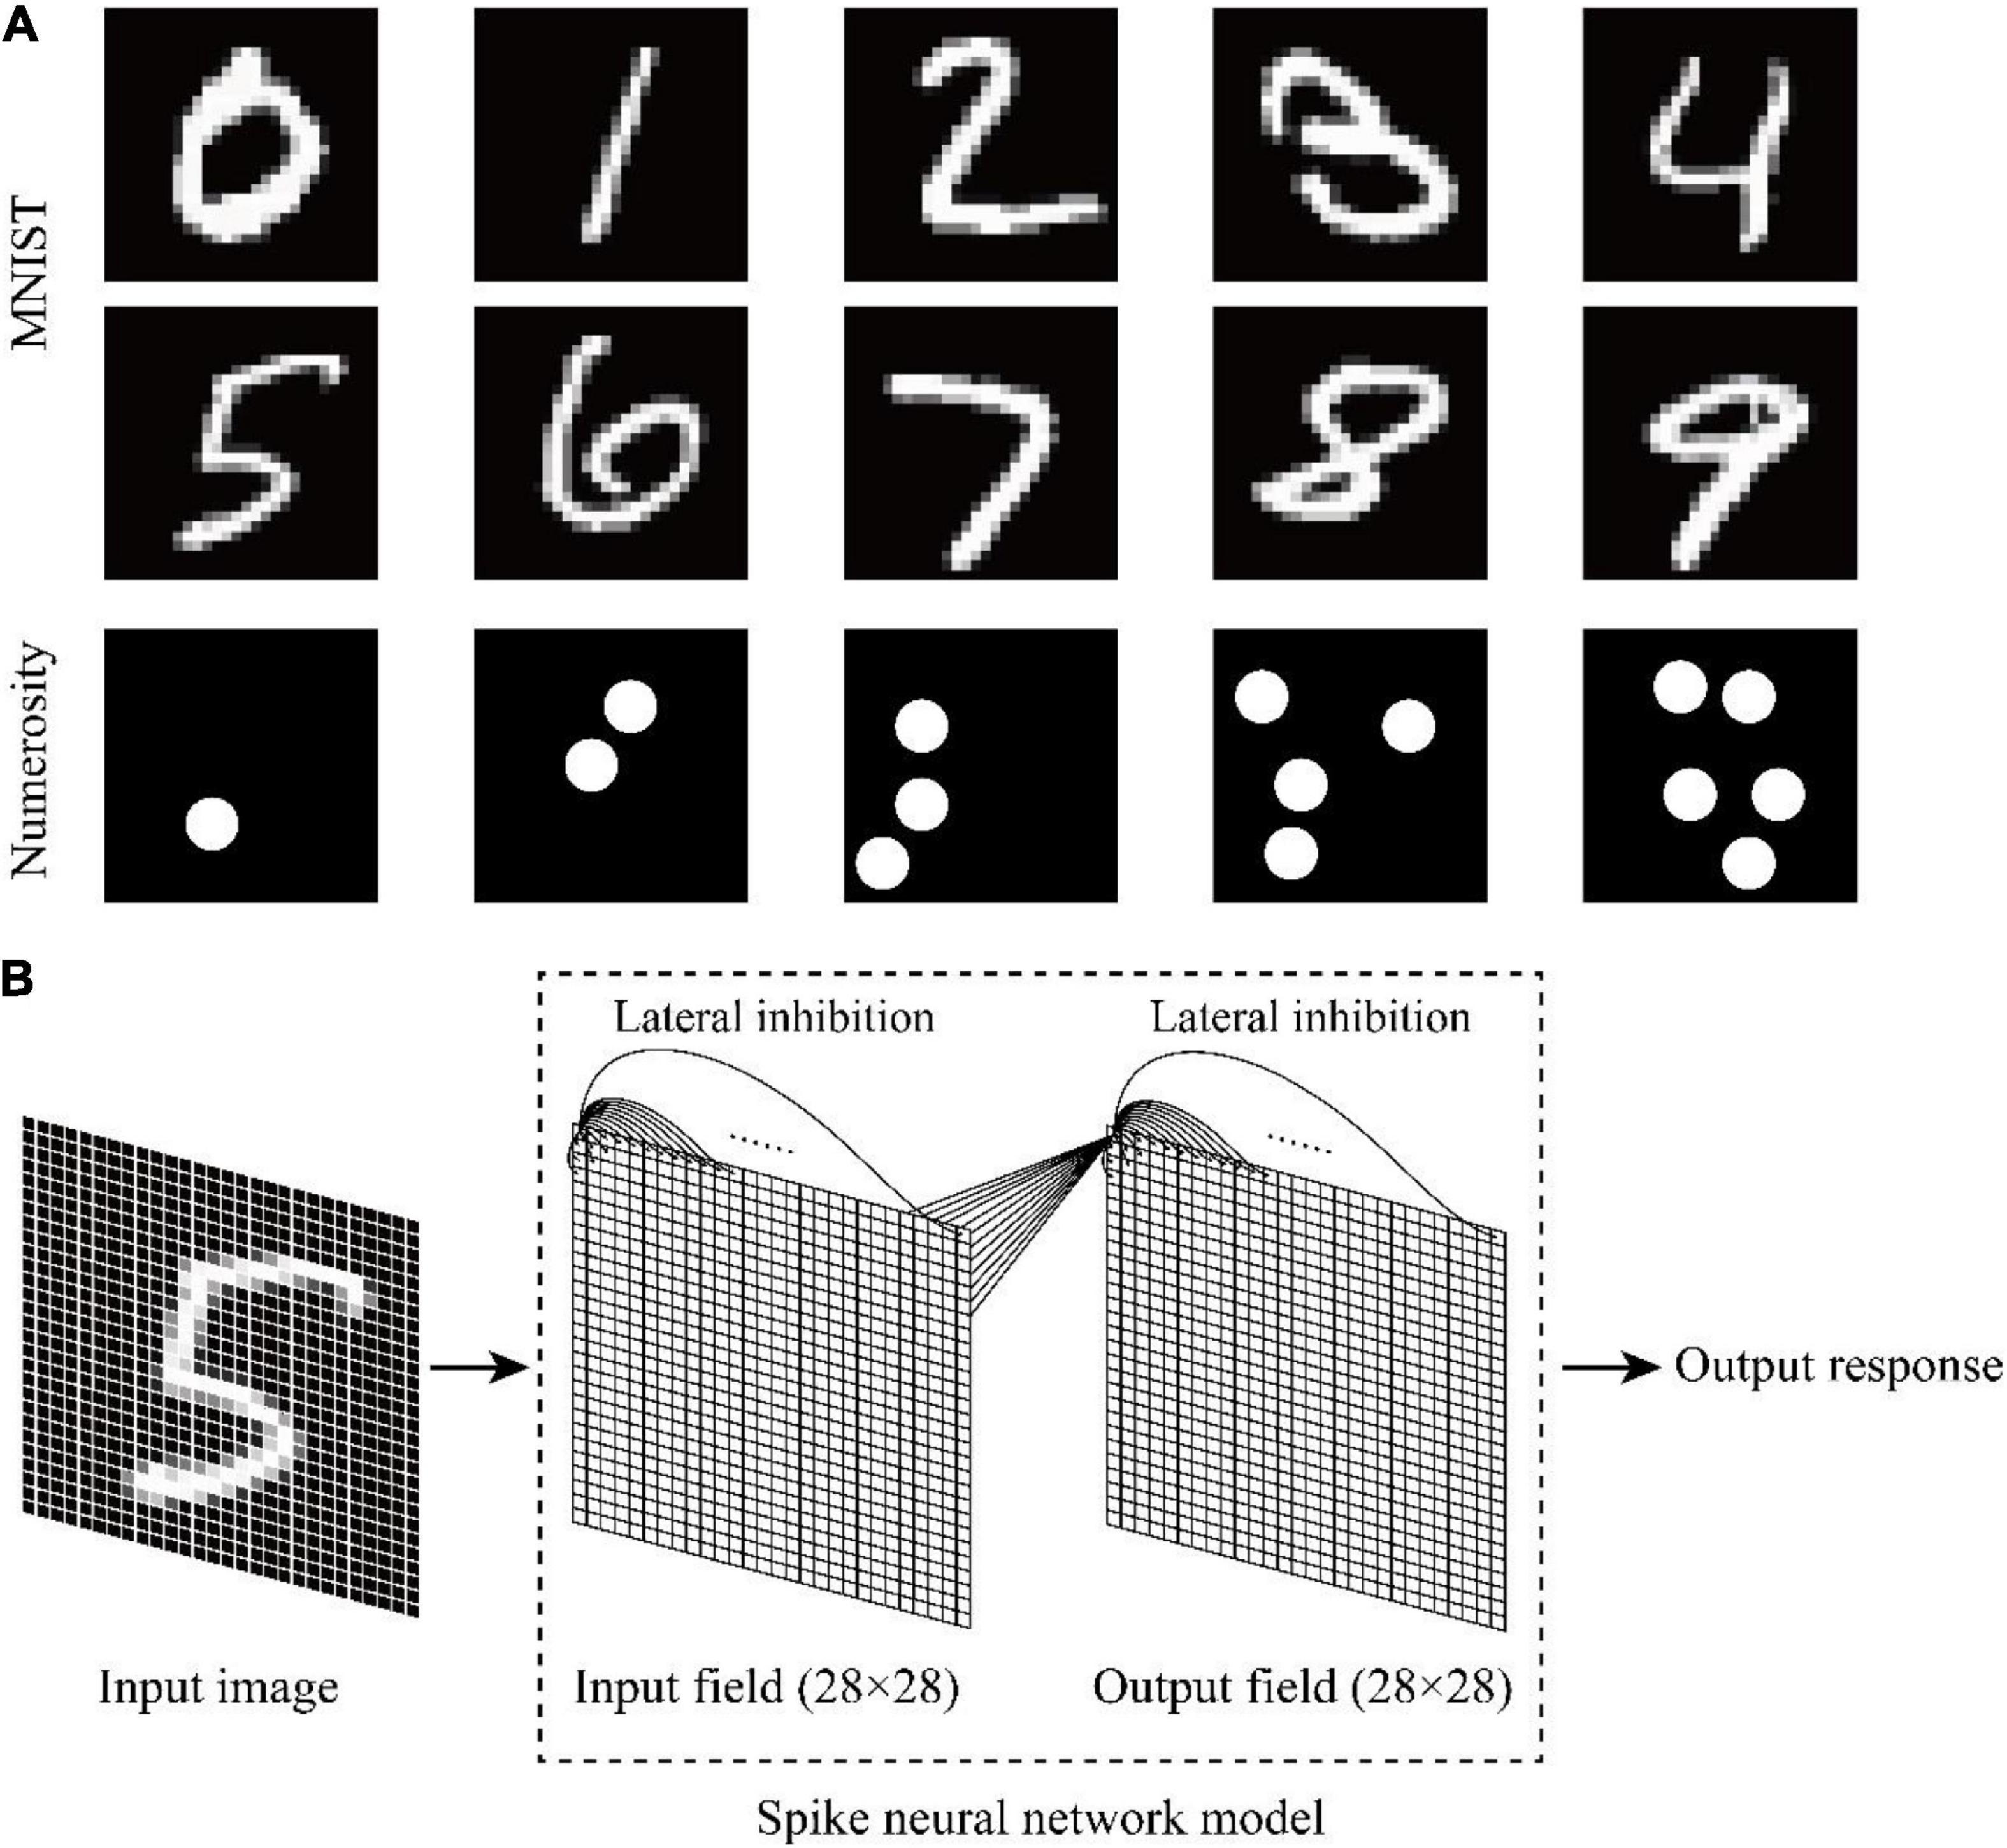
Figure 1. Schematic of the dataset and neural network structure. (A) Symbolic number dataset MNIST and non-symbolic numerosity dataset. (B) Two-layer spike neural network model with lateral inhibition.
Spike neural network modelThe programming language Python was used on the open-source machine learning platform Bindsnet to build a two-layer spike neural network model with lateral inhibition (Figure 1B). The input layer represented the visual pathway from the retina to the occipital lobe, and the output layer represented the visual pathway from the occipital lobe to the temporal lobe. The network size of the input layer and the output layer was 28×28. Each unit consisted of a current-based LIF neuron. The default parameters of current-based LIF neuron are shown in Table 1. Each neuron of the input layer corresponded to one pixel of the input image. The units located in different layers were fully connected, and initial weights followed the Gaussian distribution of μ=0.5 and σ2=0.1. Each time a new image was inputted, the connection weights between different layers were randomly generated without adjustment. Lateral inhibition was added to the model because it presented in primary visual cortex (Lu and Zuo, 2017) and neocortex (Zhou and Yu, 2018) associated with visual processing. The neurons in the same layer are connected with each other, and the weight is negative. The weight is also related to the distance between neurons. When the Euclidean distance between neurons increases, the weight decreases, and the mutual inhibition ability between neurons decreases.
TABLE 1
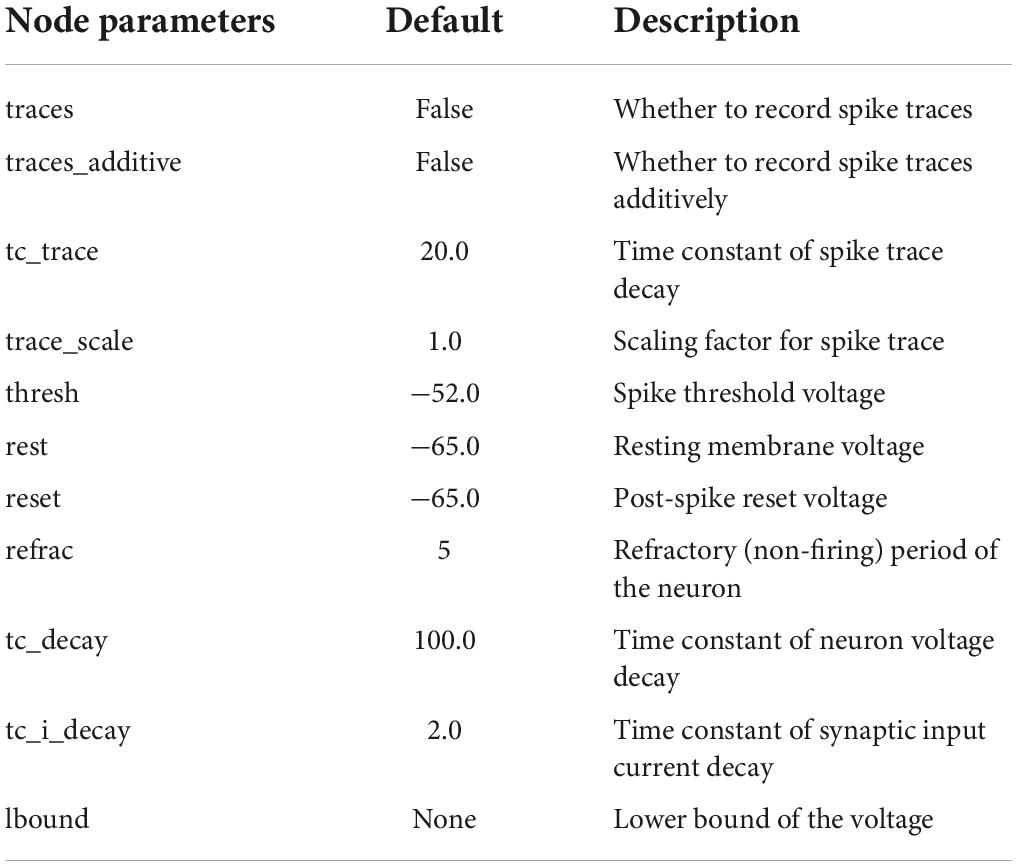
Table 1. Default parameters of current-based LIF neuron.
The weight between neurons in the same layer is expressed as follows:
wxy=-e-Rxy2×α2(1)
where wxy is the weight between neuron x and neuron y in the same layer of neural network, Rxy is the Euclidean distance between two neurons, and α is the standard deviation of the Gaussian function. An increase in α indicates that the range of lateral inhibition of neurons increases. Although each layer of the model only performs lateral inhibition once, it reflects the result of multiple lateral inhibitions at different levels of the visual pathway. Comparison of the simulation results and experimental data (Kutter et al., 2018) revealed that the fitting degree between the simulation results and experimental data was high when the standard deviation of the input layer was αinput = 10 and that of the output layer was αoutput = 20.
The stimulation duration of each image in the dataset was 2 s. Each pixel of image generates a certain frequency impulse sequence in accordance with pixel value to stimulate input layer neuron. The probability of impulse generation per millisecond follows the Bernoulli distribution.
f(x|p)=,,,]},,,]},,,]},,,,,]}],"socialLinks":[,"type":"Link","color":"Grey","icon":"Facebook","size":"Medium","hiddenText":true},,"type":"Link","color":"Grey","icon":"Twitter","size":"Medium","hiddenText":true},,"type":"Link","color":"Grey","icon":"LinkedIn","size":"Medium","hiddenText":true},,"type":"Link","color":"Grey","icon":"Instagram","size":"Medium","hiddenText":true}],"copyright":"Frontiers Media S.A. All rights reserved","termsAndConditionsUrl":"https://www.frontiersin.org/legal/terms-and-conditions","privacyPolicyUrl":"https://www.frontiersin.org/legal/privacy-policy"}'>
留言 (0)