
記住我

Muscle mass and function decline rapidly in sarcopenic subjects [1, 2]. Sarcopenia affects the elderly, but not solely [3]. In immune-mediated rheumatic diseases (IMRDs) such as rheumatoid arthritis (RA), psoriatic arthritis (PsA), ankylosing spondylitis (AS), systemic lupus erythematosus (SLE), systemic sclerosis (SSc), vasculitides, and in aging disorders, sarcopenia has recently been added to the International Classification of Diseases (ICD-10) as a comorbidity [4]. As a result of mobility problems, sarcopenia can lead to decreased quality of life, loss of independence or the need for long-term care [5,6,7,8,9,10,11,12]. It has a higher mortality rate (pooled odds ratio of 3.6) than the general population, according to a recent study [13]. Sarcopenia also has a financial cost [14], increasing the risk of hospitalization and the expense of care [15]. Sarcopenic individuals are five times more likely than non-sarcopenic patients to have higher hospital charges [16]. In 2000, the projected direct health care cost of sarcopenia in the USA was $18.5 billion ($10.8 billion for males, $7.7 billion for women), accounting for around 1.5% of overall health care spending. According to a sensitivity study, the expenses might range from $11.8 billion to $26.2 billion. Each sarcopenic male spent $860 on health care and each sarcopenic woman spent $933 on health care. A 10% decrease in sarcopenia prevalence would result in annual health care cost savings of $1.1 billion (dollars adjusted to 2000 rate) in the USA [17].
Epidemiology of sarcopenia in older community-dwelling and IMRDsSarcopenia vastly outnumber frailty in the general population. After age 50, muscle mass diminishes by 1–2% per year. Muscle strength falls by 1.5% between 50 and 60, and by 3% thereafter [18]. Sarcopenia prevalence varies depending on the population examined and the classification criteria utilized [19, 20], regarding 5–13% of adults aged 60–70. The ratio rises to 11–50% for those above 80 [18]. Sarcopenia affects around 50 million people globally and is anticipated to reach 200 million in the next 40 years [21]. According to the European Working Group on Sarcopenia in Older People (EWGSOP2) definition and standards [3, 23], sarcopenia affects 4.6% of male group housing residents aged 68–76 in the UK [22]. In a cross-sectional observational research of 730 elderly people, those with chronic conditions (endocrine disorders, cancers, heart failure, cognitive impairment, Parkinson's disease, renal failure, peripheral artery disease, and hip fracture) had greater rates of sarcopenia [24].
IMRDs might represent risk factors for sarcopenia [25]. Pro-inflammatory cytokines including interleukin-6 and tumor necrosis factor (TNF) promote systemic inflammation, which leads to sarcopenia [26]. Sarcopenia (about 20%) and pre-sarcopenia were studied in Italian RA, PsA, and AS patients. Although sarcopenia was seen in all three disorders, pre-sarcopenia was shown to be more common in PsA and AS (25.7%) than in RA [27]. Sarcopenia is more common in Asian RA patients (37.1%) [28], and in North African AS patients (34.3%) [29]. Other cross-sectional studies indicated that RA patients had considerably more sarcopenia than controls [30,31,32,33,34,35]. Sarcopenia was found in RA patients in these studies in a range of 10–45%, with a median of 29%. A recent comprehensive literature review and meta-regression analysis of 3.140 RA patients revealed 31% sarcopenia [36].
Patients with AS had pre-sarcopenia, sarcopenia (as defined by the EWGSOP), and cachexia [29]. Higher disease activity (BASDAI) and lower bone mineral density (BMD) were associated with sarcopenia and cachexia. A cross-sectional study indicated that 20% of people with spondyloarthritis had sarcopenia. This research comprised 22 AS patients and 70 PsA patients from 40 to 75 years old. Sarcopenia was found in 22.7% of AS and 20.0% of PsA patients utilizing the skeletal muscle mass index (SMI) and handgrip force [27]. According to the EWGSOP, 34.3% of Moroccan AS patients and 62% of Portuguese AS patients had sarcopenia. SMI correlated negatively with BASDAI and Bath Ankylosing Spondylitis Function Index (BASFI) [37]. The frequency of sarcopenia in postmenopausal female PsA patients utilizing the SMI is 40–50% [38, 39].
Sarcopenia is seen in 17.4% of SLE patients [31]. Three studies looked at SSc sarcopenia prevalence. The prevalence of sarcopenia was 20.7% using the SMI [40], and 22.5% using the EWGSOP criteria [41]. Another study revealed prevalence rates of 41.9 and 54.8% using SMI and handgrip strength criteria [42].
Definition and diagnosis of sarcopeniaSarcopenia has several definitions [3,4,5, 21, 43, 44], but no consensus has been reached. Sarcopenia is “a condition of progressive and generalized loss of skeletal muscle mass and strength with a risk of adverse consequences such as physical weakness, poor quality of life, and death” according to the EWGSOP [21]. Low muscle mass alone indicates pre-sarcopenia, loss of muscular strength or performance suggests sarcopenia, and the combination of all three characteristics indicates extreme sarcopenia (Table 1).
Table 1 EWGSOP operational definition of sarcopenia (adapted from [21])The Working Group reconvened in 2018 (EWGSOP2) to modify the initial criteria to incorporate ten years of scientific and clinical research. The amended EWGSOP recommends measuring muscle mass, strength, and quality [3]. In particular, EWGSOP2 recognized poor physical performance as an indication of severe sarcopenia and utilized low muscle quantity and quality to corroborate the diagnosis. EWGSOP2 also modified the clinical methodology for sarcopenia identification, diagnosis, and severity assessment. The updated EWGSOP2 guidelines seek to educate the public about sarcopenia and its consequences. This change was made to align the algorithm with the 2018 sarcopenia concept and make it easier to use in clinical settings. Figure 1 shows a modified version of the EWGSOP2 flowchart, and it could be proposed for the identification of sarcopenia in patients with IMRDs.
Fig. 1
Sarcopenia assessment flowchart for case-finding, making a diagnosis and quantifying severity in practice (adapted from [3]). Abbreviations: SARC-CalF = Strength, Assistance with walking, Rise from a chair, Climb stairs, Fall and Calf Circumference; SPPB = Short Physical Performance Battery; US = Ultrasound; MRI = Magnetic Resonance Imaging
The Strength, Assistance with walking, Rise from a chair, Climb stairs and Falls (SARC-F) questionnaire is recommended by EWGSOP2 for sarcopenia patients to self-report. SARC-F looks to be appropriate for community health care. The SARC-F is a 5-item questionnaire used to determine sarcopenia risk [45]. They rate their strength, walking abilities, standing up from a chair and stair climbing, as well as falls. In clinical groups with sarcopenia suspicion, clinicians may use a more systematic case-finding instrument, such as the Strength, Assistance with walking, Rise from a chair, Climb stairs, Fall and Calf Circumference (SARC-CalF), which incorporates calf circumference (CC) [46, 47]. Low handgrip strength (HGs) is currently the most reliable indicator of muscular function in EWGSOP2’s 2018 definition. Sarcopenia is characterized by HGs loss [48,49,50]. HGs have been linked to disease activity, joint injury, disability, and functional impairments in IRMDs and fibromyalgia [51, 52]. HGs may assess a patient’s ability to return to work, measure progress, and compare the efficacy of different treatment options [53]. Moreover, the French Very Early Rheumatoid Arthritis study indicated that decreasing HGs is linked to a higher economic burden in individuals with RA [54].
To increase the sensitivity and specificity of current diagnostic criteria, studies should be conducted using standardized and reliable imaging methods [55]. Muscle mass analysis and measuring methodologies may provide a variety of results. Depending on the system used, total lean mass (body weight minus body fat), appendicular lean muscle mass (aLM), or both can be measured using bioelectrical impedance analysis (BIA), computed tomography (CT), ultrasound (US), magnetic resonance imaging (MRI), and dual-energy X-ray absorptiometry (DXA) [21, 55,56,57]. In terms of reliability, radiation exposure, amount of time to complete the examination and analyze the data, availability and complexity of the equipment required, costs, and applications, these approaches vary significantly.
The EWGSOP2 recommends the use of DXA as a tool to diagnose sarcopenia in clinical practice. Although DXA has same advantages, such as the relatively low radiation exposure and it is more cheater compared to CT scan, it has several limitations. DXA has proven to have low accuracy in the presence of edema and altered hydration status, in estimating truncal fat and muscle due to the inability to separate intra-abdominal organs and in evaluating the extent of sarcopenia or the presence of obesity from the amount of fat and muscle extrapolated from arms and legs.
Imaging methods for the diagnosis of sarcopeniaIn a community-based vulnerable older adult population, sarcopenia seems to be best diagnosed with US and MRI (Table 2) [55,56,57,58,59]. The mobility and absence of ionizing radiation exposure of US separates it from other techniques. MRI is often used to quantify skeletal muscle efficiency, especially intramyocellular lipid. Both approaches can assess muscle thickness, intramuscular fat infiltration, and other biochemical indices of muscle quality since muscle and fat are clearly distinguished [56, 58]. Variations in echo intensity (EI) are associated with increased intramuscular fiber and fat tissue [59,60,61,62,63,64]. Researchers who employed computer-aided gray scale analysis to determine muscle quality say the EI increases intramuscular adipose and fibrous tissue. In recent years, pixel/voxel threshold distinctions between muscle and other tissues have been established semiautomatically [60,61,62,63,64]. In addition to frailty, quantitative MRI data may identify variations in muscle function across age groups [65,66,67,68,69]. Using automated subcutaneous fat and muscle segmentation, multiparametric MRI has recently shown promise in measuring subcutaneous adipose tissue (SAT) and intermuscular adipose tissue (IMAT) [70]. The latter approach cannot reliably measure intramyocellular lipids [71]. These two methodologies demonstrate how sarcopenia imaging has evolved from basic anatomical or structural measurement to a new level that permits functional dissection of muscle tissue.
Table 2 Advantages and limitations of the two different modalities (MRI and US), used in estimation of skeletal muscle mass (adapted from [55])The role of ultrasound as a diagnostic tool for sarcopeniaThis narrative review discusses several studies that have explored the value of US in identifying non-myositis-related muscle involvement in patients with IMRDs, assessing the potential and limits of US in screening and diagnosing sarcopenia in individuals with these disorders.
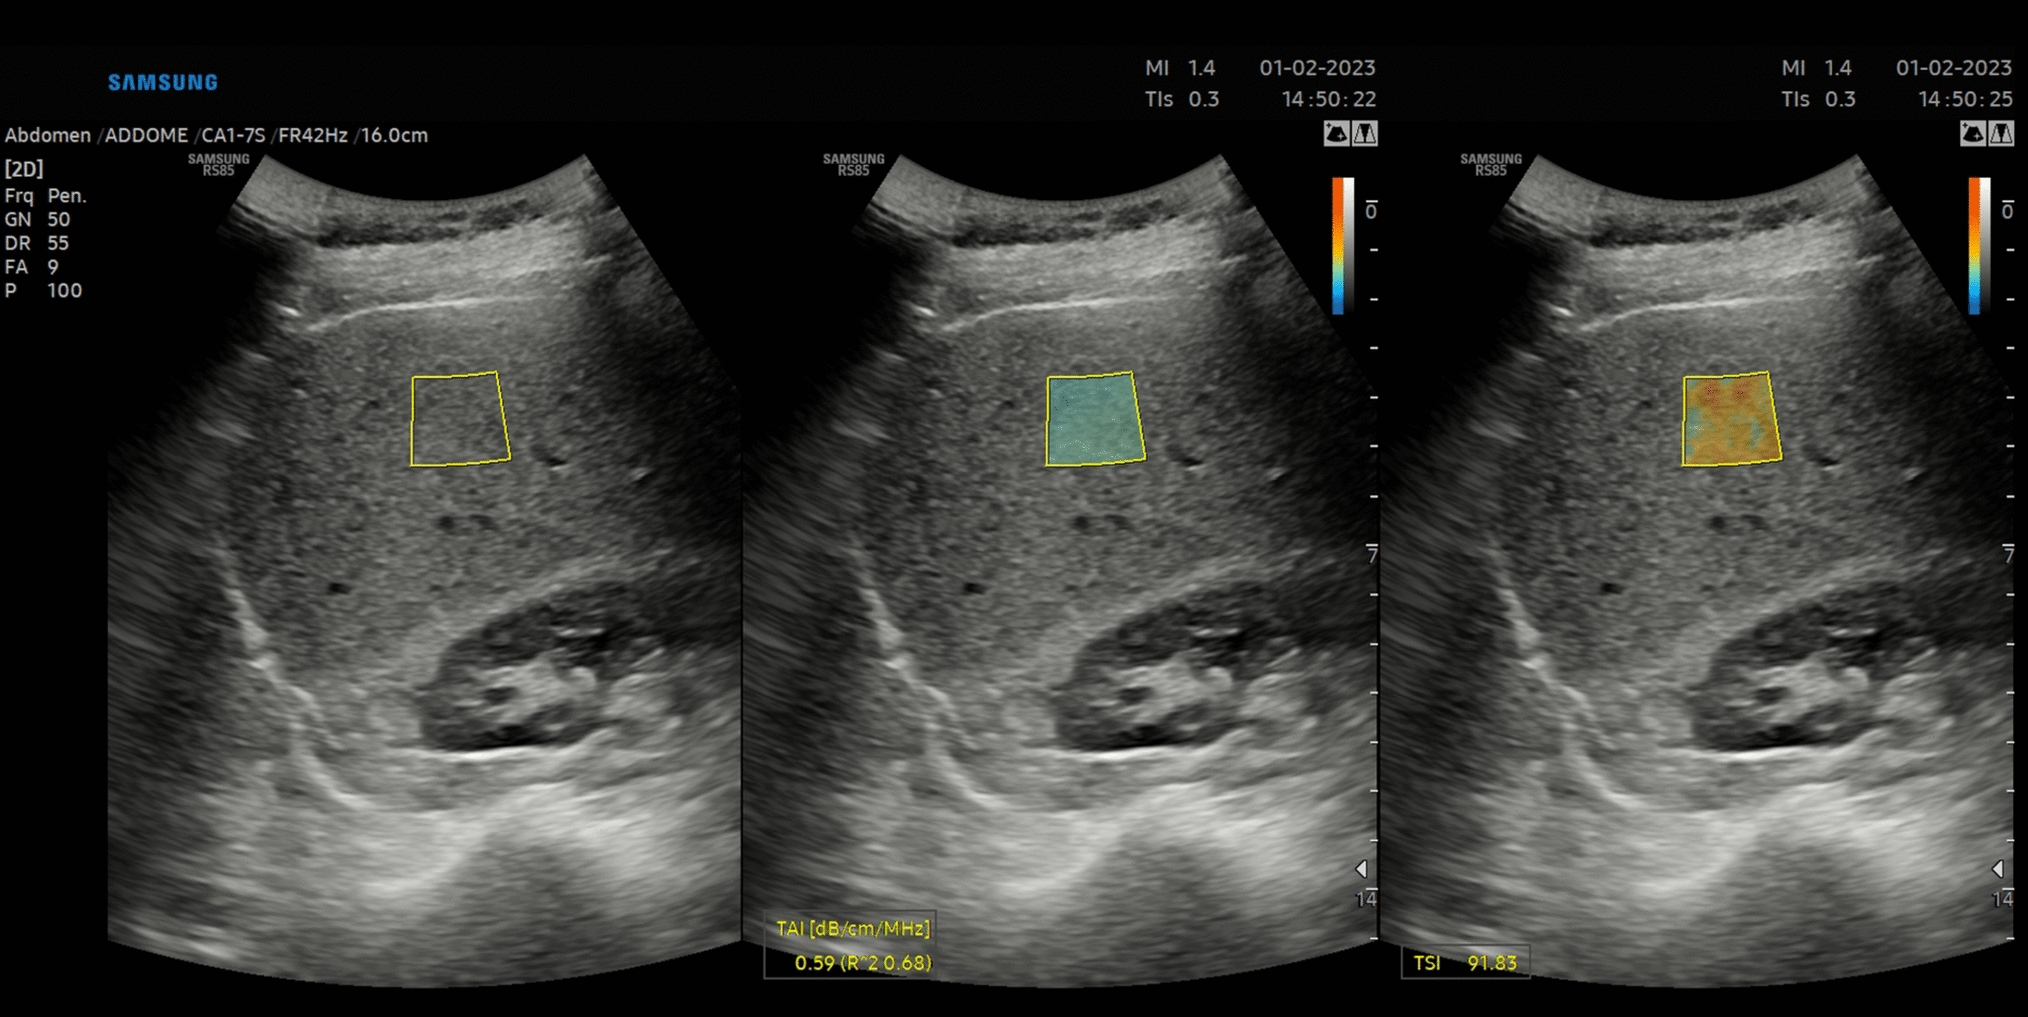
The potential usefulness of US in the diagnostic work-up of sarcopenia mainly relies on the capacity of this imaging technology to examine numerous aspects of muscle changes. US has proven the potential to detect qualitative (i.e., muscle echogenicity indicative of muscle fibrosis or fatty replacement), and biomechanical muscle changes (i.e., pennation angle and fascicle length) in patients with (or ‘at-risk’ of) sarcopenia, mainly elderly patients and patients with neuromuscular disorders, but also patients with IMRDs [72,73,74]. Several approaches have been developed to measure US muscle echogenicity [75]. The most widely chosen is the visual approach, which is a subjective and intuitive appraisal of muscle echogenicity in relation to the surrounding tissues, such as the subcutaneous tissue. One of most is represented by the Heckmatt score, a 4-grade semiquantitative measure which was created in pediatric patients with neuromuscular illnesses in 1982 [76]. Quantitative metrics of echogenicity on US images, such as histographic analysis, may also be utilized. This sort of technique is based on software that estimates the number of pixels on grayscale images (Fig. 2). Shear-wave elastography (SWE) is a relatively recent US technique that analyzes muscle physiological parameters by giving a quantitative measure of muscle elasticity [77, 78].
Fig. 2
Muscle echogenicity in grayscale and histographic analysis in a healthy subject (a) compared to a patient with systemic sclerosis (b). An ultrasound transverse scan image of the rectus femoris (rf) and vastus intermedius (vi) showing increased muscle echogenicity in the patient with systemic sclerosis in comparison with the healthy subject (i.e., grade III of the Heckmatt scale, marked increased muscle echo with reduced bone echo vs grade I of the Heckmatt scale, normal hypoechoic muscle) [76]. The small squares and lines indicate the region of interest for grayscale image analysis with histograms
The majority of the studies on US were carried out in patients with RA [79,80,81,82,83,84,85], while only a very few have investigated US muscle involvement in patients with connective tissue diseases [86, 87].
In a study by Matschke and colleagues, 14 cachectic RA patients (defined as reduced appendicular lean mass by whole-body dual-energy X-ray absorptiometry) were evaluated for US parameters (vastus lateralis fascicle length, pennation angle, and cross-sectional area [CSA]). Physical functions (i.e., sit-to-stand, foot-up-and-go, 50-foot walk, and single-leg balance) were impaired in RA patients compared to healthy controls. The muscle-specific force and activation capacity of the two groups did not vary significantly. It is possible that cachectic RA patients with poor physical performance, reduced muscle mass, and US muscle abnormalities nonetheless have these physiological features. Sadly, the authors did not study (or publish) the link between US results, physical function, and muscular mass.
Another research compared 35 RA patients with 35 age- and sex-matched healthy controls, in terms of athletic performance, US vastus lateralis muscle strength, and fascicle length. Less muscle thickness (23.3%) and pennation angle (14.1%) were seen in RA patients as compared to healthy controls in the vastus lateralis muscle, but no variations were found in fascicle length between the two groups. Less physical function (TUG test) and knee-extensor muscle strength were found in RA patients compared to healthy controls. Neither the US findings nor the clinical characteristics of RA patients (HAQ, DAS-28 joints, glucocorticoid treatment, disease duration, and VAS pain) were associated with each other.
Similarly, another research looked at the relationship between quadriceps muscle US morphology (muscle thickness and pennation angle) and clinical characteristics, muscular strength (grip strength test) and physical function (HAQ, TUG test) in 55 women with RA [
留言 (0)