
記住我


Road transport crashes are a leading cause of injury and deaths worldwide.1 In Australia, 1195 people died and 39 330 were hospitalised due to road transport crashes in 2019.2 Young drivers aged 17–25 years are disproportionally affected, attributing 25% of crashes resulting in serious injury even though they only make up around 15% of the Australian population of driving age.3
Reducing road transport crashes is an international policy priority4–7 and Australia, like many other countries, has adopted a safe systems approach comprising of four target areas: safe roads, safe speeds, safe vehicles and safe road users.4 5 Law enforcement and penalties combined with social marketing and education campaigns are key components to improve road user safety. Penalty systems are based on deterrence theory that assumes that crime is deterred by the threat of punishment.8 Studies on the effectiveness of penalty systems to increase road safety show that they can be successful in reducing dangerous driving behaviours, such as drink driving9 10 and associated road transport crashes.11–14 However, individual-level studies show that drivers who incur offences are also at increased risk of car crash.15–23 It has therefore been suggested that driving offences are an indicator of risky driving behaviours15 16 that, in turn, are associated with an increased risk of crash.24–26
Previous studies reported crash and traffic offence rates in novice drivers,27–29 but few studies have specifically looked at driving offences and subsequent risk of crash in young novice drivers. A cohort study of young drivers from Queensland, Australia, reported 31% and 41% higher rate of crash resulting in injury or deaths for drivers with at least one drink driving or speeding offence, respectively, compared with drivers with no such offence.20 This is in line with findings from a study from Western Australia, which found that both infringements and convictions were predictive of first year drivers’ involvement in a subsequent crash and that infringements alone were predictive of first year drivers’ involvement in a subsequent serious injury crash.21 Similarly, another study from Western Australia showed an increased risk of drink driving related crashes in novice drivers who had a previous drink driving offence that resulted in a road crash22 and a study of young drivers from Michigan in the USA reported drivers with an offence in the previous year to have a 40% increased risk of crash compared with drivers with no offences.23 Similar findings have been reported in cohort studies of drivers of all ages. A study from Queensland, Australia, showed that drivers had up to three times higher risk of crash in the month following an infringement, relative to a comparable driving period 12 months prior.17 The authors concluded that penalties might indicate periods of risky driving and might not have an immediate effect on reducing dangerous driving behaviours and the risk of crash.17 Similarly, cohort studies from Israel and Australia found that drivers with previous traffic offences were at increased risk of crash.15 16 However, these previous studies either did not consider confounders in the analysis20 21 or were limited in the amount of confounders considered.
The young driver cohort (DRIVE) study is a large prospective cohort study of more than 20 000 young drivers in New South Wales (NSW), Australia, which has recently been relinked with police reported crash and hospital data resulting in up to 13 years of follow-up.30 The DRIVE study collected information on a large number of crash risk factors, allowing to explore the following research questions: do young novice drivers with driving offences during their first years of driving have a higher risk of car crash up to 13 years after they first started driving compared with drivers with no offences? Does this vary by type of driving offence and type of crash? Are differences in risk of crash between drivers with and without offences explained by established crash risk factors?
MethodsStudy designThe study was a prospective cohort study.
SettingNSW is Australia’s most populous state with 7.5 million residents3 and 4.28 million registered passenger vehicles, the most of any state in Australia.31
Data sourcesWe used data from the DRIVE study, a 2003/2004 survey of 20 822 young drivers in NSW Australia.30 Drivers were eligible to participate if they were 17–24 years old and held their first-stage NSW provisional motor vehicle (car) driver’s licence. The DRIVE study collected information on driver’s demographics, driving exposure, driver’s experience and training and known and hypothesised crash risk factors (table 1).24 30 Data collection and the study cohort have been described in detail elsewhere.30
The survey data were linked with data from state and federal government authorities: offence data from Transport for NSW, police recorded crash data from the NSW Centre for Road Safety, hospital data from the NSW Admitted Patient Data Collection (APDC), death data from the NSW Registry of Births Deaths and Marriages (RBDM) and cause of death data from the Australian Bureau of Statistics (ABS). Police reported crashes, hospital and death data were available up to 2016 and offence and sanctioning data from study entry in 2003/2004 until 31 December 2006.
The offence data contain information on all recordable offences, by type of driving offence and driving sanctions issued. The NSW Centre for Road Safety CrashLink system provides information on all persons injured or killed due to road crashes that occur on NSW public roads. The data provide, among other, information on the severity and circumstances of the crash. The APDC includes records for all hospital separations (discharges, transfers and deaths) from all NSW public and private hospitals and day procedure centres, coded according to the Australian modification of the International Statistical Classification of Diseases and Related Problems, 10th revision.32 The NSW RBDM contains information on all deaths in NSW. The ABS cause of death data includes information derived from the death certificate or coronial report on the cause of deaths.
The NSW Centre for Health Record Linkage (www.cherel.org.au) performed probabilistic linkage of the data sets and supplied deidentified data sets for analysis. For the crash, offence, hospital and death data, a master linkage key of identifying fields was derived using probabilistic record linkage methods and ChoiceMaker software,33 which uses ‘blocking’ and ‘scoring’ to identify definite and possible matches. Mortality data were linked via deterministic linkage.
Variables in the analysisThe risk factors under investigation were any driving offence or a driving offence for reckless driving, speeding, low-level speeding (exceeding speed limit by not more than 15 km/hour) or any other driving offence while driving a car by participants from study entry during 2003/2004 until 31 December 2006.
The study outcome measures were total number of crashes (police recorded crash, crash-related hospitalisation or death of the driver), crash-related hospitalisations or deaths of the driver and single vehicle crashes during follow-up from 1 January 2007 to 31 December 2016. Drivers who were sanctioned from driving were followed up after the end of the sanctioning period. Only crashes related to vehicles that the study participants could legally drive with an NSW car licence and hospitalisations where the study participant was identified as the driver of a car in the hospital data (ICD10-AM V40-V59 .0 and .5) were included in the study. The total number of crashes was derived from linkage of the cohort data with the crash, hospital and death data. Crash-related hospital admissions on the same day or within 1 day of a record in the police reported crash data were considered the same crash.
Potential confounders were identified from the survey data. These were measures of driver demographic characteristics (age, gender, geographical remoteness and socioeconomic status of area of residence and country of birth), mental health and drug and alcohol use (self-harm, cannabis, other drug and alcohol use), driver training and experience (supervised driving hours, months on learner licence, number of attempts on learner licence, self-rated driving ability, months between independent (provisional) driver licence and study entry, involvement in crash before the start of follow-up not related to driving offences included in the study), driving behaviour and attitude (risk taking behaviour, risk perception and sensation seeking) and driving exposure (average weekly driving) (table 1, online supplemental table 1).30 The selection of potential confounders for inclusion in the multivariable regression was based on evidence from previous analyses of the DRIVE data and the international literature,24 34–37 a detailed description of these variables and their data sources can be found in the online supplemental table 1.
Table 1Cohort characteristics by number of driving related offences*
We classified geographical remoteness of residence using the accessibility/remoteness index of Australia,38 and derived socioeconomic status (SES) from the ABS 2001 area level index of education and occupation,39 which was divided into NSW population quartile groups. We linked remoteness and SES information to the survey data by matching postal area.
Statistical analysisAlthough completeness of recording of survey variables used in the multivariable regression analysis was high (93%–100%), the joint percentage of missing data across analysis variables was 15%. For the regression analysis, missing values in the survey data were imputed using chained equations in Stata with 30 imputation cycles.34 The imputation model was assessed by plotting the imputed values against the non-missing data for each imputation cycle using the Stata user written package midiagplots35 and through numerical checks using descriptive statistics comparing the imputed with the non-missing data. Recording of outcome and the exposure (driving offence) data was complete, because this was derived from population level registry data.
We examined time to first crash during follow-up for different categories of driving offences using cumulative incidence curves. We analysed the association between the different crash outcomes and risk-taking behaviour in univariate and multivariable Poisson regression models with robust variance estimates.36 Count of crash events was the numerator and number of study participants the denominator in the models.
We included time between start (1 January 2007 or the end of sanctioning period) and end of follow-up (31 December 2016) as an offset variable in the regression models to account for different lengths of exposure of drivers who were banned from driving. We censored participants who died during follow-up at the date of deaths. Participants were followed from 1 January 2007 to 31 December 2016.
The influence of known crash risk factors on differences in crash between drivers with and without driving offences was investigated by adding measures of drug use and self-harm (model 2), risk taking behaviour (model 3), driver training and experience (model 4) seperately and all of these measures combined (model 5) to the regression model adjusted for driver demographics and driving exposure (model 1) (online supplemental table 2).
All statistical analyses were carried out using Stata V.15.
ResultsThe final study cohort comprised 20 781 young drivers (54.6% women). Records of 25 participants who died before follow-up and 16 duplicate records were excluded. Most participants were 17–19 years old (85.9%) and lived in metropolitan areas (74.4%) at the time of joining the study.
A total of 7860 drivers (37.8%) sustained at least one driving offence (table 1). Speeding was the most common type of driving offence (n=5097, 24.5%), and 2435 drivers (11.7%) were recorded as having at least one low speeding offence. Reckless driving was the second most common offence type investigated in this study (n=1087, 5.2%), and not displaying mandatory provisional licence plates (n=2131, 90.2%) was the most common type of offence among other offences (n=2363, 11.4%) (online supplemental table 3-6).
Compared with drivers with no driving offences a higher proportion of drivers with one or more offences reported high risk taking and sensation seeking behaviours and more frequent cannabis smoking and alcohol consumption (table 1). During the study period 2487 (12.0%) participants were involved in at least one car crash, of these, 129 (0.6%) were hospitalised for crash related injuries, 5 died in a car crash and 263 (1.3%) had a single vehicle crash (table 2).
Table 2Number of crashes during follow-up (2007–2016) by driving offence type*
For all types of driving offences, a higher proportion of drivers with a registered offence crashed during follow-up (figure 1). For any offence, the rate of crash increased by number of driving offences, with 13.4%, 15.2% and 22.4% of drivers with one, two and three or more offences, respectively, having been involved in at least one crash by the end of follow-up. Of those with one or more reckless driving offences, 19.4% had crashed at the end of follow-up, compared with 11.5% of drivers with no such offence.
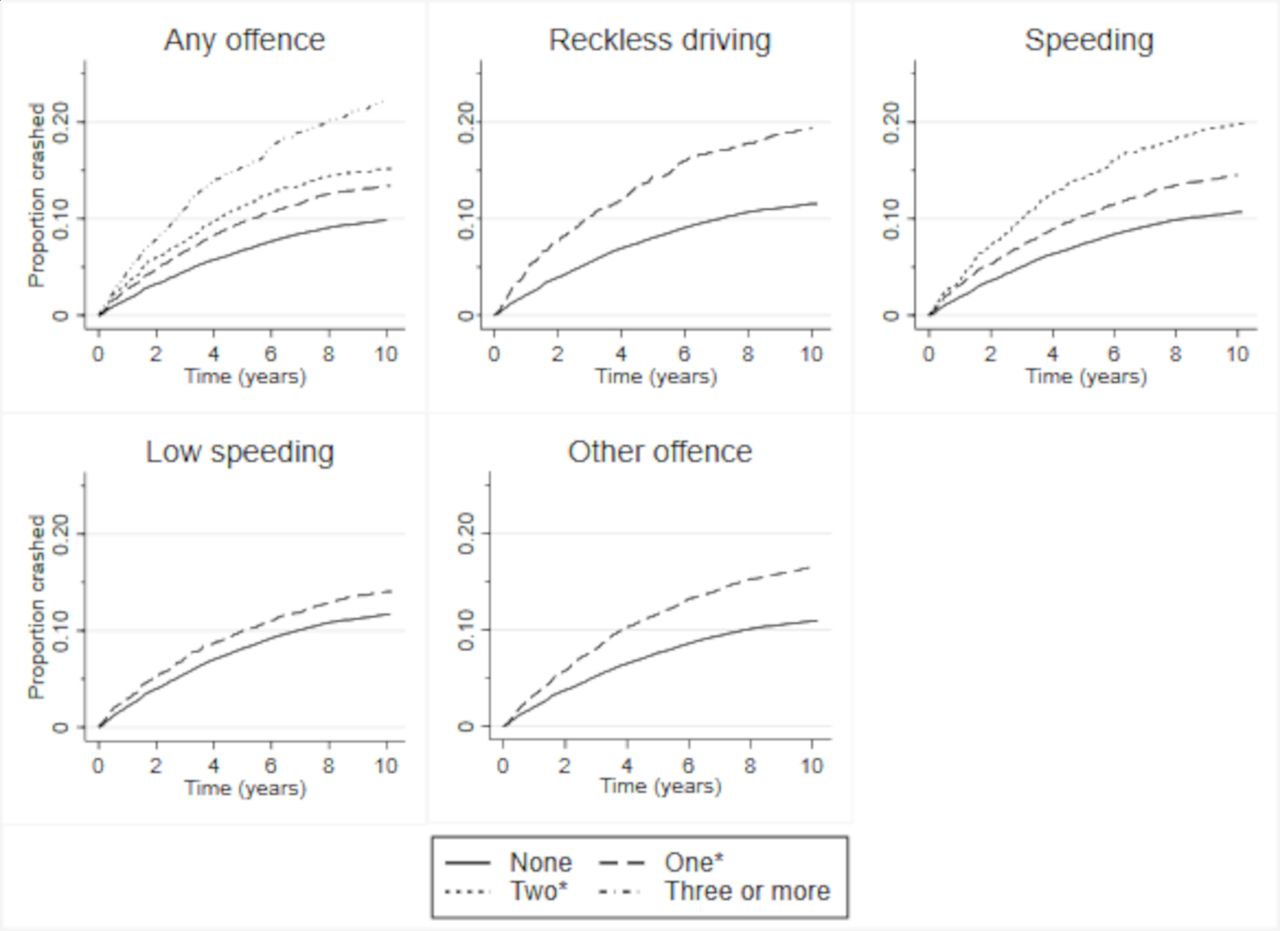 Figure 1
 Time to first crash (2007–2016) by prior driving offence#. #Offences from joining DRIVE study in 2003/2004 until end of 2006. *One or more/two or more for offences with less than three categories
After adjusting for confounding in the multivariable regression analysis (table 3), we observed an increased rate of crash for drivers with any driving offence for all crash outcomes. The rate of crash increased with the number of driving offences for all three crash outcomes investigated. Drivers with three or more driving offences had 2.25 (95% CI 1.98 to 2.57), 2.87 (95% CI 1.60 to 5.17) and 3.28 (95% CI 2.28 to 4.72) times higher rates of any crash, crashes that resulted in hospital admission or death and single vehicle crashes compared with drivers with no driving offences (figure 2). Drivers with one or more reckless driving offences had 1.35 (95% CI 1.17 to 1.56), 3.00 (95% CI 1.83 to 4.92) and 1.32 (95% CI 0.88 to 1.99) times higher rates of any crash, crashes that resulted in hospital admission or death and single vehicle crashes, respectively, compared with drivers with no reckless driving offences. Drivers with one or more low speeding offences had no increased rate of crash. Entering potential risk factors for crash separately to the model showed that these only had little effect on the differences in crash rates between drivers with and without driving offences (online supplemental table 7).
 Figure 2
 Rate ratios# of any crash, hospitalised crash or death and single vehicle crash during 2007–2016 by type of driving offence 2003–2006. #Model adjusted for: M1: age, sex, socioeconomic status of area of residence (SEIFA index), remoteness of area of residence and average driving per week. M5: age, sex, socioeconomic status of area of residence (SEIFA index), remoteness of area of residence, average driving per week, cannabis smoking, alcohol consumption, drug use and self-harm, risk perception score, risky driving score, sensation seeking score, self-rated driving ability, number of attempts on driver test, crash before start of follow up not related to driving offence, lessons with professional driving instructor and time on learner licence.
Table 3Rate ratios* of any crash, hospitalised crash or death and single vehicle crash during 2007–2016 by type of driving offence 2003–2006
DiscussionWe showed that drivers with police reported offences during the first 3 years of driving had increased rates of crash up to 9 years later compared with those with no driving offences. The rate of crash increased with higher number of driving offences. Adjusting for established crash risk factors only had a small effect on the differences in crash between drivers with and without offences.
Our findings add to and expand on those of previous studies that also showed an increased risk of crash in drivers with previous driving offences.15 16 Similar to our findings of an increased risk of crash in drivers with more driving offences, previous studies from Australia20 and the USA23 reported a 40% increased risk of crash in young drivers with driving offences and a cohort study from Israel showed a 65% increased risk of severe and fatal crash per driving ticket per year.16 In comparison, a study from Western Australia reported 3%–13% increased odds of traffic offence for drivers that required hospital admission for crash-related injuries.15 The comparably smaller risk reported in this study can at least in part be explained by differences in study design. The Western Australian study only included subjects hospitalised for crash and retrospectively assessed if these had prior driving offences. In comparison, our study prospectively measured if drivers with a driving offence were involved in a car crash.
Another study from Queensland, Australia, reported an increased risk of crash in the month after a driving-related offence relative to a comparable driving period 12 months prior.17 The risk of crash decreased with increasing time after the offence and the authors concluded that offences might indicate periods of risky driving that in turn might be associated with an increased risk of being involved in a crash. Our results are not directly comparable due to differences in study design. The Queensland study used a case cross-over design thereby comparing driving periods and risk of crash in the same driver in the months after a driving offence compared with a similar time period 12 months prior. In comparison, we followed drivers for up to 9 years after a driving offence but could not ascertain the temporal relationship between further offence and crash as our offence data were limited up to 2006.
Although penalty systems have been shown to have a deterrent effect at population level,9–14 our results suggest that they might not be successful in reducing the risk of crash in some of the drivers who already offended, in particular in those with repeat offences. Previous studies suggested that the relationship between driving offences and crash might be explained by higher risk-taking behaviours in those with driving offences15 16 In our study, drivers with offences reported higher levels of risky driving, sensation seeking behaviours and drug and alcohol use compared with those with no driving offences, but adjusting for these in the analysis did not explain differences in crash. Possible explanations could be that reported risky driving and sensation-seeking behaviours differ from actual driving behaviour; the instruments used to measure these behaviours do not accurately reflect these or that driving offences are an indicator for other driver characteristics that were not accounted for in the study. For example, a previous study investigating sensation-seeking behaviour and riding style in a moped simulator showed that high thrill and adventure seekers performed worse only if they also were bad decision makers.37 To what extend decision making and other factors contribute to crash in those with driving offences needs further investigation. This could be explored in naturalistic driving studies that collect information on driver behaviour linked with offence and crash data.
Based on their findings that offences mark episodes of risky driving, the authors of the Queensland study suggested that a licence suspension version of ‘flash incarceration’ may yield safety benefits.17 Although such measures might have an immediate effect, our findings showed that measures targeting the underlying reason of repeat offending and identification of factors contributing to crash in this group of drivers are needed to achieve long-term benefits. Brief interventions focusing on personal psychological risk factors integrated into driver training programmes have been shown to be effective in reducing speed-related traffic violations.40 Moreover, evidence from the effectiveness of programmes targeting drink driving showed that holistic early intervention programmes combining deterrence and addressing the underlying problem behaviours might be successful in reducing offending and associated car crashes.41 In NSW, intervention programmes are currently only targeted at drivers with drink driving offences. Additional programmes aimed at drivers with other driving offences, in particular repeat driving offences, have the potential to further reduce repeat offences and crashes.
However, research on socioeconomic status and driving offences showed that drivers from low socioeconomic background are disproportionally affected.42 Similar findings have been reported for the relationship of socioeconomic status and crash.43 44 These findings suggest that road transport injury prevention also needs to address the underlying causes of social inequalities to reduce driving offences and crash.
Strength and limitationsThe strengths of this study are its large sample size of over 20 000 participants, the rich information on potential confounders and the long follow-up.
Some of the limitations are inherent to the use of routinely collected data and survey data relying on self-report. Crash data were derived from NSW routinely collected police, hospital and deaths data. Crashes that were not reported to police, did not require hospital admission and did not result in deaths or occurred outside of NSW were not covered in the analysis. Participants in the DRIVE study were volunteers; as such, the cohort was not a representative sample of the general population. Like other large cohort studies, the DRIVE study can only provide generalisable estimates of the relative associations between risk factors and outcome,45 46 but not absolute numbers or incidence rates. Another limitation was potential bias in self-reported data, which could, for example, occur from recall bias or social desirable responding to interview questions.47 48
Information on driving offences was only available for the first 3 years of driving as such we could not ascertain if drivers with subsequent crashes had further driving offences and if these were at the time of the crash. Moreover, measures of potential confounders were based on information from the baseline interview, and we were not able to adjust for changes during follow-up.
ConclusionRepeat driving offenders have a substantially higher risk of crash compared with drivers with no offences. Measures that successfully mitigate the underlying risk factors for both, crashes and offences, have the potential to improve road-safety.
What is already known on the subjectYoung novice drivers are disproportionally affected by road transport crashes.
Penalties are key component to improve road user safety.
Drivers who incur offences are at increased risk of car crash.
What this study addsDrivers with police reported offences are at increased risk of crash up to 9 years later.
The risk of crash increases with higher number of driving offences.
Divers with reckless driving offences have highest rates of hospitalised crashes.
Adjusting for established crash risk factors does not explain higher crash rates.
Data availability statementData can be obtained upon request and ethics approval.
Ethics statementsPatient consent for publicationEthics approvalThis study involves human participants and was approved by Australian Health and Medical Research Council Ethics Committee ID:HREC/16/CIPHS/9. Participants gave informed consent to participate in the study before taking part.
留言 (0)