
記住我


A main strength is that we first evaluated the trend of long-term white cell count (WCC) and investigated how different WCC trajectories are related to type 2 diabetes mellitus risk.
The study was conducted using a large sample, standardised methods of data collection.
This is a longitudinal, population-based study of Shenyang.
Subgroup analyses were conducted according to trajectory change of WCC in physical examination.
Regarding a probable limitation, complete occurrence of endpoint is not quite possible, thus necessitating follow-up researches in the future.
IntroductionCurrently, the incidence of diabetes is increasing. It has ranked third among chronic non-infectious diseases just following cancer and angiocardiopathy.1 According to the International Diabetes Alliance, as of 2019, there are approximately 116 million patients with diabetes in China, ranking first in the world. It is estimated that in 2045, the number of patients with diabetes in China will reach 147 million.2 The associated medical costs are also increasing annually, with US$51 billion spent on diabetes-related medical expenses in China in 2015.3 Therefore, the identification of cost-effective biomarkers at the population level is important in the prevention of diabetes.
Recent years have seen the emergence of the inflammatory theory of type 2 diabetes mellitus (T2DM), where the function of inflammatory factors is crucial in the T2DM contraction and progression.4 5 Regarding new-onset T2DM, its powerful predictors include the C reactive protein,6 the IL (interleukin)-6,7 the tumour necrosis factor-α,8 as well as the white cell count (WCC).9 Among these, the WCC is frequently used in the clinical medical work and physical examination as a regular inflammatory biomarker. Cardiac failure among patients with coronary artery disease and diabetes is predicted by the WCC.10 Researches have revealed the effect of WCC on T2DM risk prediction.11–13 However, only single WCCs have been observed, and the association between the dynamics of WCCs over time and development of T2DM has not been investigated. This does not always reflect the actual linkage of the WCC to the T2DM risk.
As a repeated measurement-based technique for analysing data, the trajectory model achieves grouping by following a homogeneous trajectory of development.14 15
In our previous study, we used trajectory model to study the relationship between the trajectory change of ApoB/ApoA-I ratio and type 2 diabetes.16 Good results have been achieved. Trajectory model allows the trend assessment of prolonged WCC and investigation of how different trajectories of WCC are associated with the risk of T2DM. The correlation of longitudinal WCC trajectory with newly diagnosed T2DM remains inadequately investigated to date on a global scale. In the present work, a dynamic cohort was created by using the longitudinal data of physical check-ups from Shengjing Hospital affiliated to China Medical University. The correlation exploration between longitudinal WCC trajectory and T2DM aimed to offer proofs about the prevention and management of T2DM.
Patients and methodsStudy patientsPhysical check-up data were gathered from individuals who received annual health check-ups at Shengjing Hospital affiliated to China Medical University.
Initial physical check-up was carried out from January 2016 to December 2016, after which physical check-up was accomplished once yearly. The baseline population comprised individuals attending the 2016 physical check-up, while those attending the 2017–2019 physical check-ups were deemed the population with repeated measurements. The physical check-ups were identical in content and procedure every year, each consisting of an epidemiological questionnaire, a blood biochemical indicator testing, as well as anthropometry. A total of 7924 subjects fulfilled the inclusion and exclusion criteria set below.
Inclusion criteria: (1) attending and completing all of the four physical check-ups from 2016 to 2019 and (2) WCC quantities remained integral in four physical check-ups.
Exclusion criteria: (1) those refusing the research participation; (2) diagnosed with diabetes at the initial physical check-up. (3) missing information about WCC quantities at any time in the course of any physical check-up; (4) having a history of carcinoma, cardiocerebrovascular condition or severe rheumatism based on baseline screening and (5) patients with infections, or after it (figure 1)
 Figure 1
 Flow chart of records that were excluded from the physical examination database.
A total of 7924 adults, comprising 5075 (64.05%) females and 2849 (35.95%) males who participated in the present analysis, were subjected to a 3-year follow-up. Their median baseline age was 40 (IQR 34–54) years.
Data collectionThe following physical check-up data were gathered during the baseline visit and follow-ups: (1) Demographic traits (age, gender, etc) were acquired through face-to-face interviews and normalised questionnaires; (2) Anthropometric indices (height, weight, etc) were acquired by well-trained doctors and nurses. Determination of height (cm) and weight (kg) was accomplished without hats, light clothes and shoes and (3) Blood biochemical testing: Since 0:00 on the check-up day, the individuals fasted in addition to taking water. Venous blood was sampled at 8:00 hours, and determination of hepatic functionality, fasting blood glucose (FBG) and blood lipid concentrations were accomplished. Moreover, all the involved examination procedures and reagents used therein were authorised by the aforementioned hospital’s inspection centre.
Relevant definitionsAny subject was considered to have T2DM17 when: (1) doctoral diagnosis with T2DM was confirmed in the follow-up course; (2) hypoglycaemics agents were used over the past 2 weeks; (3) FBG level was ≥7.0 mmol/L (126 mg/dL) and (4) glycosylated haemoglobin level was ≥6.5%.
Statistical methodsOutput of the physical check-up data were accomplished by Shengjing Hospital’s medical information system, and a specially designated analyst was responsible for sorting these data. SPSS V.22.0 combined with Stata V.13.0 was used for the data assessment. The ‘traj’ in Stata was exploited for the trajectory modelling.18 Given the continuous nature of the WCC quantity variable, the trajectory groups were quantified initially by adopting the cNorm mode, followed by the polynomial order evaluation for every trajectory group. The optimal trajectory model was selected based on the postgrouping average probability plus Bayesian information principle. Next, relevant degree of trajectory matching was evaluated. Among the eventually derived 4 groups of trajectories, the optimal models were those having polynomial orders 1, 1, 1 and 1. In consideration of the non-normal data distribution, the quantitative data were presented as interquartile ranges and medians. Group comparison then proceeded through the Kruskal-Wallis test. Qualitative data were presented as percentages and frequencies, while the group comparison was accomplished through the χ2 test. The HRs and 95% CI were estimated with the Cox PH (proportional-hazards) model, based on which the associations of varying WCC trajectories with the probability of T2DM were investigated.
ResultsDetermining the grouping of WCC trajectoriesFollowing the WCC-associated temporal variations over 4 years, we identified four different patterns of trajectories: (1) in the low stability group, the value of the WCC fluctuated between 4.16 and 5.76×10⁹ /L, and the trajectory of the WCC remained stable, (2181 cases (28.2%)); (2) in the middle stable group, the value of the WCC fluctuated between 5.49 and 7.49×10⁹ /L, and the trajectory of the WCC remained stable (3664 cases (44.8%)); (3) in the medium and high stable group, the value of the WCC fluctuated between 7.80 and 9.30×10⁹ /L, and the trajectory of the WCC remained stable (1741 cases (22.5%)); (4) in the high stability group, the value of the WCC fluctuated between 8.36 and 12.08×10⁹ /L, and the trajectory of the WCC remained stable (338 cases ((4.4%)) (figure 2).
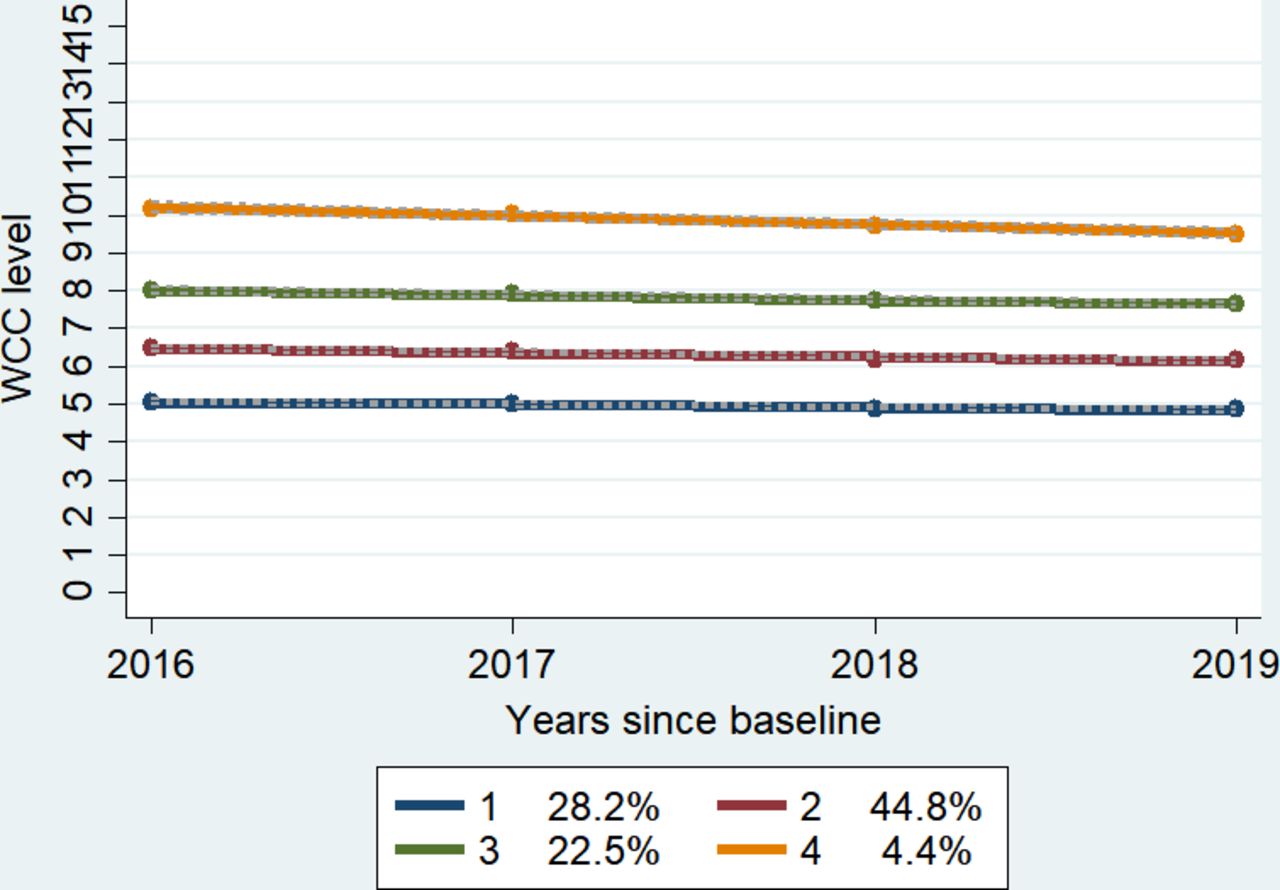 Figure 2
 Four WCC trajectories under the best-fit model in 2016–2019. WCC, white cell count.
Baseline characteristics of different WCC trajectoriesFor the grouping of baseline population, a variety of WCC trajectories was used. As displayed in table 1, differences were found significant regarding age, gender, red cell count, platelet count, as well as the levels of total protein, albumin, alanine aminotransferase, aspartate aminotransferase, γ-glutamyl transpeptidase, total/direct bilirubin and total bile acid (p<0.05).
Table 1Baseline characteristics according to WCC trajectory
Distribution of incidence rate of T2DM using two different grouping methodsThe baseline WCC was grouped according to different WCC trajectories, with assignment of the patients into either one of four (trajectories 1–4) groups, corresponding, respectively, to the T2DM morbidities of 2.2%, 2.62%, 4.82% and 7.4%.
Grouping of the baseline WCC was accomplished under four percentiles, with respective T2DM morbidities of 2.11%, 2.79%, 3.55% and 4.23%. As revealed by the log-rank test, significant intersubgroup differences were noted in the T2DM morbidity (log-rank, χ2=42.15 and 16.83) (p<0.01). Figure 3 details the T2DM morbidity statistics.
 Figure 3
 Distribution of incidence rate of T2DM by two different grouping methods. T2DM, type 2 diabetes mellitus; WCC, white cell count.
The Cox PH model analysis of the effect of the WCC trajectory on the risk of T2DMThe associations of varying WCC trajectories with the incidence of T2DM were detailed in table 2. Model 1 was a univariate Cox PH model; model 2 was an adjusted (baseline age and gender) version of model 1; in model 3, further modifications were made to the levels of total protein, alanine aminotransferase, aspartate aminotransferase, γ-glutamyl transpeptidase, total/direct bilirubin, as well as red cell count and platelet count on the basis of model 2. The HR (95% CI) in model 3 was 1.94 (1.32 to 2.83), which was associated with T2DM in trajectory 3. The HR value for trajectory 4 was 3.08 (95% CI 1.82 to 5.21). The T2DM incidence was higher for these trajectories in contrast to the trajectory 1 (table 2).
Table 2Cox proportional hazards model of the WCC trajectory, baseline WCC quartile and type 2 diabetes onset
The baseline WCC was grouped with fourth percentile. Based on model 3, the HR (95% CI) of T2DM was 1.68 (1.13 to 2.5) in the Q (quartile) four subgroup, exhibiting statistical difference from that in the Q 1 subgroup. In contrast to the Q 1 subgroup, insignificant differences were noted in the Q 2 and Q 3 subgroups.
DiscussionThe present work was the first attempt to investigate the correlation of longitudinal WCC trajectories with the incidence of T2DM, where the research cohort of Shengjing Hospital’s physical examination centre was used. As demonstrated by the results, the T2DM prevalence among the investigated subjects rose to 7.4% from 2.2% when the WCC quantities from low-trajectory and high-trajectory subgroups were taken into account. Moreover, statistical significance was present regarding such differences. In contrast to the trajectory 1, statistically significant progressive elevation in the HR of T2DM was noted from trajectory 3 to trajectory 4 under the Cox PH model that described the effect of WCC trajectory on T2DM incidence. To be specific, the higher the trajectory concerning WCC, the higher the probability of T2DM.
The role of WCC quantity in the diabetic pathogenesis has attracted attention over recent years. Linkage of an elevated WCC quantity to the risk of type 2 diabetes has been reported extensively.19–21 However, the correlation strength remains controversial. For example, according to a meta-analysis involving 20 researches,11 a WCC quantity elevation was linked to a high probability of T2DM, although there were many potential confounding factors in the study, which may have exaggerated the correlation. In another cohort study on young males,13 WCC quantity elevation within normal scope was considered an independent factor for the diabetes occurrence. According to the traditional cohort study grouping method, after grouping the baseline WCC by quartile, the results were similar to those of previous studies. However, after adjusting for confounding factors, our study only showed a significant difference in HR values between the highest WCC quartile and lowest WCC quartile. This suggests that a single test of elevated WCC quantity is not a favourable T2DM predictor.
The above research methods are a single measurement of baseline WCC, without considering the impact of long-term WCC changes on the outcome. In our study, the relationship between the trajectory of WCC and the T2DM morbidity was elaborated initially. In contrast to low trajectory subjects, pronouncedly higher risk of T2DM onset was noted in the trajectories 2, 3 and 4. In the corrected model 3, the highest HRs for the T2DM onset were observed in the highly stable group with mean WCC fluctuations of 8.36–12.08×10⁹ /L. This suggests that clinicians should be aware of the probability of contracting T2DM when the WCC is perennially higher than normal. The mechanisms underlying the association between WCC and the development of T2DM are unclear and may be related to several factors: (1) Serum IL-6 and IL-8 can promote WCC differentiation, increase WCC,22 and interrupt insulin signalling in the liver to cause insulin resistance.23 24 It can be inferred that WCCs and other inflammatory variables probably act synergistically on the T2DM contraction and progression. (2) Hormones exert a crucial function in the production and maturation of WCCs. Glucocorticoid levels in patients with T2DM are increased. This promotes gluconeogenesis and aggravates insulin resistance.25 Therefore, hormones may be another link between WCC and T2DM.12
On the downside, our present research still has limitations. First of all, data pertaining to the diagnosis based on oral glucose tolerance test were inadequate, which possibly led to underestimated cases of diabetes. Second, complete occurrence of endpoint was not quite possible since the follow-up duration was merely 3 years, which necessitates further researches in the future. Final review of the health information among the physical examination takers found that relevant outcomes concerning the Insulin Resistance (IR) estimation were insufficient, so direct assessment of relationship between WCC and IR was not possible.
It can be concluded that longitudinal high trajectory of WCC is a crucial predictor for the T2DM onset. Where the mean WCC stays between 8.36 and 12.08×10⁹ /L, the T2DM onset is most probable. Monitoring the trajectory of WCC helps identification of high-risk population for T2DM, to whom the application of early community health interventions can lead to lowered T2DM onset.
Data availability statementData are available on reasonable request.
Ethics statementsPatient consent for publicationEthics approvalThe study was approved by the foregoing hospital’s Ethics Committee (IRB reference No. 2019PS089J).
留言 (0)