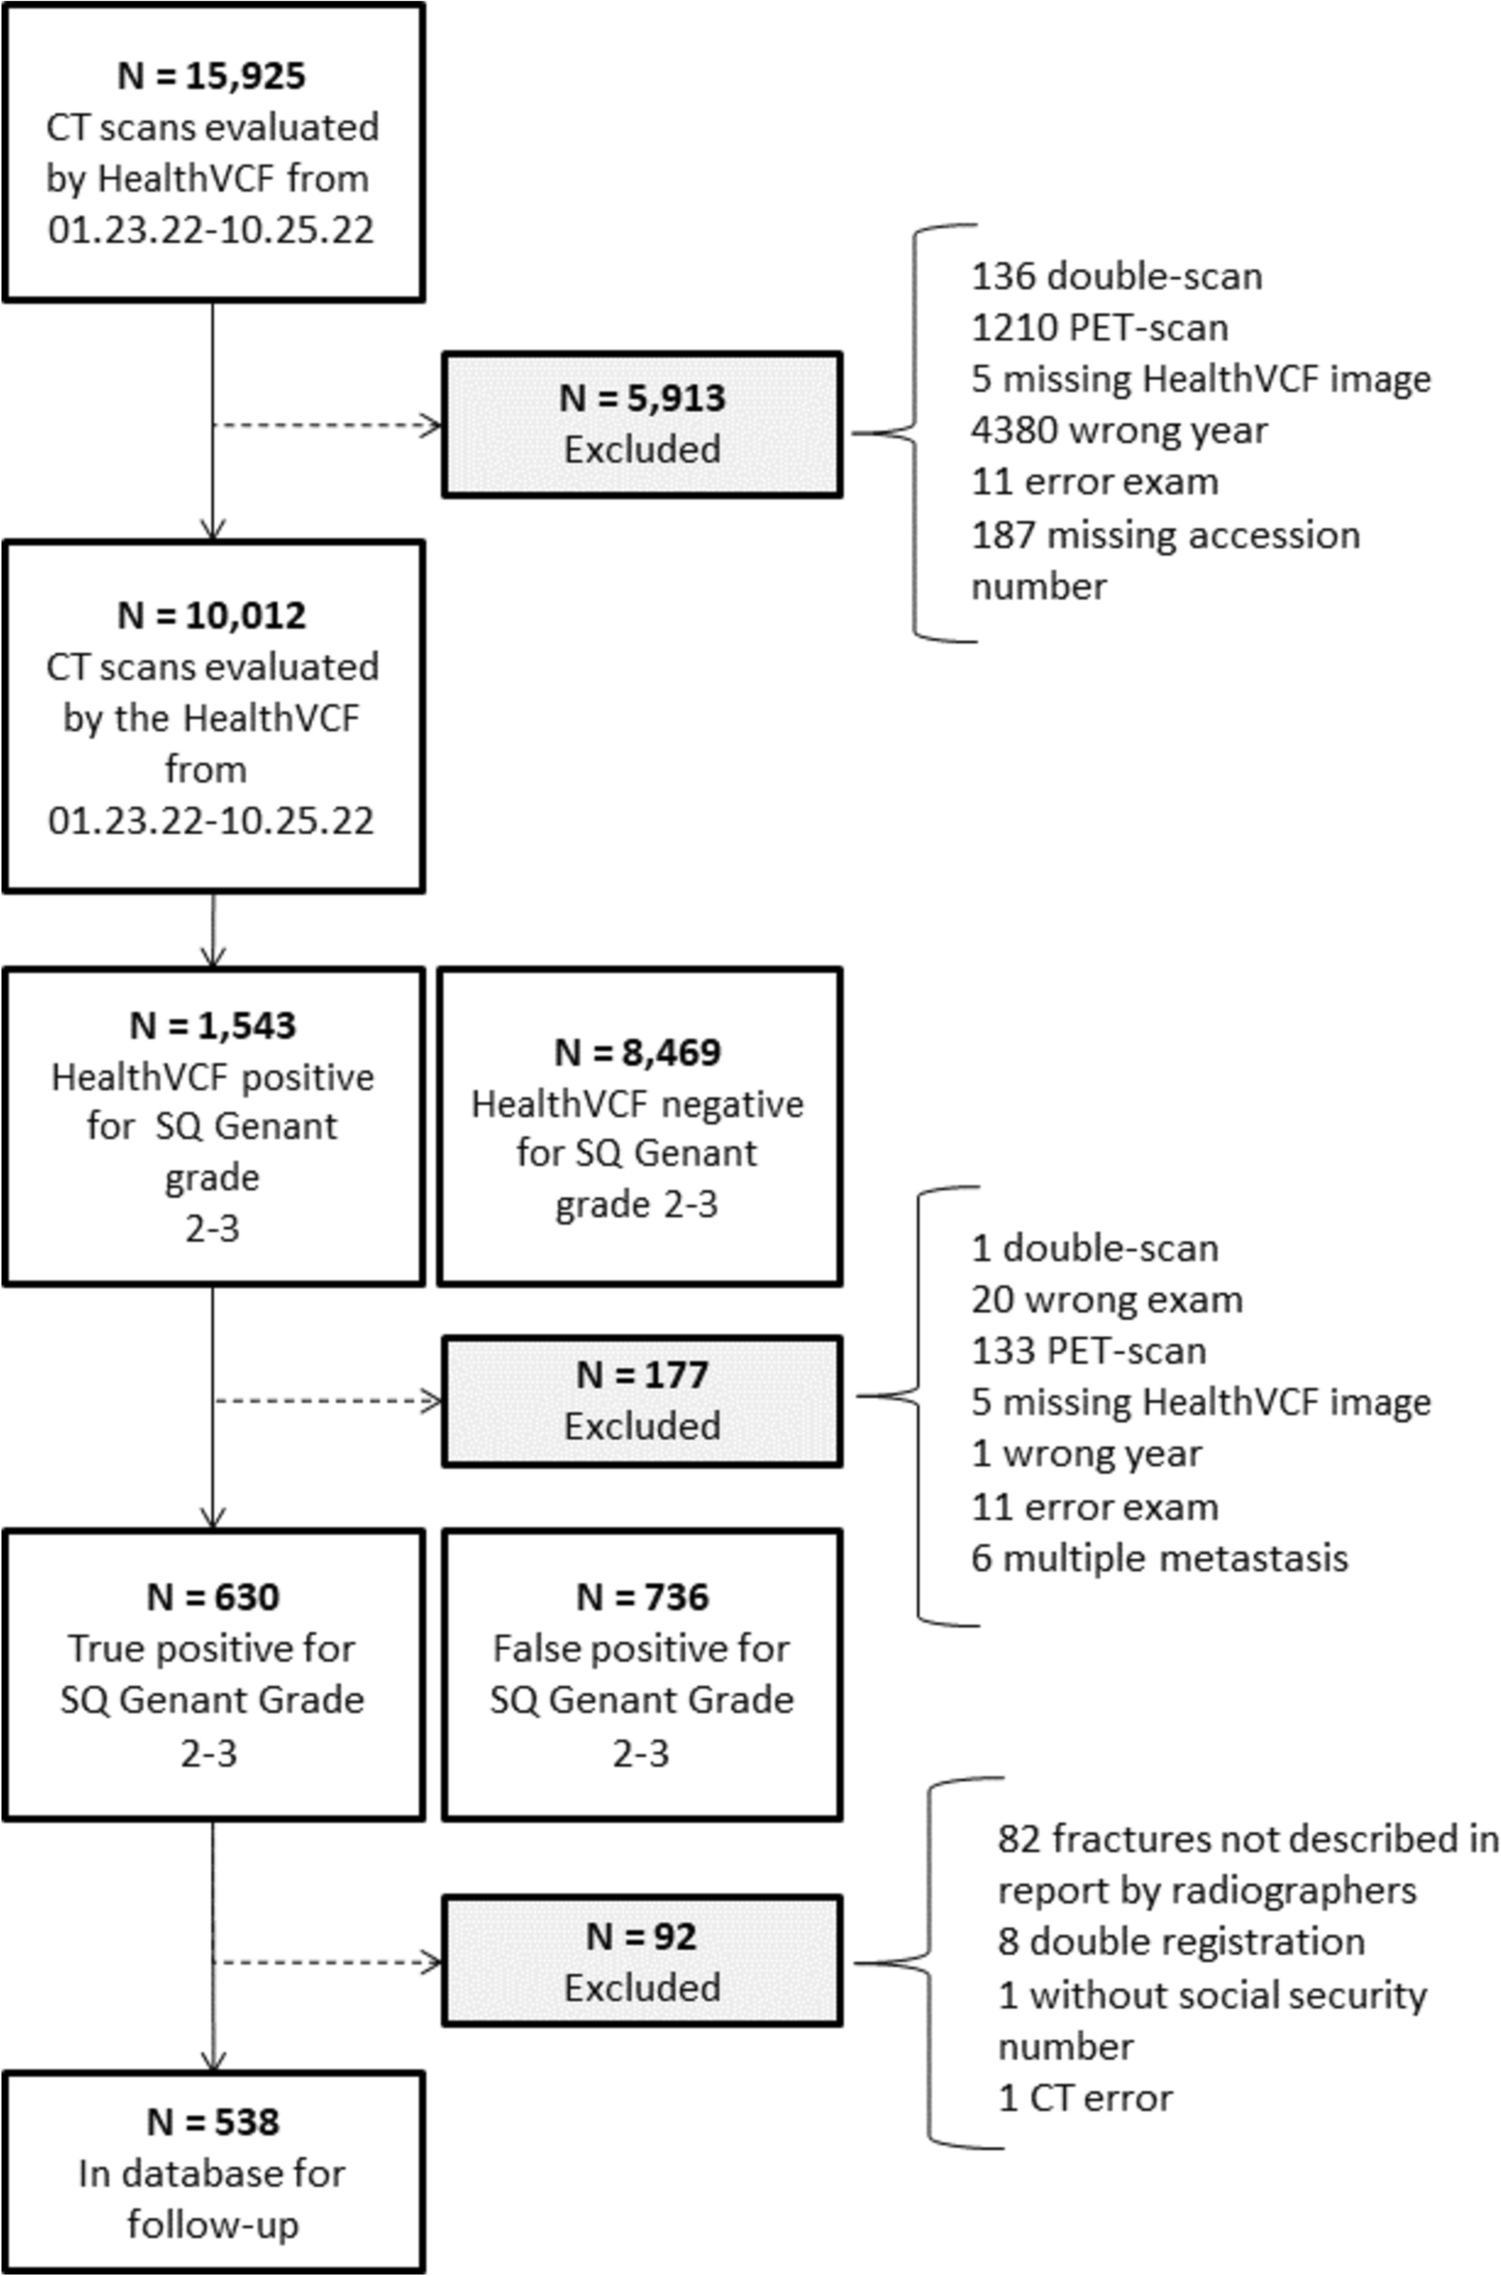
Study Population
The data analyzed in the present investigation were from the English Longitudinal Study of Ageing (ELSA), which is a panel study with a representative sample of the population aged 50 years or older residing in England. The study began in 2002 with a sample composed of participants from the Health Survey for England. Interviews were conducted with the use of questionnaires every 2 years. Biochemical exams and physical performance measures were collected by a nurse and repeated every 4 years. More details on the ELSA study can be found in previous publications [19, 20].
The sample of the present investigation was composed of 3205 non-dynapenic individuals aged 50 or older who participated in the ELSA study in 2012 (wave 6), which was the first year that serum 25(OH)D levels were collected. All participants signed a statement of informed consent. ELSA received approval from the National Research Ethics Service—London Multicenter Research Ethics Committee.
Serum Concentrations of 25-Hydroxyvitamin D [25(OH)D]
The serum concentration of 25(OH)D was collected for the first time in ELSA in 2012, which was considered baseline for the present investigation. Blood samples were collected by nurses and the determination was performed by chemiluminescence (Diasorin Liaison Immunoassay) at the Royal Victoria Infirmary (Newcastle upon Tyne, United Kingdom), which participates in the Vitamin D External Quality Assessment Scheme. The serum 25(OH)D assay has an analytical sensitivity of 7.5 nmol/L, with a coefficient of variation from 8.7 to 9.4%. All assays were performed in duplicate. In the present analyses, serum 25(OH)D concentrations were categorized based on the US Institute of Medicine (IOM): sufficient (> 50nmol/L), insufficient (≥ 30 and ≤ 50nmol/L) and deficient (< 30nmol/L) [21, 22].
Neuromuscular Strength—Dynapenia
Grip strength was measured using a handheld dynamometer (Smedley’s for Hand) with a scale from 0 to 100kg. The dynamometer was adjusted to the size of each participant’s hand. Three trials were performed with a one-minute interval between trials. The highest value achieved on the dominant hand was considered in the analyses [19, 20, 23].
Only individuals without dynapenia (grip strength ≥ 26kg for men and ≥ 16kg for women) at baseline were included in the present investigation. Individuals with grip strength < 26kg for men and < 16kg for women after 4 years of follow-up were considered incident cases of dynapenia [23].
Covariates
The covariates collected at baseline were selected based on associations between the reduction in neuromuscular strength and serum 25(OH)D concentrations reported in previous studies [21,22,23,24,25,26,27].
The sociodemographic characteristics considered were sex, age (50–59; 60–69; 70–79; 80 years or more), educational level (0–11; 12–13; > 13 years), quintiles of total wealth (sum individual’s or a household’s total financial assets and net worth [assets—debts] accumulated over their lifetime), being classified from the highest (1st quintile) to the lowest wealth (5th quintile), ethnicity (white or non-white) and condition of living or not living alone [26, 27].
Health behavior variables included were physical activity level, smoking status and alcohol intake. Physical activity level was evaluated using three questions taken from a validated instrument used in the Health Survey for England. The participants were asked about the frequency with which they practiced exercise (once per week, more than once per week; one to three times were more or hardly ever/never) and the intensity of exercise. Activities were classified as vigorous (running, swimming, cycling, tennis, aerobics, weightlifting), moderate (gardening, washing the car, walking at a moderate pace, dancing, stretching) and light (vacuuming the home, washing clothes, household repairs). The individuals were classified as physically inactive/having a sedentary lifestyle (no weekly activity) or active (light, moderate or vigorous activity at least once per week) [26]. With regards to their smoking status, individuals were classified as non-smokers, ex-smokers or smokers. In terms of weekly alcohol intake, participants were classified as those who drank alcoholic beverages up to once a week, those who drank two to six times a week, and those who drank daily [26].
Health conditions were evaluated based on self-reports of having a medical diagnosis of stroke, osteoarthritis, cancer, heart disease, lung disease and osteoporosis [26, 27]. Diabetes and systemic arterial hypertension were defined based on self-reports of a medical diagnosis. These reported conditions were confirmed by the medications taken and glycated hemoglobin (HbA1c) for diabetes and the measurement of systolic and diastolic blood pressure for hypertension. Individuals without diabetes were those without self-reported diabetes combined with the non-use of medications and HbA1c < 6.5%; individuals with controlled diabetics were those with self-reported diabetes combined with the use of medications and HbA1c < 7.0%; and individuals with uncontrolled diabetics were those with self-reported diabetes combined with the use of medications and HbA1c ≥ 7.0% [28]. Individuals without hypertension were those without self-reported hypertension combined with the non-use of medication, systolic blood pressure < 140mmHg and diastolic blood pressure < 90mmHg; individuals with controlled hypertension were those with self-reported hypertension combined with the use of medications, systolic blood pressure < 140mmHg and diastolic blood pressure < 90mmHg; individuals with uncontrolled hypertension were those with self-reported hypertension combined with the use of medications, systolic blood pressure ≥ 140mmHg and diastolic blood pressure ≥ 90mmHg [29].
Depressive symptoms were evaluated using the short Center for Epidemiologic Studies Depression Scale, with ≥ 4 points considered indicative of the risk of depression [30]. Cognition was evaluated using the word-list learning test, which is divided into two parts: immediate recall (participant hears 10 words and repeats them immediately) and delayed recall (participant is asked to recall the words after three minutes). The score is obtained by the number of words correctly cited on both parts of the test and ranged from 0 to 20 [19, 20].
Waist circumference was measured with a metric tape positioned at the midpoint between the last rib and iliac crest during the expiratory phase with the participant standing, arms alongside the body and trunk unclothed. Waist circumference was considered increased when > 102 cm for men and > 88 cm for women [31]. The body mass index (BMI) was categorized following the classification proposed by the World Health Organization (WHO): underweight (< 18.5 kg/m2), normal weight (≥ 18.5 kg/m2 and < 25 kg/m2), overweight (≥ 25 kg/m2 and < 30 kg/m2) and obesity (≥ 30 kg/m2) [31].
For the collection of the biochemical measures, the participants were asked to fast (except water) for 5 h [32]. Hypercholesterolemia was recorded when total cholesterol was ≥ 190mg/dl [33]. Insulin-like growth factor 1 (IGF-1) was classified following the recommendation by Stenholm and colleagues [34] per age group and sex [32]. Dehydroepiandrosterone sulfate (DHEA-S) was considered low when lower than the 20th percentile of the sample distribution stratified by sex [34].
Season of the year in which blood was collected for the determination of serum 25(OH)D was recorded and categorized as high solar incidence (June to November) and low solar incidence (December to May) in England. Vitamin D supplementation, the use of carbamazepine [anticonvulsant with potential to lower serum 25(OH)D levels] and appendicular skeletal muscle mass index (ASMI) were also used as control variables [35,36,37,38]. The ASMI was estimated using Lee’s equation and the cutoff point was the 20th percentile of the sample distribution (< 9.33 kg/m2 for men and < 6.66 kg/m2 for women) [9, 37,38,39].
Statistical Analyses
For the characterization of the sample, continuous variables were expressed as means and standard deviations and categorical variables were expressed as percentages. Differences between 25(OH)D strata among non-dynapenic individuals at baseline were determined using the chi-square test and analysis of variance with Tukey’s post hoc test.
For the calculation of incidence densities, the numerator was the number of individuals who developed dynapenia in the period analyzed and the denominator was the sum of the observation time of this population. Poisson regression models were also run because they offer better consistency and efficiency than logistic regression for estimating relative risk in longitudinal studies [40]. The unadjusted model was used to determine the association between level of serum 25(OH)D and the incidence of dynapenia after 4 years of follow-up. The final fully adjusted model was adjusted by seasonality, the use of carbamazepine, vitamin D supplementation, ASMI and incorporated sociodemographic characteristics, behavioral characteristics, clinical conditions and anthropometric and biochemical measures. To test the second hypothesis of the present study, the sensitivity model excluded individuals with osteoporosis and those who were taking vitamin D supplementation. The Stata 14® statistical package (StataCorp, College Station, TX, USA) was used for the data analysis. The multicollinearity between variables was evaluated by the variance inflation factor (VIF) and considered present when > 10 [41].


留言 (0)