
記住我
Neurodegenerative diseases, such as dementia and Parkinson’s disease (PD), are progressive degenerative diseases affecting neurons, which result in irreversible decline in brain functioning. It is estimated there are 50 million people living with dementia worldwide and over 6 million people living with PD, with these numbers predicted to increase substantially over the next decades due to ageing populations.1–3
Type 2 diabetes (diabetes from now on) is a well-established risk factor for dementia4 and PD5 indicating a potential shared pathophysiology involving insulin resistance and impaired glucose metabolism.6–8 Given the potential shared pathophysiology it is not surprising that drugs used to treat diabetes such as metformin are of increased interest for repurposing as possible novel treatments to treat and slow the progression of PD,9 10 cognitive decline and dementia.11 Metformin is a first-line antidiabetic medication that decreases insulin resistance and increases insulin sensitivity.12 Other antidiabetic drugs such as sulfonylureas, which are second-line antidiabetic drugs, stimulate the release of insulin from pancreatic beta cells.13 Despite approvals of newer drugs, sulfonylureas remain commonly prescribed after metformin.14 Previous studies and reviews on the potential neuroprotective properties of metformin have inconsistently reported that metformin is associated with reduced risk of dementia or PD,15–17 increased risk,18 19 and no association.20–22 Differences in study design, data quality, gender, race representation, and confounding may explain some of these inconsistencies.
Given these inconsistencies, the aim of the present study is to examine the associations of the first-line antidiabetic drug metformin compared with the second-line drug class sulfonylureas with: (1) incident all-cause dementia and PD, and (2) with secondary outcomes of Alzheimer’s disease (AD), vascular dementia (VD) and mild cognitive impairment (MCI). In this study, we use a large cohort of patient records from individual-level electronic health records from a large healthcare provider in the USA (OPTUM deidentified Electronic Health Records; OPTUM EHR) together with robust methods that address bias and confounding. We carried out subanalysis stratifying our population by age, race, renal function, and glycemic control to understand the impact on these populations. Our approach focusing on both dementia and PD and an analysis approach to reduce bias offer a novel aspect and substantial contribution to existing evidence on the impact of metformin and risk of neurodegenerative diseases.
Research design and methodsStudy design and settingA new user active comparator study was carried out to determine the comparative effect of metformin versus sulfonylurea users on dementia risk over a 5-year follow-up based on an intention-to-treat approach. A new user study design includes new users of treatments or diagnosis and excludes prevalent users which can bias results due to baseline covariates being influenced by treatment or disease. The active comparator design refers to a study that compares the effect of the drug of interest with another active drug used in clinical practice. We used OPTUM EHR data set containing data from primary care and secondary care facilities from over 100 million patients across the US general population.23 We had access to patient data from 1 January 2006 to 1 December 2018 for patients aged 40 years or older. Patient data were mapped to the Observational Medical Outcomes Partnership Common Data Model v5.3.1.24
ParticipantsWe included patients who were 50 years or older with a diagnosis of diabetes and at least 1 year of observational data between 2006 and 2018. Included patients were required to have at least 1 year of observation in the database prior to first prescription of metformin or sulfonylureas (baseline) and be free of any diagnosis of dementia, MCI, or PD prior to their first prescription. Patients with polycystic ovary syndrome were excluded due to off-label use of metformin. Since renal function can drive choice of antidiabetic prescription, included patients were required to have an estimated glomerular filtration rate (eGFR) measure (or related clinical diagnosis) and a hemoglobin A1c (HbA1c) measurement 1 year before metformin or sulfonylurea initiation. Those with chronic kidney disease (CKD) levels 4 and 5 as well as HbA1c level >9% were excluded as this is not indicative of metformin new users. Only patients who remained on monotherapy of either metformin or sulfonylureas for 2 years following first prescription were included in this study. Follow-up began after this 2-year period and lasted until the end of the 5 years, death, or dementia/PD diagnosis, whichever occurred first. During follow-up, participants could take additional diabetes medications, but those who switched between metformin and sulfonylureas were excluded.
Variables and data sourcesComorbidities were defined by standard concept codes based on SNOMED nomenclature using ATHENA (https://athena.ohdsi.org/search-terms/terms) and PHOEBE (https://data.ohdsi.org/PHOEBE/) tools. Clinical codes used define outcome, exposure and all other variables can be found in the online supplemental tables S1, S2 and S3.
Primary outcomes were all-cause dementia or PD defined using a combination of diagnosis and prescription records. Secondary outcomes included diagnosis of AD, VD and MCI. Metformin or sulfonylurea use was extracted from patient prescriptions defined by standard concept codes based on RxNorm nomenclatures. Sulfonylureas consisted of acetohexamide, carbutamide, chlorpropamide, tolazamide, tolbutamide, glibenclamide (glyburide), glibornuride, gliclazide, glipizide, gliquidone, glisoxepide, glyclopyramide or glimepiride. At least two prescriptions per year between baseline and the beginning of follow-up were required.
The 33 covariates used in this study were age (dichotomized at 75 years), gender, body mass index (BMI), race (Caucasian, African American, Asian, other/unknown), smoking status (current, previous, never, missing), US state region, comorbidities (angina, arthritis, atrial fibrillation, cancer, chronic obstructive pulmonary disease, CKD diagnosis and stages, coronary heart disease, eye disease, hypertension, heart attack, heart failure, high cholesterol, head injury, psychiatric disorders, peripheral arterial disease, substance abuse, stroke), healthcare utilization (number of outpatient visits), year of first prescription, lab measurements (HbA1c, eGFR) and medications (ACE inhibitors, glucocorticoids, non-steroidal anti-inflammatory drugs (NSAIDs), beta-2 agonists, diuretics and angiotensin receptor blockers). For measurement variables (ie, HbA1c, eGFR, BMI, etc), the value closest to baseline date within 1 year before metformin or sulfonylurea prescription was taken unless otherwise stated. BMI was calculated from height and weight when not reported directly. Height measurements within 5 years before baseline were allowed. BMI measurements lower than 15 kg/m2 and greater than 60 kg/m2 were removed, which is consistent with previous studies.25 For smoking, unknown or contradictory measurements on the same day were removed. HbA1c values ≤2% were removed. CKD stage was extracted from diagnostic codes or from eGFR values. Other medications (ACE inhibitors, NSAIDs, etc) were defined as at least two prescriptions 1 year prior to drug initiation.
Statistical methodsBaseline demographics were assessed using standardized mean differences (SMD). We carried out a new user comparator study26 to estimate the effect of metformin versus sulfonylureas. A new user design excludes prevalent cases to reduce immortal time and survivor biases. To account for confounding by indication, we used propensity scores (PS) and implemented inverse probability of treatment weighting (IPTW)27 to balance the baseline characteristics. To create the PS model, we included 33 variables specified previously. For BMI, smoking status, race and location, the missing indicator method was used to account for missingness.28 This method uses a dummy variable (which can have either a value of 0 or 1) in the statistical model for the PS to indicate whether the value for each variable is missing, with all missing values set to the same value. IPTW was created and trimmed at 20. We assessed balance between our groups using SMD with a difference of less than 0.1 (ie, 10%) indicating an acceptable balance between covariates, with metformin and sulfonylurea users after IPTW.29 Cox proportional hazards models were used with IPTW to estimate the risk of subsequent primary (all-cause dementia, PD) and secondary outcomes (AD, VD, MCI). Cox proportional hazards models are regression models that investigate the effect of several risk factors on survival, or the time it takes for a specific event to happen. The Cox model is expressed by the hazard function denoted by h(t). Briefly, the hazard function can be interpreted as the risk of an event at time t and is determined by a set of covariates (x1, x2, etc) and the baseline hazard (h0[t]) by the following equation: h(t)=h0(t)exp(b1x1+b2x2+…bnxn). The proportional hazards assumption was evaluated using Kaplan-Meier (KM) survival curves and a violation was considered if the survival curves for the different treatment groups crossed over at any point in follow-up. Where proportional hazards assumption was violated, analyses were repeated using piecewise Cox regression. Piecewise Cox regression can be used to estimate HRs at different time periods across follow-up when the HR changes over time. In the present study, where there was a violation of the proportional hazards assumption (based on KM survival curves), periods of follow-up were split where the survival curves crossed. Five negative control outcomes (impacted cerumen, tinnitus, cramp of limb, snoring and impingement syndrome of shoulder region)30 were used to identify residual confounding unaccounted for by IPTW.
We first carried out the analysis using the whole cohort and, secondly, split by age (cut-off 75 years) for primary outcomes (all-cause dementia, PD) and secondary outcomes (AD, VD, MCI) with and without adjustment for IPTW. In subanalyses, we compared the risk of outcome in patients with differing renal function, HbA1c levels and race. We dichotomized eGFR based on CKD staging into three groups (normal (eGFR>90 mL/min), moderate (eGFR=60–89 mL/min) and poor renal function (eGFR≤60 mL/min)), and HbA1c at baseline was dichotomized at 7%, reflecting diabetes treatment guidelines. We additionally carried out a variety of sensitivity analyses to test the robustness of our results. Since diagnosis codes for MCI might capture impairment but this impairment may not be severe enough to qualify as dementia, we carried out a sensitivity analysis by combining diagnostic codes from MCI and dementia. Although patients had been on monotherapy use for 2 years before follow-up there remained the potential for the impact of dementia or PD to influence medication use. Further sensitivity analysis involved excluding those with a dementia or PD diagnosis less than 1 year after follow-up to account for potential protopathic bias (ie, reverse causation). Finally, for the main analysis, we followed an intent-to-treat framework; therefore, we carried out an on-treatment analysis in which discontinued metformin or sulfonylurea use was censored.
ResultsParticipantsBetween 2006 and 2018, we identified 96 140 new users of metformin and 16 451 new users of sulfonylureas (n=112 591). A flow diagram showing how these numbers were obtained after inclusion and exclusion criteria is shown in figure 1.
 Figure 1
 Flow diagram sample population for this study after inclusion and exclusion criteria. eGFR, estimated glomerular filtration rate; HbA1c, hemoglobin A1c; PCOS, polycystic ovary syndrome; PD, Parkinson’s disease.
Characteristics of baseline populationFrom the study population, the mean age (±SD) was 66.4±8.2 years (metformin users mean age 65.7±7.83 and sulfonylureas mean age 71.0±8.71), 48% male, 83% Caucasian with a mean HbA1c of 6.79%±0.76%. In the sample population, 3207 patients developed any dementia (2256 among metformin and 951 sulfonylurea users) and 760 patients developed PD (625 among metformin and 135 sulfonylurea users). All-cause dementia rates were 7.77 and 17.73 per 1000 person-years in metformin and sulfonylurea users, respectively. PD rates were 2.13 and 2.45 per 1000 person-years in metformin and sulfonylurea users, respectively. Metformin users were younger, have better renal function, fewer comorbidities, and take different associated medications (NSAIDs, diuretics and glucocorticoids) compared with sulfonylurea users (table 1). For BMI, 26% of observations were missing (24% for metformin users and 33% for sulfonylurea users) and for eGFR 0.1% of observations were missing (0.08% for metformin users and 0.38% for sulfonylurea users).
Table 1Baseline characteristics of 112 591 patients over 50 years old with type 2 diabetes who were new users of either metformin or sulfonylureas between 2006 and 2018 before balancing of characteristics using inverse probability of treatment weighting (IPTW)
After IPTW, all variables were balanced between the two groups for the main analysis (SMD<0.1) (figure 2). For subanalyses (age, race, renal function, and HbA1c), all variables were balanced apart from the race subanalysis where the variable ‘HbA1c<7%’ was unbalanced for the race group ‘unknown/other’ (online supplemental figures S1–S11).
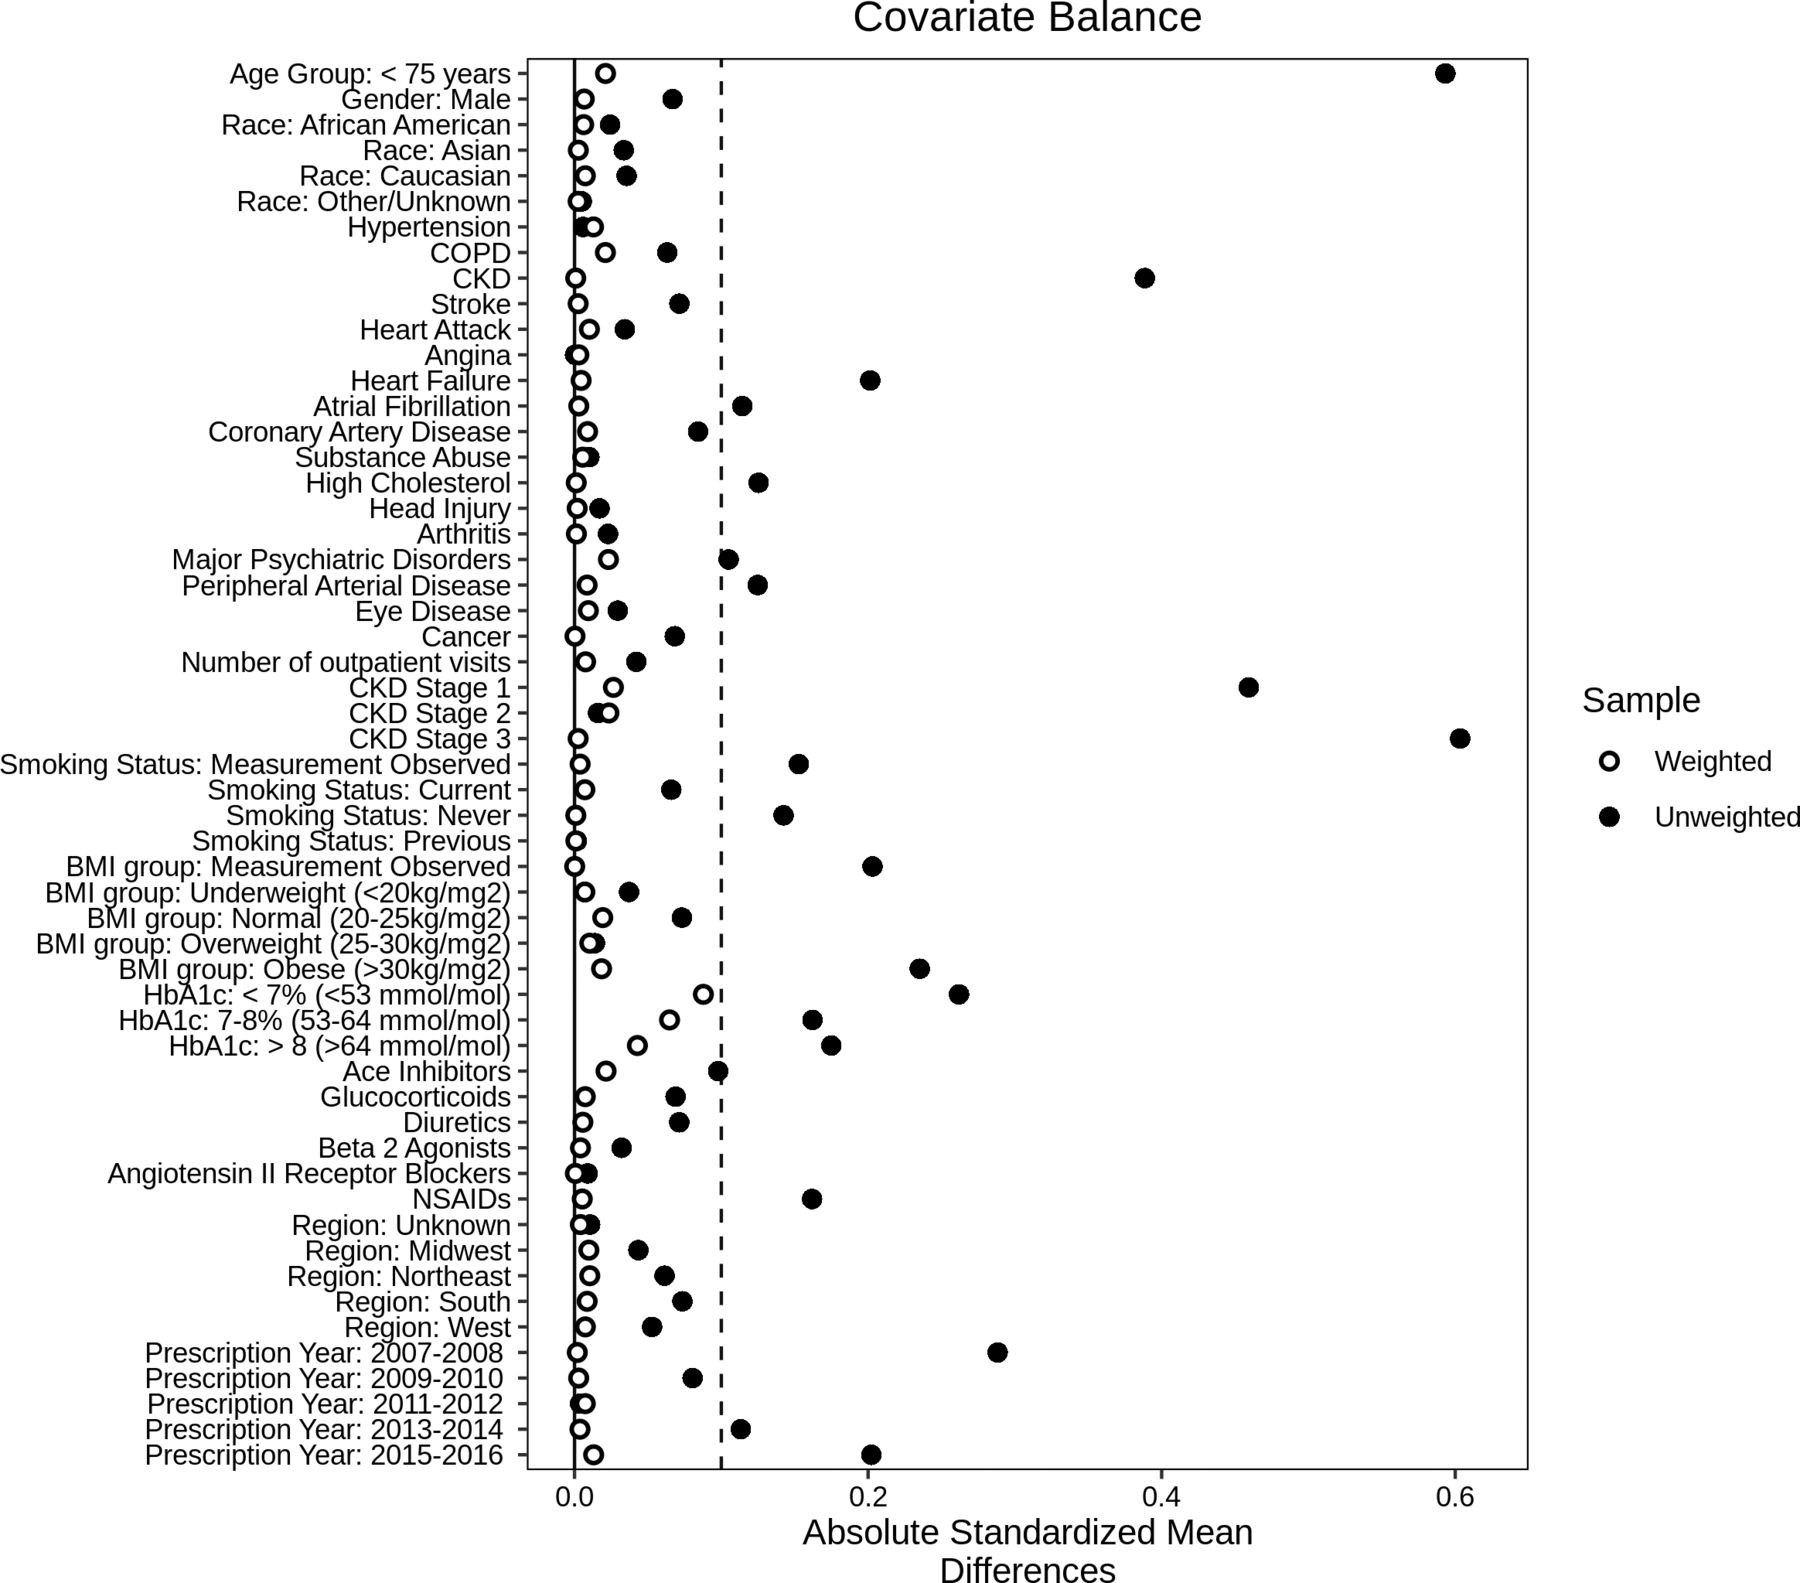 Figure 2
 Covariate balance between new users of metformin and sulfonylureas using absolute standardized mean differences (SMD) before (unweighted) and after inverse probability of treatment weighting (weighted) for whole cohort (n=112 591). Dotted line indicates SMD cut-off at 0.1 where >0.1 indicates difference in covariates between the metformin and sulfonylurea users. BMI, body mass index; CKD, chronic kidney disease; COPD, chronic obstructive pulmonary disease; HbA1c, hemoglobin A1c.
Association of new users of metformin versus sulfonylureas with all-cause dementia and PD riskFor primary outcomes, using Cox regression with IPTW, there was a lower risk of all-cause dementia (HR 0.80; 95% CI 0.73 to 0.88) when comparing metformin users with sulfonylurea users, but no difference when comparing risk of PD (HR 1.00; 95% CI 0.79 to 1.27) (figure 3). For secondary outcomes, there was a lower risk of AD (HR 0.81; 95% CI 0.70 to 0.94) but not for VD or MCI. However, for the direction of the effects on VD and MCI, the effects were consistent with lower risk for metformin users. We found that the associations were stronger in the younger ages (aged <75) for all-cause dementia and secondary outcomes and attenuated in older ages (≥75 years) (figure 3). There were fewer patients who started antidiabetic treatment after age 75 compared with before 75 (19% vs 81%, respectively) although average follow-up length was similar (3.04 vs 3.06 years). For PD, the older stratum showed an increased risk of PD for metformin users versus sulfonylurea users. All unadjusted HRs for all models can be found in the online supplemental table S4–S6.
 Figure 3
 Forest plot showing IPTW-weighted associations of primary and secondary outcomes with new users of metformin versus sulfonylureas in whole population (over 50) and stratified for patients above and below 75 years of age. IPTW, inverse probability of treatment weighting; MCI, mild cognitive impairment; PD, Parkinson’s disease.
Using KM survival curves, the proportional hazards assumption held for all-cause dementia, AD, MCI, and PD in figure 3 apart from VD where there was deviation of proportional hazards at around 2.5 years (online supplemental figure S12). Therefore, we repeated the analysis for the whole population using a piecewise Cox regression split at 2.5 years. The results showed only a lower HR for metformin users after 2.5 years (HR 0.64; 95% CI 0.45 to 0.89) (online supplemental table S7). For sensitivity analyses, changing to an on-treatment analysis further decreased HRs in favor of metformin for all-cause dementia (HR 0.76; 95% CI 0.68 to 0.84) (online supplemental table S8). Removal of patients who were diagnosed within 1 year of follow-up attenuated results for AD but did not change the results for other outcomes (online supplemental table S9). Combining the earliest dates from MCI and all-cause dementia diagnosis had little impact on results (HR 0.82; 95% CI 0.75 to 0.89). Adjusted HRs for the negative control outcomes were 1.04 (0.96–1.13) for impacted cerumen, 1.10 (0.95–1.30) for tinnitus, 1.01 (0.87–1.18) for cramp in limb, 1.06 (0.91–1.24) for snoring, and 1.16 (0.96–1.41) for shoulder impingement (online supplemental figure S13 and Table S10).
The influence of race, renal function, and glycemic control between new users of metformin versus sulfonylureas with dementia and PD riskIn subgroup analyses, we explored if our outcomes were influenced by renal function, glycemic control, or race (figure 4).
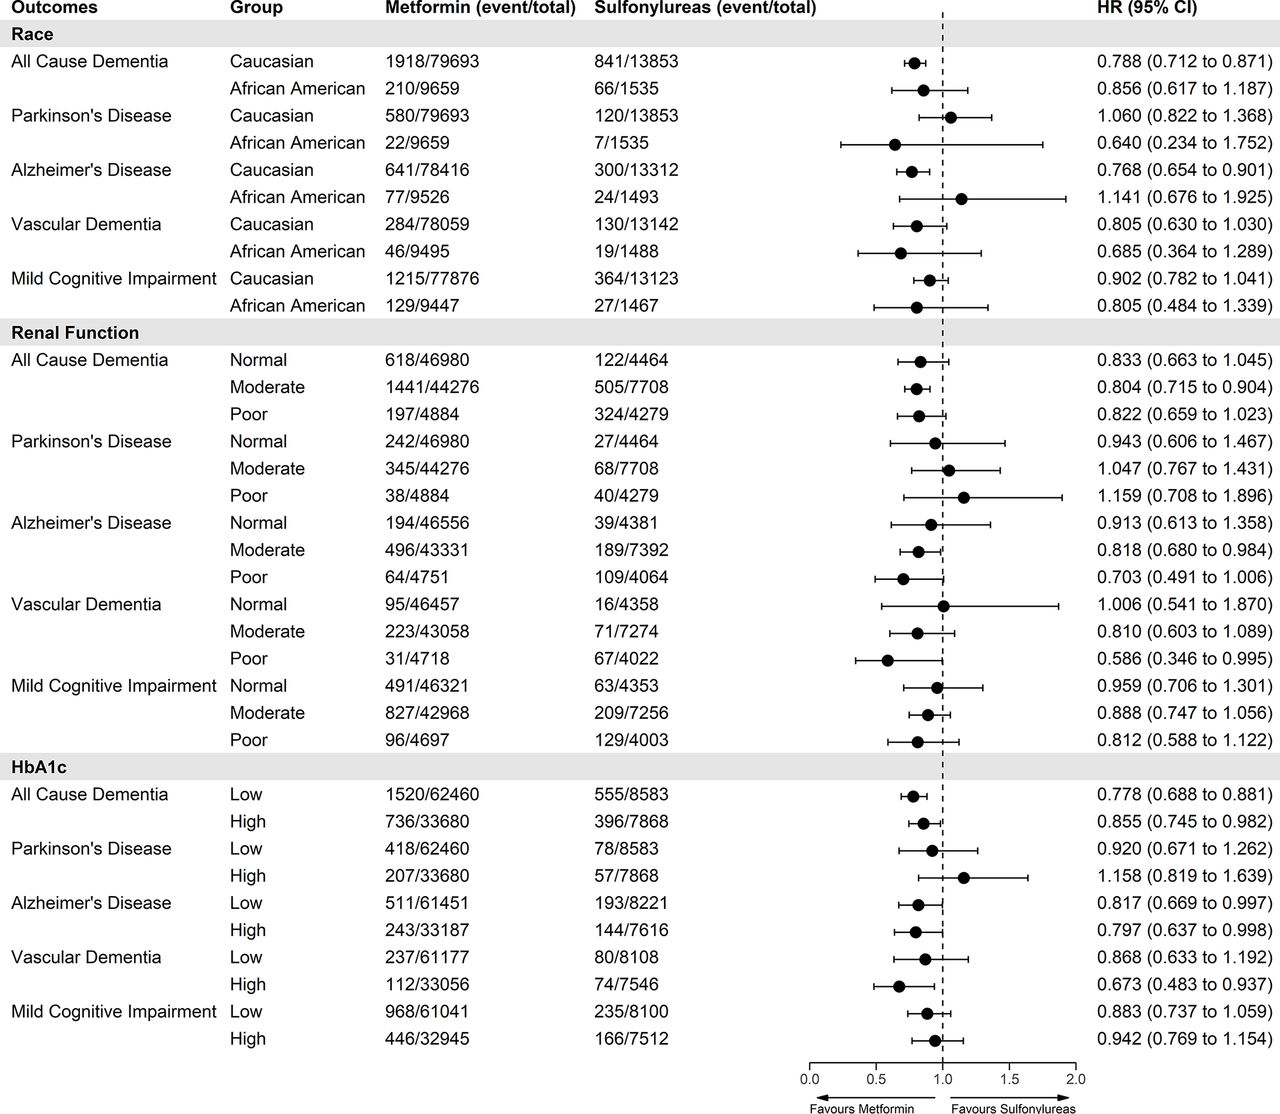 Figure 4
 Forest plot showing IPTW-weighted associations of primary and secondary outcomes with new users of metformin versus sulfonylureas stratified by race, baseline renal function and baseline HbA1c. Renal function levels were defined as normal (eGFR>90 mL/min), moderate (eGFR=60–89 mL/min) and poor (eGFR≤60 mL/min). HbA1c levels were defined as low <7% and high ≥7%. eGFR, estimated glomerular filtration rate; IPTW, inverse probability of treatment weighting.
In the race subgroup analysis, after IPTW adjustment, metformin users who were Caucasian (n=94 395) had a lower risk of all-cause dementia (HR 0.79; 95% CI 0.71 to 0.87), AD (HR 0.77; 95% CI 0.65 to 0.90) or in sensitivity analysis >2.5 years for VD (HR 0.64; 95% CI 0.44 to 0.94, online supplemental table S7). There were no differences for other outcomes compared with sulfonylurea users (figure 4). There were no differences in risk for other races; however, sample numbers were lower (African American 11 224, Asian 2735, and other/unknown 5156). In the renal function subgroup analysis, metformin users with moderate renal function were associated with lower all-cause dementia and AD but no differences in risk for PD for any renal function group (figure 4). For VD, metformin users had a lower HR after 2.5 years (HR 0.59; 95% CI 0.35 to 0.99) (online supplemental table S7). In the glycemic control subgroup analysis, stratifying on baseline HbA1c, metformin users with either low or high HbA1c levels were associated with a lower risk of all-cause dementia or AD but only HbA1c≥7% levels for VD (HR 0.67; 95% CI 0.48 to 0.94) which in sensitivity analysis showed risk was lower after 2.5 years (HR 0.57; 95% CI 0.35 to 0.93). Unadjusted HRs for all subgroup analyses in figure 4 can be found in the online supplemental table S6.
DiscussionIn this new user active comparator study of 112 591 patients with diabetes, we found new metformin users were associated with ~20% lower risk of all dementia, AD and VD compared with sulfonylurea users but there was no difference in PD risk or MCI. A lower risk of dementia in metformin users was also seen in subsets of patients who were younger (<75 years), Caucasian, and those with moderate renal function, but there were no differences in risk in subsets with different glycemic control. Our findings support the hypothesis that metformin may provide more neuroprotection for dementia than sulfonylureas but not for PD or MCI.
Our results agree with similar active comparator studies, which show a reduction in risk for all-cause dementia in new users of metformin, despite these studies using either smaller, older, or mainly male populations.15 16 31 A study using patients older than 65 years from the US Veterans Affairs (VA) database15 showed a lower risk of all-cause dementia in those younger than 75 years old for metformin users (HR 0.89; 95% CI 0.79 to 0.99; n=28 640) but not for AD or VD. However, a lack of precision in recording specific diagnosis of dementia, with difficulties in discriminating between AD and other causes, is leading to under-reporting of specific dementia diagnosis.32 This could explain why previous studies and our present study have not shown reduction of risk in dementia disease subtypes when stratifying on age.33 Our results and three other studies15 31 34 differ from other studies19 35 36 which report no association or increased risk of dementia in metformin users because these studies did not consider confounding by indication. Therefore, results obtained from these studies may reflect the differences between the characteristics of the antidiabetic drug users rather than true treatment effects. Despite these inconsistencies, a Mendelian randomization study has shown metformin reduces AD risk with the NDUFA2 gene and mitochondrial function proposed as potential mechanisms in dementia protection.37 For patients with VD, our results showed there was only a lower risk after 2.5 years of metformin treatment concurrent with a previous study21 which showed lower risk of dementia and AD after longer term use greater than 2 years in patients from the VA database (n=5528).
We did not find any association between metformin and MCI compared with sulfonylureas. MCI populations could contain a mixture of patients who do or do not convert to dementia. This heterogeneity may have reduced our power to detect any differences. However, a randomized controlled trial in patients with amnestic MCI indicated metformin users had better total recall after 12 months but not for other cognitive tests (Mini-mental state examination (MMSE), Alzheimer's Disease Assessment Scale-Cognitive Subscale (ADAS-cog)).38 Interestingly, this trial showed that those who were younger, on the highest dose, without APOE-ε4 and with lower HbA1c had the most benefit.
For PD, there are no active comparator studies which compare new users of metformin versus sulfonylureas-only direct comparator studies which compare drug use versus no drug use. One study using US veteran data showed those who took metformin >2 years had lower risk of PD (HR 0.30; 95% CI 0.18 to 0.85)21 compared with non-users. However, nearly 30% of non-metformin users were taking other antidiabetic medications. These results contradict a study using data from Taiwan which showed metformin users are at increased risk of PD (HR 2.27; 95% CI 1.68 to 3.07).19 Direct effect studies comparing drug use versus no drug use are prone to confounding by indication and immortal time bias making observational studies difficult to interpret and generalize. Despite inconsistent results of observational studies there is evidence from in vitro, non-clinical and genetic studies which highlight the potential neuroprotective benefits of metformin.10 39 40 In a Mendelian randomization study, greater genetically predicted expression level of NDUFAF2 in brain, the putative target of metformin, was shown to decrease the risk of PD.11 This means that although there was no difference in risk between metformin users and sulfonylurea users observed in our study, it remains possible that metformin could reduce the risk of PD compared with those not taking metformin or other antidiabetics.
Our age-specific findings are consistent with previous studies which indicate metformin may have more benefits for reducing dementia risk for those who initiate the treatment at a younger age.15 31 We also showed that there were, although smaller, benefits in those who were older than 75 years. Differences in study inclusion criteria, demographics and size of patient populations could explain this difference. Moreover, older patients have more comorbidities which contribute to dementia risk and hence attenuate any positive drug effects of metformin. We additionally showed that PD risk was higher in metformin users in those older than 75 years old which is consistent with a recent meta-analysis and systematic review (OR 1.66, 95% CI 1.14 to 2.42)18; however, our CIs were large and close to the null (HR 1.40; 95% CI 1.01 to 1.95) so caution must be taken with this result. In this study, we found baseline HbA1c levels did not modify the effect of metformin on dementia or PD risk which is also consistent with previous studies.15 34 This could indicate that metformin’s neuroprotective effect is unlikely to be due to better diabetic control but via other mechanisms.34 41
We did not see protective effects of metformin in different race groups apart from Caucasian patients which were the most represented group in our study (83%). These results are consistent with other studies,15 31 but are contradicted by one16 who showed that African American patients taking metformin were associated with a reduction in dementia risk and no reduction in risk in Caucasian patients. Differences in these results and ours might be explained by our eligibility criteria, which included 2 years of continuous metformin or sulfonylurea use. Our exclusion criteria may have removed patients from under-represented populations who may have a higher burden of diabetes-related complications and may escalate quicker from monotherapy metformin or sulfonylurea use limiting the generalizability of our results.42
For renal function, contradictory to a previous study,15 we found that metformin users with normal renal function did not have any difference in dementia or PD risk compared with sulfonylurea users. However, this study15 only categorized renal function into two categories (split by eGFR 60 mL/min) whereas we split renal function into three groups (normal eGFR>90 mL/min, moderate eGFR=60–89 mL/min and poor eGFR≤60 mL/min). Our results indicated that metformin users with poor renal function (eGFR≤60 mL/min) may have reduced dementia and AD risk. However, this group was much smaller potentially due to the contradictions of metformin in those with renal disease.
There are many strengths of this study. First, the large sample size allowed us to investigate the impact of all-cause dementia and specific causes of dementia, such as AD and VD. We used data from both genders unlike other studies which had >90% male populations.15 21 We carried out a new user active comparative cohort study design, with IPTW, nested within a population of patients with diabetes to reduce confounding by indication and other biases. We additionally tested five negative control outcomes which provided reassurance that no significant residual confounding remained after adjusting the mentioned covariates using IPTW methods.
Limitations of our study are as follows. First, although we addressed many sources of confounding, it is possible that some sources of confounding were unavailable or inadequately measured such as physical activity, education, and diet.4 43 Furthermore, we used data from OPTUM EHR from USA which could reduce the generalizability of our results due to potential differences in prescription patterns, comorbidities, incidence of diabetes and dementia in other countries.
Second, dementia and PD tend to be underdiagnosed and under-recorded,32 44 which may lead to measurement errors in our outcomes and would tend to lead associations towards the null. We used both diagnosis and prescription records to define our outcomes which could lead to misclassification due to the off-label use of certain medications.45 46 Third, we carried out an intention-to-treat analysis and did not include potential add-on drug treatments that occurred later or consider antidiabetic treatment switches. This may be a possible source of confounding and could result in a lack in generalizability. Fourth, for dementia and PD, there is a long prodromal and/or preclinical periods47 48 which may impact treatment choice and, although in our sensitivity analysis we removed those with a diagnosis less than 1 year from the start of follow-up, this might not be long enough to completely remove reverse causation biases. Finally, it has been shown that metformin reduces mortality in patients with diabetes,49 therefore the competing risk of death could affect our results and interpretation. A recent study34 jointly modeled the risk of dementia and death with metformin versus sulfonylureas and showed that the competing risk of death is highly dependent on the baseline mortality rate of the population.
留言 (0)