
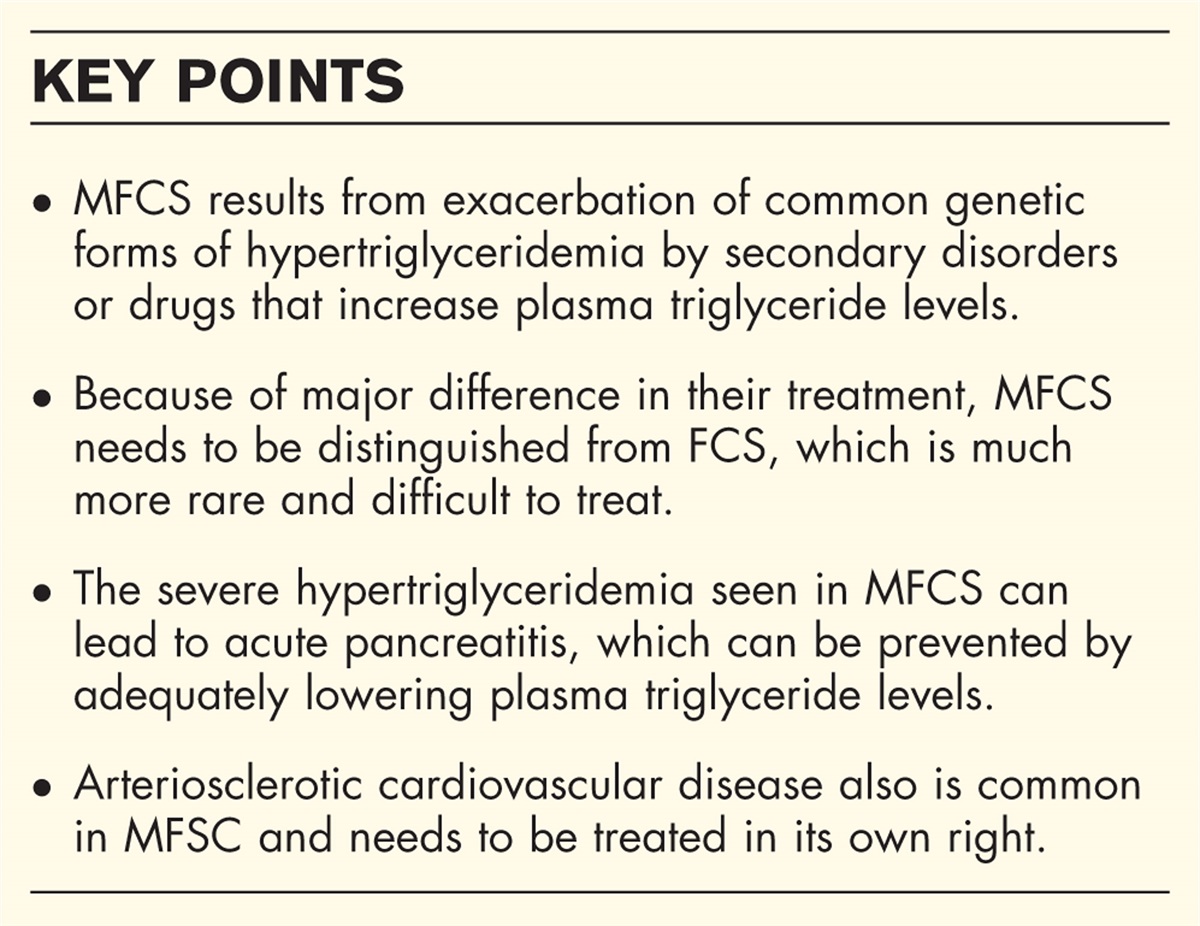
記住我


Common knowledge holds that saturated fat is the primary dietary driver of increases in low-density lipoprotein-cholesterol (LDL-C), including amongst those who consume low-carbohydrate ketogenic diets. However, there is contradictory evidence on whether carbohydrate restricted diets enriched in saturated fat increase LDL-C, with recent randomized controlled trials reporting substantial increases [1▪] and others reporting no increases, along with broad-spectrum improvements in other cardiovascular risk markers [2▪].
One source of heterogeneity in LDL-C response to carbohydrate restriction may be body mass index (BMI) and metabolic health. Recently published data from a cohort study of n = 548 individuals demonstrated inverse associations between BMI and LDL-C change, and between triglyceride (TG)-to-high-density lipoprotein-cholesterol (HDL-C) ratio and LDL-C change, following adoption of carbohydrate-restricted diets [3▪▪].
The Lipid Energy Model (LEM) provides a mechanistic explanation of these perhaps counterintuitive relationships [4▪▪]. Briefly, it postulates that the metabolic conditions created by carbohydrate restriction and subsequent hepatic glycogen depletion can, under the right circumstances, induce an increase in hepatic synthesis and export of TG-rich VLDL coupled with increased peripheral turnover and remodeling of these VLDL by lipoprotein lipase (LPL) in the periphery, generating the observed triad of high LDL-C and HDL-C with low TG (Supplemental Information: Lipid Energy Model, https://links.lww.com/COE/A34).
Although only recently present in the peer-reviewed literature, the LEM has been in development, and the topic of discussion and citizen scientist experimentations, for 6 years. Herein, we present data on one such experiment, performed with rigorous controls and in duplicate by co-author and model originator, DF, in which he consumed a ketogenic diet varying in three phases of caloric intake. Based on principals of the LEM but counter to common knowledge, it was hypothesized that higher caloric and higher saturated fat intake would reduce, rather than increase LDL-C. Additionally, we provide data collected from a group of 24 other citizen scientists who underwent similar hypo- and hyper-caloric ketogenic diet feeding protocols.
 Box 1:
 no caption available
METHODS Dietary interventionThe dietary intervention included 3 phases, each lasting 5 days: baseline (weight-maintenance), hypo-caloric, hyper-caloric. Dietary intake was consistently ketogenic in nature, although caloric intake was varied. The baseline phase included 2278 kcal/day with macronutrients 37 g protein (24%), 4 g carbohydrates (1%), 190 g of fat (75%); the hypo-caloric phase included 1135 kcal/day with macronutrients 68 g protein (24%), 2 g carbohydrates (1%), 95 g of fat (75%); and the hyper-caloric phase included 4116 kcal/day with macronutrients 235 g protein (23%), 24 g carbohydrates (2%), 342 g of fat (75%) (Table 1). Activity level was held at a constant of 6500–7900 steps per day, as measured by Apple iPhone pedometer, and a 10-h eating window and meal times were held consistent within 1 h each day. Further details on diet composition and daily routine are presented in Supplemental Information: Diet composition and living patterns, https://links.lww.com/COE/A34.
Table 1 - Daily caloric and macronutrient intake for the 3 dietary phases, along with major lipid and hormonal findings relevant to the Lipid Energy Model Maintenance Hypo-caloric Hyper-caloric V1 V2 V1 V2 V1 V2 Diet kcal 2278 2278 1135 1135 4116 4116 Fat, g (%) 190 (75%) 190 (75%) 95 (75%) 95 (75%) 342 (75%) 342 (75%) Saturated fat, g 85 85 42 42 174 174 Protein, g (%) 137 (24%) 137 (24%) 68 (24%) 68 (24%) 235 (23%) 235 (23%) Net Carb, g (%) 4 (1%) 4 (1%) 2 (1%) 2 (1%) 24 (2%) 24 (2%) Lipids Total chol. (mg/dl) 302 306 364 371 289 285 LDL-C (mg/dl) 222 225 279 285 191 198 ApoB (mg/dl) 141 159 184 185 132 140 HDL-C (mg/dl) 59 65 58 60 71 72 ApoA1 (mg/dl) 143 161 136 153 138 180 Triglycerides (mg/dl) 83 82 123 129 79 74 Hormones Insulin (μIU/ml) 5.1 5.7 2.5 2.9 16.3 17.8 Leptin (ng/ml) 6.8 6.5 3.6 4.2 14 13.3The first replicate of the experiment, version 1 (V1), was performed between April 7th and April 22nd, 2019 and V2 between August 31st and September 14th, 2020 (V2). Blood tests were drawn on the morning following each 5-day phase, as described in methods.
The above protocol was reproduced on two occasions, between April 7th and April 22nd, 2019 (V1) and between August 31st and September 14th, 2020 (V2). Body weight was 4.0 lbs greater at V1 vs. V2 (196 vs. 192 lbs, and BMI 24.5 vs. 24.0 kg/m2).
Blood testingWide spectrum blood tests from LabCorp were drawn on the mornings following each of the three phases. For all draws, DF was water-only fasted 12–14 h. Tests for each experiment included a lipid panel with nuclear magnetic resonance, apolipoprotein (Apo)A-1, apolipoprotein B (ApoB), non-esterified fatty acids (NEFA), lipoprotein (a) (Lp(a)), lipoprotein-associated phospholipase 2 activity, oxidatively modified low density lipoprotein, fructosamine, C-reactive protein (CRP), Complete blood count (CBC) and CMP, cortisol, full thyroid panel, ferritin, gamma-glutamyl transferase, glucagon, Glycoprotein acetylation (GlycA), HbA1c, IGF-1, insulin and C-peptide, leptin, testosterone, uric acid, vitamin B12 and folate, and 25-OH vitamin D (see Glossary for abbreviations). For V2, additional tests from Boston Heart were added, including adiponectin, cholesterol balance, fatty acid balance, HDL map, interleuken-6 (IL-6), oxidized phospholipids are found on ApoB-containing lipoproteins. Additionally, on a daily basis in a fasted state, body weight was measured on the same scale; blood glucose and beta-hydroxybutyrate were monitored by Keto-Mojo meter; and total cholesterol, LDL-C, HDL-C, and triglycerides were measured by CardioChek meter. A daily walk was taken on each day in the afternoon on a fixed route.
Citizen scientist case seriesVariations on the above protocol, in which persons adapted to carbohydrate restriction intentionally consumed hypo- and hyper-caloric ketogenic diets for 3–5 days each, in series, have been attempted by others. To demonstrate the main changes in LDL-C and HDL-C observed in the primary subject, DF, are generalizable beyond DF himself, individuals who were known to have previously attempted the protocol were solicited to provide lipid and dietary data for the purposes of publication as a case series. Only subjects who could provide dated and verifiable retrospective lab data (from Quest or LabCorp) were eligible. Written, informed consent was obtained from the participant for the publication.
RESULTS Lipid changes in the primary subject, DFAt baseline, the subject, DF, exhibited the high LDL-C, high HDL-C, low TG triad characteristic of many nonoverweight individuals who consume ketogenic diets [3▪▪]. Following the maintenance caloric intake feeding phase, levels of LDL-C, HDL-C, and TG were 222–225, 59–65, and 82–83 mg/dl, respectively. DF tested negative for familial hypercholesterolemia, and historic records reveal LDL-C consistently <130 mg/dl, with weight 207–210 lbs, from timepoints prior to adopting his current ketogenic lifestyle.
As displayed in Fig. 1 and Table 1, relative to postmaintenance intake lipid levels, 5 days of hypo-caloric feeding increased LDL-C to 279–285 mg/dl, and increased ApoB and TG. Conversely, the subsequent 5 days of hyper-caloric feeding decreased LDL-C and TG to below baseline levels, to 191–198 mg/dl for LDL-C and 74–79 mg/dl for TG, and increased HDL-C to 71–72 mg/dl, which was above baseline levels. Changes in ApoB and apolipoprotein A1 (ApoA1) ran with LDL-C and HDL-C, respectively.
 FIGURE 1:
 The dietary invention consistent of three phases, each lasting 5 days: weight maintenance, hypo-caloric, and hyper-caloric. In duplicate experiments, LDL-C and ApoB consistently increased with caloric restriction and decreased with overfeeding; HDL-C and ApoA1 increased with overfeeding; leptin and insulin decreased with caloric restriction and increased with overfeeding. Values for experiment version 2 (V2) are overlaid. ApoB, apolipoprotein B; LDL-C, low-density lipoprotein-cholesterol; HDL-C, high-density lipoprotein-cholesterol.
As compared to baseline levels, insulin and leptin both decreased following hypo-caloric feeding by 36–51% (to 2.5–2.9 μIU/ml for insulin and 3.6–4.2 ng/ml for leptin), then increased to levels 2 to 3-fold above baseline following hyper-caloric feeding (to 16.3–17.8 μIU/ml for insulin and 13.3–14 ng/ml for leptin).
Comprehensive data on 129 metabolic markers collected by LabCorp and Boston Heart, as well as daily lipids, glucose, and beta-hydroxybutyrate values collected by DF can be found in Supplemental Information: Comprehensive lab reports and Daily data, https://links.lww.com/COE/A33, respectively.
Citizen scientist case seriesIn the citizen scientist case series, hyper-caloric feeding relative to hypo-caloric feeding tended to decrease LDL-C. Figure 1, Supplemental Digital Content, https://links.lww.com/COE/A32 displays this ‘broken ladder’ pattern for LDL-C, in which increased caloric intake, along with increased saturated fat consumption, reduced LDL-C by a mean of 26 mg/dl across subjects, with 83% (20/24) of subjects exhibiting drops in LDL-C. Three of the four subjects who exhibited increases in LDL-C reported BMI in the class I-II obesity range (30–37.1 kg/m2), and the fourth did not have a BMI reported. Conversely, the three largest drops in LDL-C were observed in persons without obesity. The largest drop (−161 mg/dl, subject 15) was observed in an individual who transitioned from a multiday fast (0 kcal) to 3477 kcal/day; the second largest drop (−137 mg/dl, subject 16) was observed in an individual who transitioned from 1519 kcal to 5560 kcal/day (with additional calories primarily from heavy cream); the third largest drop was observed and in an individual consuming a carnivorous diet and who was lean, at 21.8 kg/m2. Individual participant lipid data are provided in Table 1, Supplemental Digital Content, https://links.lww.com/COE/A34.
DISCUSSION Lipid changes are consistent with the Lipid Energy ModelThe changes in LDL-C, ApoB, TG, HDL-C, ApoA1, insulin, and leptin were consistent between replications of the primary experiment performed by DF.
Framing these changes in the context of the LEM (review reference [4▪▪] for content), we here first focus on those induced by hypo-caloric feeding, the increase in LDL-C and TG. As a result of caloric restriction, there is a drop in insulin. This insulin drop would reduce hepatic LDL receptors to increase LDL-C and, for someone metabolically adapted to a carbohydrate restricted diet, would (along with an increase in ANGPTL4 activity [4▪▪,5]) reduce LPL activity at adipocytes, thereby reducing LPL-mediated VLDL-turnover, leading to increased TG. What's more, the decrease in LPL activity, while perhaps not dramatically changing HDL-C levels overall, would be expected to cause a shift towards a smaller lipid-poor HDL pool, which appears to have occurred in DF, as measured by Boston Heart HDL map in V2.
What about the changes observed following overfeeding, the drop in LDL and TG and increase in HDL-C? The logic would be largely the reverse of that stated above: overfeeding in an insulin-sensitive fat-adapted individual such as the subject, increases insulin, which should increase LDL receptor expression and upregulate adipocyte LPL activity. The former would reduce LDL-C levels and the latter would decrease TG, as TG from chylomicrons would be disposed of during the postprandial state and the persistently elevated insulin induced by overfeeding would contribute to continued LPL-mediated depletion of TG from VLDL in the fasted state. Finally, the increased LPL-mediated VLDL turnover would be predicted, per the LEM, to increase HDL-C, as was observed.
Admittedly, the mechanistic dynamics are certainly more complex than just posed, with several potentially competing factors or alternative explanations. For example, in the overfeeding phase, while insulin would increase LDL receptor expression and LDL particle uptake, increased LPL-mediated VLDL turnover could increase LDL particle generation commensurate with the increase in HDL-C; however, the former mechanism could have a larger effect size. Alternatively, and/or additionally, there could be a contribution of endocytosis by adipocytes of ApoB-containing particles to support the necessary membrane expansion that coincides with increased demand for fat storage.
Acute hyper-caloric overfeeding, with increased saturated fat intake, can decrease low-density lipoprotein-cholesterol among those habitually consuming carbohydrate-restricted dietsNevertheless, and setting aside mechanistic speculation as relates to the LEM, these data – both from the primary subject, DF, and the citizen scientist case series – clearly demonstrate a consistent divergence from the common knowledge prediction that dietary saturated fat consumption provides the dominant positive driving force increased in LDL-C and ApoB.
These data show that, among persons habitually consuming carbohydrate-restricted diets, increased overall caloric and saturated fat intake substantially decreased LDL-C and ApoB, along with other changes in cardiovascular risk markers that are generally considered to be positive (decreased TG, and increasing HDL-C and ApoA1). The obvious contradiction between the unhealthfulness of consuming a hyper-caloric, saturated-fat-rich, high-fat diet and these ‘positive’ changes in classic cardiovascular risk markers will hopefully provoke fruitful scientific discussion about how we interpret lipid biomarkers in the context of different dietary and lifestyle patterns.
Authors’ note on citizen scientists and public engagement in the scientific processA unique aspect of the history of this work is the degree of enthusiasm, engagement, and contribution of members of the lay public and hobby scientists to hypothesis-testing and scientific discourse. Certainly, dietary self-experimentation raises ethical questions and may well attract scrutiny and criticisms. However, provided interventions are relatively safe and present no immediate dangers to subjects, and subjects are informed and consented, then the engagement of laypersons in the scientific process – the so-called ‘citizen scientist’ movement – provides not only a supply of eager study recruits, but also helps achieve the loftiest of the aims of science: to disseminate knowledge and inspire curiosity.
Strengths and limitationsA major strength of this study is the degree of rigor with which the experiments were performed by the subject. Precise dietary composition was tracked and reported, and dietary intake among phases was varied primarily in portion size, while largely maintaining dietary composition and macronutrient ratios. Activity level and sleep were also tightly controlled, as were the conditions under which daily and per-phase labs were measured. Additionally, both replicates of the experiment were nearly identical and reasonably separated in time as technical duplicates, yielding largely consistent results. The series of labs drawn were comprehensive and are transparently reported in the supplement for open interpretation by others. Finally, while the experiment represents n = 1 data, we provide case series data from 24 individuals consistent with the main findings and predictions of the LEM. A limitation of this study is that it is an n = 1 experiment and, thus, the findings cannot be claimed to be broadly generalizable and may be influenced by genetic or environmental factors specific to the subject.
ConclusionData from this n = 1 experiment, performed in duplicate, demonstrate that acute overfeeding of a low-carbohydrate, high-fat diet rich in saturated fat can lower LDL-C and increase HDL-C. While this response is counter to the conventional perception that saturated fat is the primary driver of increases in LDL-C in the context of low-carbohydrate diets, it is consistent with the predictions of the recently proposed Lipid Energy Model. Further studies are needed to determine the generalizability of and mechanisms behind this response.
AcknowledgementsThe authors want to acknowledge the generosity of the citizen scientists who contributed data for the case series, as well as all of those who have contributed to the atmosphere of intellectual enthusiasm regarding the Lipid Energy Model and dietary and nutrition science more broadly.
Author contributions: D.F. designed the intervention and carried out the experimentation of his own person. S.H. collected the Keto-fest case series data. N.N. provided guidance on manuscript production, and all authors contributed substantially to the writing of the manuscript.
Ethics/informed consent: Written, informed consent was obtained from the participant for the publication of this case report.
Financial support and sponsorshipNo financial support or sponsorship was given for the production of this manuscript.
Conflicts of interestD.F. and S.H. are partner in Own Your Labs LLC but are not on the payroll and contribute all proceeds to the Citizen Science Foundation. N.N. is coauthor of a Mediterranean low-carbohydrate diet cookbook; he donates all royalty payments to nutrition research and education.
留言 (0)