
記住我
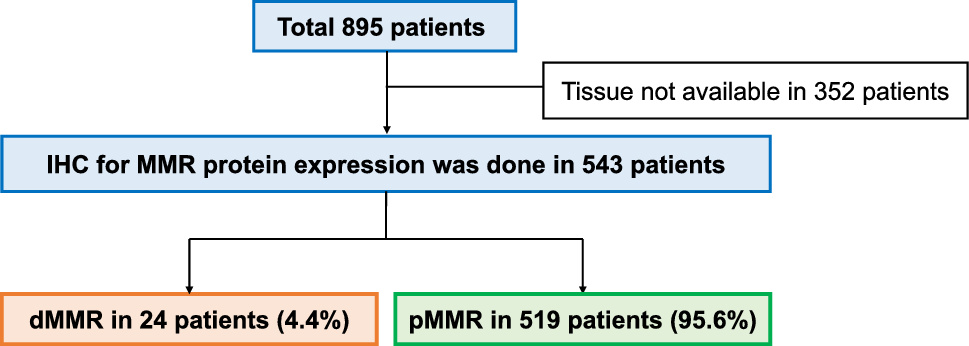
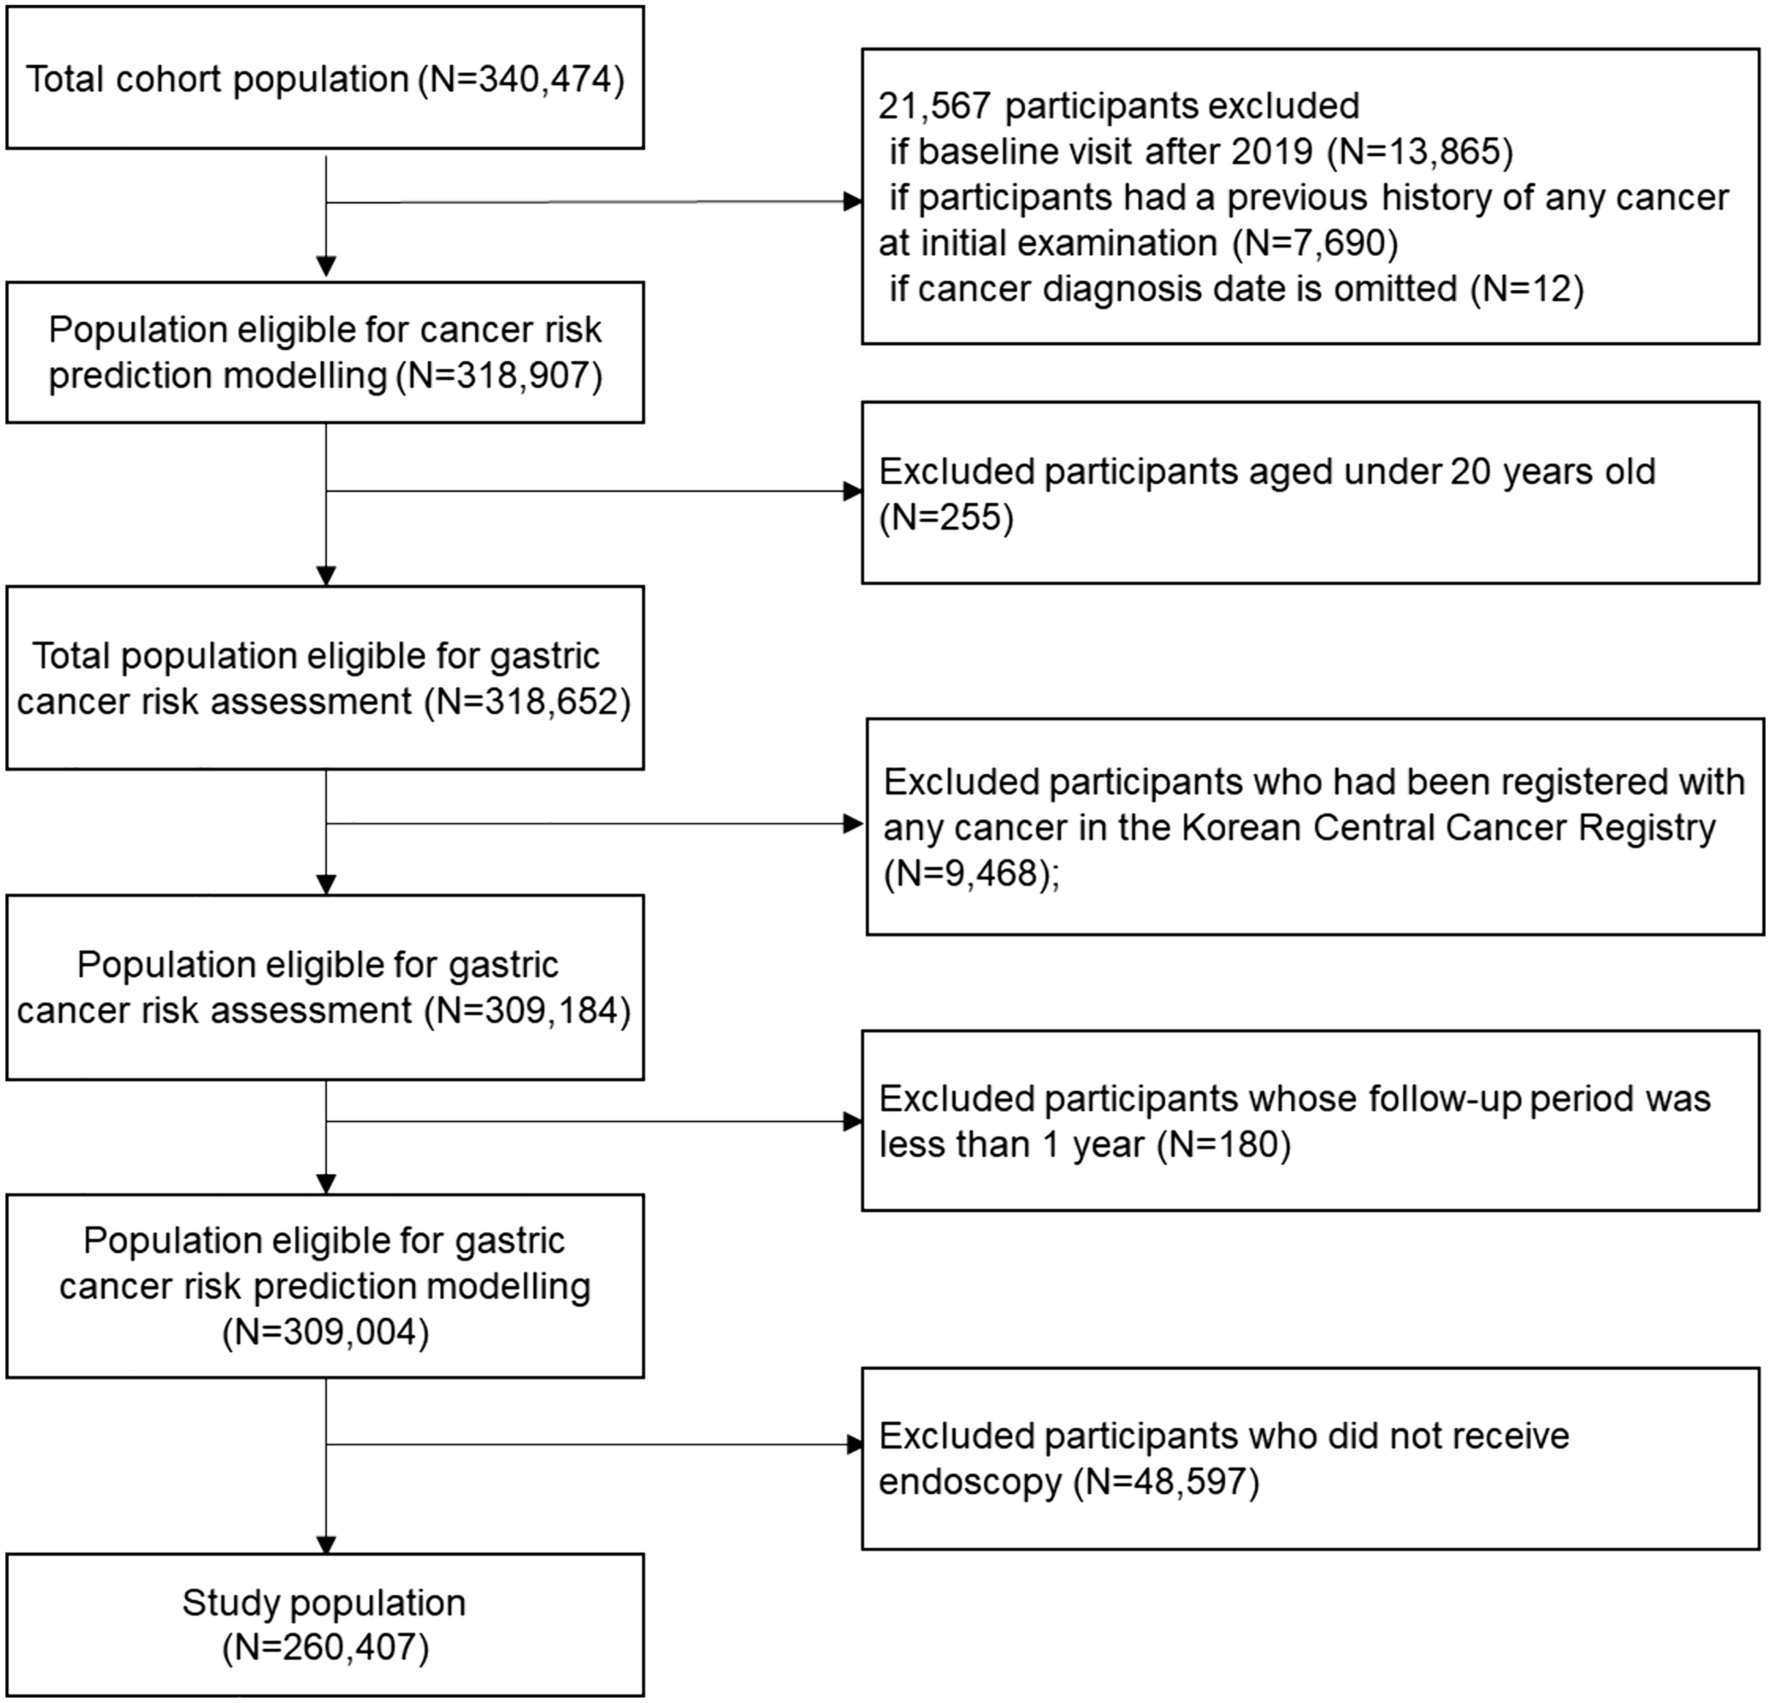


Between February 2015 and August 2018, 212 of 227 LOGICA-patients (93%) were included in this study (Fig. 2). Reasons for exclusion (n = 15) were histology different from adenocarcinoma (n = 2), no resection of primary tumor due to medically inoperable patients (n = 2) or T4b-/M1-stages (n = 10), and D1-lymphadenectomy (n = 1) before diagnosing intraoperative peritoneal metastases.
Fig. 2
Baseline and histopathological characteristics are summarized in Tables 1 and 2. Of the 212 patients, 120 (57%) were diagnosed with cT3-stage tumors. NAC was administered to 158 patients (75%), mostly the MAGIC-regimen or equivalent regimens (n = 120/158; 76%), FLOT-regimen (n = 29/158; 18%), or other regimens (n = 9; 6%). Total gastrectomy was performed in 90 patients (42%) and distal gastrectomy in 122 patients (58%). The median LN yield was 29 (IQR 21–39) per patient. In 120 patients (57%) LN metastases were detected, of whom 86 (72%) patients were treated with NAC.
Table 1 Baseline characteristicsTable 2 Histopathological resultsDistribution of lymph node metastasesDistribution of metastases per LN station is depicted for four patient subgroups based on tumor location, cT-stage, Lauren classification and NAC treatment (Fig. 3 and Supplementary Table 1), and for combinations of these subgroups (Table 3). LN metastases were detected in all individual resected stations (no. 1–9, 11, and 12a) for each tumor location (proximal, middle, and distal), for all cT-stages (cT1–4) and for both intestinal and diffuse tumors. LN stations 3 (23%), 4 (21%) and 6 (22%) were involved most frequently. Distal tumors were found in most cases (57%). For some patients (n = 16; 8%), LN stations were described grouped with one (n = 8) or multiple other stations (n = 8).
Fig. 3
Incidence of lymph node metastases per tumor location, cT-stage, Lauren classification and treatment with or without neoadjuvant chemotherapy. The exact numbers for all incidences of lymph node metastases in this figure are displayed in Supplementary Table 1, which contains the same information, but numeric
Table 3 The incidence (%) of lymph node metastases per nodal station for subgroupsTumor locationProximal tumors had more advanced tumor stages (cT3–4, 81%) than middle (66%) and distal tumors (61%). LN metastases were found most frequently for proximal tumors (63%), followed by distal (59%) and middle tumors (49%; p = 0,334). Overall (all LN stations analyzed combined, Table 4), tumor location did not predict developing LN metastases in multivariate analysis (p = 0,298). When assessing each LN station separately for all patients (Table 5), the tumor location was significantly related to location of LN metastases for proximal and distal tumors.
Table 4 Predictors of lymph node metastases (N0 versus N +) for the entire cohort (n = 212) and for only NAC-treated patients (n = 158), overall for all lymph node stations combinedTable 5 Predictors of lymph node metastases (N0 versus N +) for the entire cohort (n = 212), for each lymph node station separatelyProximal tumors metastasized predominantly to proximal LN stations, most frequently to stations 1, 2, and 7. Compared to proximal tumors, significantly less metastases were found for distal tumors in nodal stations 1, 2, and 7 (no. 1 [OR 0.31, p = 0,028], no. 2 [OR 0.05, p < 0,0005], and no. 7 [OR 0.27, p = 0,014]) and for middle tumors in stations 1 and 2 (no. 1 [OR 0.27, p = 0,031] and no. 2 [OR 0.18, p = 0,012]). LN metastases from proximal tumors also involved distal stations (no. 5 and 6; 4% and 11%) and remote LN stations (no. 8, 11 and 12a; 7%, 11% and 4%).
Mid-gastric tumors metastasized most frequently to station 3, but metastases were more equally distributed over the different LN stations than proximal and distal tumors. LN metastases from mid-gastric tumors also involved all stations (no. 1–9, 11 and 12a), regardless of the cT-stage.
Distal tumors metastasized predominantly to distal LN stations, most frequently to stations 5, 6, and 8 (no. 5 [OR 2.36, p = 0,422], no. 6 [OR 3.14, p = 0,080], and no. 8 [OR 3.25, p = 0,134]). Distal tumors also involved proximal LN stations (no. 1, 2 and 7; 11%, 2%, and 11%) and remote LN stations (no. 8, 11, and 12a; 19%, 8%, and 6%), also for cT1–2-tumors.
cT-stageThe highest incidence of LN metastases was found for cT4-tumors (72%) and cT3-tumors (58%). cT2-, cT3-, and cT4-stage tumors metastasized to all individual LN stations (no. 1–9, 11, and 12a). Of the 13 patients with cT1-stage, 11 patients (85%) had cN0-stage, but 4 patients (31%) showed histopathological LN metastases. Specifically, two patients (15%) with (distal) cT1N0-tumors showed metastases in remote station 12a. The distribution of LN metastases over the different stations was similar for cT1–2- versus cT3–4-tumors.
Overall (all LN stations analyzed combined), LN metastases were not significantly more often present for cT3–4- versus cT1–2-stage (59% versus 51%; OR 1.39, p = 0,259) in multivariate analysis (Table 4). When assessing each LN station separately for all patients (Table 5), cT3–4-tumors (versus cT1–2-stage) were a significant predictor for developing metastases in stations no. 1 (OR 3.48, p = 0,027) and 9 (OR 5.10, p = 0,033) in univariate analysis, but not in multivariate analysis.
In addition to clinical T-stage, pathological T-stage was assessed, showing similar distribution of LN metastases also after NAC (Supplementary Table 1). Stations 11 and 12a contained metastases for all (y)pT1–4-stages.
Histological subtypeDiffuse tumors showed increased incidences of LN metastases versus intestinal tumors in almost all LN stations for both cT1–2-stage (60% versus 48%) and cT3–4-stage (68% versus 54%) and for both patients with (61% versus 50%) and without NAC (82% versus 56%), but the metastatic distribution of involved nodal stations was comparable to the intestinal type.
Overall (all LN stations analyzed combined), LN metastases were found significantly more often for diffuse versus intestinal tumors (66% versus 52%; OR 1.78, p = 0,048) in univariate analysis (Table 4), but not in multivariate analysis (OR 1.73 [0.97–3.09], p = 0,063). When assessing each LN station separately for all patients (Table 5), diffuse tumors revealed higher risk at LN metastases than intestinal tumors for all individual stations, with significantly increased OR in LN stations 6–9 (no. 6 [OR 2.33, p = 0,014], no. 7 [OR 2.49 p = 0,018], no. 8 [OR 2.64, p = 0,017], and no. 9 [OR 4.77, p = 0,005]).
NAC treatmentLN metastases were detected more often in almost all stations for patients without NAC compared to patients treated with NAC (63% versus 54%; p = 0,275), especially for cT3–4-stage tumors (Table and Fig. 3). However, all LN stations (no. 1–9, 11 and 12a) showed metastases, and the distribution of LN metastases over the different stations was similar for patients with and without NAC.
The sensitivity analysis revealed a similar pattern of LN metastases in patients treated with NAC (n = 158/212, 75%) compared to the entire cohort (Supplementary Table 2).
Skip-metastasesFourteen patients (7%) demonstrated skip-metastases involving remote stations only (Supplementary Table 3). Stations 7 (3%) and 8 (4%) most frequently showed skip-metastases. A solitary skip-metastasis was found in station 7 (n = 4), 8 (n = 2), 11 (n = 1), and 12 (n = 1). Most of these 14 patients had cT3–4- and/or cN+-stages (n = 13, 93%) and distal tumors (n = 9, 64%).
Histopathological response to NACA complete response in primary tumors was achieved in 14 out of 158 patients treated with NAC (9%), whereas 18 patients (11%) noted complete regression in LN metastases (Table 2). Compared to the entire cohort (n = 212), these 18 patients demonstrated similar metastatic incidences in LN stations 11 (12% versus 13%) and 12a (6% versus 6%). The histopathological response rates did not differ significantly for the intestinal versus diffuse type in primary tumors (p = 0,678) nor in lymph nodes (p = 0,449) (Supplementary Table 4). No regression at all was found in lymph nodes for 132 patients (84%) and the primary tumor for 42 patients (27%).
Greater omentumThe greater omentum harbored LNs in 39 patients (18%), and only 1/212 patients (0.5%) showed LN metastases (Table 2). This patient had a distal cT3-tumor (diffuse type) with 4 LN metastases located in the upper left quadrant. Another 5 patients (2%) exhibited tumor deposits in the greater omentum, located in multiple quadrants. These 5 patients had cT3- (n = 4) and cT4-tumors (n = 1) of the intestinal (n = 2) and diffuse (n = 3) type, located in the proximal (n = 1), middle (n = 1) and distal (n = 3) stomach.
留言 (0)