
記住我


The efficacy and clinical utility of gadolinium-based contrast agents (GBCAs) in contrast-enhanced magnetic resonance imaging (CE-MRI) has been established for decades. With more than 620 million procedures worldwide using GBCAs performed to date and with approximately 30 million procedures annually, CE-MRI is an established, valuable diagnostic tool.1 Contrast-enhanced MRI has crucial benefits for disease management and provides major advances in neurological, cardiac, breast, abdominal, musculoskeletal, and vascular imaging. Paramagnetic gadolinium (Gd3+) is the most effective option for signal enhancement in MRI as it has the maximum number of unpaired electrons (7) of any stable ion. This leads to an effective shortening of proton relaxation times and a strong increase in signal intensity (SI) in T1-weighted MRI.2 For contrast agents used in MRI, the highly effective Gd3+ ion is tightly bound to high-affinity ligands. These ligands can be chemically divided into 2 different classes: linear and macrocyclic chelates. In general, linear GBCAs have a higher propensity to release Gd3+ in vivo.3,4 In 2006, nephrogenic systemic fibrosis, a rare but serious disorder, was first associated with the use of linear GBCAs in patients with severe renal impairment.5 Since then, there has been a shift from linear to macrocyclic contrast agents that were mainly driven by their much higher in vivo complex stability and by regulatory label restrictions in particular for linear multipurpose contrast agents.6,7 Since 2014, several publications of numerous retrospective studies on patients with primary brain tumors or other central nervous system (CNS) pathologies have been published. They have reported on increased SI in the dentate nucleus and globus pallidus on unenhanced T1-weighted MRIs after multiple applications of primarily linear GBCAs and repeated CE-MRIs8–11 and triggered an ongoing and thorough evaluation of the clinical use of GBCAs along with further regulatory activities (Art 31 procedure in the EU). Based on the ongoing discussion regarding Gd presence in the brain and other body tissues, there is an increasing request to reduce the GBCA dose without compromising the image quality and diagnostic outcome.12–14 In this context, Runge et al15 were advocating the development of next-generation high relaxivity Gd chelates for clinical MRI. The development of such next-generation agents with a substantial improvement in relaxivity, that is, a 2-fold increase in comparison to current GBCAs available on the market, could offer the potential of dose reduction or lead to improved lesion enhancement, characterization, diagnosis, and clinical efficacy.15
The purpose of this report is to characterize gadoquatrane, a newly designed tetrameric GBCA exhibiting high relaxivity in combination with high macrocyclic complex stability. The manuscript summarizes the preclinical profile of gadoquatrane including the key physicochemical parameters, the complex stability under physiological conditions, and its pharmacokinetic (PK) profile. In addition, we describe the first evaluation of gadoquatrane in a preclinical rat glioblastoma model to assess the potential of increasing the image signal and contrast or substantially lowering the Gd dose in CE-MRI.
MATERIALS AND METHODS Contrast AgentsGadoquatrane (BAY 1747846) is a macrocyclic GBCA (mGBCA) and was synthesized according to WO2016193190: tetragadolinium [4,10-bis(carboxylatomethyl)-7-amino)acetyl]-amino}methyl)-4,7,11,14-tetraazahepta-decan-2-yl}-1,4,7,10-tetraazacyclododecan-1-yl]acetate (Fig. 1). Aqueous formulations (0.075 mmol gadoquatrane corresponding to 0.3 mol Gd/L, pH 7.4, 10 mM TRIS buffer) were prepared for physicochemical, in vitro and in vivo studies. For in vivo studies, formulations were diluted with saline to reach adequate application volumes. The following established GBCAs were investigated for comparison: the linear gadodiamide (Omniscan; GE Healthcare Buchler GmbH & Co. KG, Braunschweig, Germany), gadopentetate dimeglumine (Magnevist; Bayer Vital GmbH, Leverkusen, Germany), the macrocyclic gadobutrol (Gadovist; Bayer Vital GmbH, Leverkusen, Germany), and gadoterate meglumine (Dotarem; Guerbet GmbH, Sulzbach, Germany).
 FIGURE 1:
 Chemical structure of tetrameric gadoquatrane (BAY 1747846).
SolubilityThe solubility was determined at room temperature (20°C) in buffer solution (10 mM Tris-HCl, pH 7.4). The Gd concentration in the clear supernatant solution was measured by ICP-MS after 24 hours.
Partition Coefficient (logP)The partition coefficient P was determined for 2 batches of gadoquatrane. A buffered aqueous solution of gadoquatrane (10 μM in 5 mM Tris-HCl, pH 7.4) was mixed with 1-butanol (50/50 vol%), and the mixture was shaken for 2 hours at room temperature. The Gd concentrations in both phases were measured by inductively coupled plasma mass spectrometry (ICP-MS; 7500a; Agilent, Waldbronn, Germany).
OsmolalityThe osmolality was determined in triplicate using 10 μL samples of the formulation (Vapro Osmometer 5520; Wescor, Logan). The instrument was calibrated using osmolality standards with 100, 290, and 1000 mosmol/kg (Opti-Mole; Wescor, Logan).
ViscosityThe viscosity was measured in triplicate using a rolling ball viscometer (Lovis 2000M, Anton Paar, Ostfildern, Germany). The measuring tube was controlled at 37°C. The instrument was calibrated with a standard solution with a viscosity of 5.1 mPa·s (Haake Test Fluid E7; Karlsruhe, Germany).
Relaxivity Measurements at 1.41 TMeasurements of the relaxation times were performed using a MiniSpec mq60 NMR spectrometer (Bruker BioSpin GmbH, Ettlingen, Germany) operating at 60 MHz (1.41 T) and a temperature of 37°C. The T1 relaxation times were determined spectroscopically using the standard inversion recovery method with a flip angle of 90 degrees and a fixed relaxation delay of at least 5 × T1. In total, 8 different inversion times (TIs) were used, and each series was repeated 4 times. Three different concentrations of gadoquatrane (0.25, 0.5, and 0.75 mmol Gd/L) were prepared in pure water and in human plasma, and the exact Gd concentrations in the sample were determined by inductively coupled plasma optical emission spectrometry (Thermo iCap7600; Thermo Scientific, Dreieich, Germany). The T1 time was calculated by the instrument software. The longitudinal relaxivity (r1-relaxivity) was calculated from the slope of the linear regression obtained by plotting the T1 relaxation rates (R1, unit 1/s) versus the Gd concentration (r1-relaxivity per Gd). The r1-relaxivity data were evaluated for 6 synthesized batches and reported as mean values ± standard deviation (SD).
Relaxivity Measurements at 3.0 TMeasurements at 3.0 T were performed in a whole-body MRI scanner (Philips Intera) using a knee-coil (SENSE-Knee-8; Philips Healthcare) at 37°C. The T1 times were determined by imaging a series of samples simultaneously, using a series of 12 inversion recovery spin echo sequences with the shortest possible echo time of 7.46 milliseconds, a series of TI ranging from 50 to 4500 milliseconds, and a repetition time of 3400 milliseconds + TI. The flip angle was 90 degrees. The SIs of 3 different concentrations (0.25, 0.5, and 0.75 mmol Gd/L) of gadoquatrane were measured by placing a region of interest (ROI) in the homogenous center of the samples. All SIs (12 SIs) were plotted against the respective TIs, and a fitting routine was used to calculate the T1 times. The exact Gd concentrations of all samples and the r1-relaxivity were obtained in the same way as described for 1.41 T.
Nuclear Magnetic Relaxation Dispersion ProfilesProton nuclear magnetic relaxation dispersion (NMRD) profiles were determined using equipment of the EPFL (Swiss Federal Institute of Technology in Lausanne). The T1 times were measured at the Larmor frequencies 20, 30, 40, 60, 100, and 200 MHz at 37°C (Bruker MiniSec mq20, mq30, mq40, and mq60 and Bruker Advance with 2.35 T and 4.7 T cryomagnet). Measurements were performed in 600 μL samples of 1 mM Gd concentrations. Gd concentrations were determined by inductively coupled plasma optical emission spectrometry. Proton NMRD curves were fitted using data processing software from EPFL using standard Solomon-Bloembergen-Morgan theory. The NMRD profiles of gadoquatrane were fitted using 2 correlation times following the approach of Lipari and Szabo.16
Complex Stability Under Physiological ConditionsThe method used to determine complex stabilities of Gd complexes in human serum is described elsewhere.4 The serum, pooled from 6 healthy human donors, was spiked with the test substances to obtain a final concentration of 0.025 mmol/L BAY 1747846 (0.1 mmol Gd/L). To prevent microbial growth during the incubation, NaN3 was added (final concentration, 2 mmol/L). The assay mixtures were stored in covered vials in an incubator at 37°C under 5% CO2 to maintain the physiological pH level. Aliquots were removed for ion exchange chromatography (HiTrap Chelating Sepharose, GE Healthcare Bioscience AB) and Gd analysis before the start of the incubation and on days 2, 7, 14, and 21 of the incubation. The amount of released Gd relative to the intact Gd complex was analyzed via LC-ICP-MS (158Gd) and plotted versus the incubation time.
Protein Binding and Blood-to-Plasma Partition RatioThe protein binding in rat and human plasma was investigated in vitro by using equilibrium dialysis in reusable 96-well Micro-Equilibrium Dialysis Devices (HT Dialysis).17 Equilibrium dialysis was performed at 3 μmol Gd/L concentration. Samples were incubated at 37°C for 2 hours. After incubation, the Gd concentration in each half cell compartment was measured by ICP-MS. The blood-to-plasma ratio was determined using fresh blood from 6 healthy human donors (CRS Clinical Research Services Berlin GmbH; heparin whole blood, n = 3 male and n = 3 female, 18–65 years). Blood samples (Sarstedt S-Monovette Lithium heparin, n = 3 aliquots per donor) were incubated with gadoquatrane (0.0625 mmol/L corresponding to 0.25 mmol Gd/L) in vitro for 60 minutes at 37°C (MiniTherm CTT incubator, Heraeus; S-Monovettes were gently rotated during incubation). After incubation, plasma was obtained by centrifugation at 2000 g for 10 minutes at 24°C (Eppendorf Centrifuge 5810R). The Gd concentrations of blood and plasma were measured in triplicates by ICP-MS.
Pharmacokinetics of Gadoquatrane in RatsThe blood kinetics of gadoquatrane were investigated after single intravenous (IV) injection in male Han Wistar rats (Charles River, Sulzfeld, Germany). A PE50 catheter (Intramedic PE50 Tubing, BD) was implanted in the left carotid artery under anesthesia (O2: 0.5 L/min, N2O: 1 L/min, isoflurane: 4%). The catheter was guided through the skin of the neck, and the animals were allowed to recover from the procedure for approximately 45 minutes. The formulations of gadoquatrane and gadobutrol were diluted separately with saline to a final concentration of 50 mmol Gd/L. The compounds were administered as a bolus of 0.1 mmol Gd/kg bw (2 mL/kg) into the tail vein of the conscious rats (n = 3/compound, body weight [bw]: 225–289 g). Blood (~0.2 mL/time point) was sampled at 1, 3, 5, 10, 15, 30, 60, 90, 120, 240, 360, and 480 minutes postadministration. The withdrawn blood volume was replaced, and the catheter was flushed by saline containing 10 IU/mL heparin. The final blood sample was obtained 1440 minutes (24 hours) post administration under anesthesia. All blood samples were stored at +4°C until analysis. Gd concentrations in the obtained blood samples were determined by ICP-MS. The blood (Gd) concentrations were obtained from the mean of the triplicate measurements and were converted into plasma concentrations using a blood-to-plasma ratio for the rat of 0.625. The PK parameters were calculated from the plasma concentration-time profiles by a 3-compartment PK model (Phoenix WinNonlin5) and are given as mean estimate ± SD (CV%).
Elimination and Organ Distribution in RatsBiodistribution and total elimination 7 days after single IV injection were investigated in healthy Han Wistar rats (Charles River, Sulzfeld, Germany). Gadoquatrane was compared with gadobutrol using 3 animals per group. Both formulations were diluted separately with saline to a final concentration of 50 mmol Gd/L. The compounds were administered as a bolus of 0.1 mmol Gd/kg bw (2 mL/kg) into the tail vein of the conscious rats. During the first 6 hours of the study, the animals were kept individually in metabolic glass cages allowing separate collection of urine and feces samples. Between 6 hours and 5 days, the animals were kept in individual metabolic cages, which also allowed the separate collection of feces and urine but provided more space. Between 5 and 7 days, no excreta were collected, and the animals were kept together in groups. The animals were killed 7 days postadministration under anesthesia by exsanguination, and the following organs were excised: blood, liver, kidney, spleen, heart, lung, brain, mesenterial lymph nodes, stomach and intestine (empty, the content was added to the carcass), muscle, skin, bone (femur), bone marrow, and the remaining carcass including most of the bones, muscles, and skin. All organ samples were stored at +4°C until analysis. Feces samples and carcasses were first frozen at −80°C, then freeze dried and ground to a fine powder using a knife mill (Grindomix GM 200; Retsch GmbH, Hann, Germany) and an ultracentrifugal mill (Mill ZM 200, Retsch GmbH, Hann, Germany) afterward. In case that Gd concentrations of the probes were less than the lower limit of quantification (LLOQ), the LLOQ of 0.05°nmol/g was used for mean value calculation.
Preliminary Evaluation of MetabolismCryopreserved human (male, single donor, BioIVT, United Kingdom) and rat (Han Wistar, male pool, Lonza, Germany) hepatocyte suspensions (1.0E+06 cells/mL) were incubated for 4 hours at room temperature with gadoquatrane at a final concentration of 2.5 μmol/L (10 μmol Gd/L).18,19 Aliquots before and after incubation were analyzed using LC-MS. Urine samples recovered among 0–1 hour, 1–2 hours, 2–3 hours, and 3–6 hours after single IV injection (0.1 mmol Gd/kg bw) were analyzed using HPLC-ICP-MS (HPLC Waters 2695 Alliance, ICP: Agilent 7500a, 1 mL/min, A: 100 mM ammonium acetate, pH 6.8, B: acetonitrile, 0–8 minutes 90% A and 10% B to 65% A and 35% B, 8–10 minutes 5% A and 95% B).
ICP-MS MeasurementsThe Gd concentrations in blood, organs, and tissues were determined using ICP-MS (7500a; Agilent, Waldbronn, Germany) after appropriate sample preparation. Gadolinium concentration aliquots (n = 3) 10–20 μL or 10–20 mg from each fraction were solubilized by pressurized digestion in 50 μL concentrated nitric acid (65%) and 30 μL hydrogen peroxide at 120°C. Terbium (ICP Standard Tb[NO3]3; Alfa Aesar, USA) was added as internal standard to obtain 5 nmol/L final concentration. Depending on the expected concentration, probes were diluted with 1% nitric acid containing 0.01% Triton X-100 until the calibrated range of the ICP-MS was reached. The ICP-MS instrument was calibrated with commercial standards of known concentrations of Gd(NO3)3 (0, 1, 10, 100, and 1000 nmol Gd/L, Alfa Aesar, USA) and Tb(NO3)3 (5 nmol Tb/L, Alfa Aesar, USA). The quantification range of the method was 0.1 to 1000 nmol Gd/L in solutions.
MRI of GS9L (Rat Glioblastoma) Brain Tumors in RatsContrast-enhanced MRI of brain tumors was investigated in male Fisher rats (Fisher F344; Charles River, Sulzfeld, Germany) using an established rat GS9L glioblastoma model.20 The GS9L cell line was grown in Dulbecco's Modified Eagle Medium (DMEM + 4.5 g/L d-glucose + pyruvate, GlutaMAX; Gibco) supplemented with 10% fetal bovine serum and 1% penicillin-streptomycin (10.000 units/mL). For orthotopic intracerebral implantation, anesthetized animals were fixed in a stereotactic frame, and the cells (1.0E+06 GS9L/5 μL) were injected slowly into the right hemisphere of the cerebrum using a Hamilton syringe. The tumor cell inoculation was done under general anesthesia (2:1 mixture of ketamine [Ketavet, 100 mg/mL; Medistar GmbH, Holzwickede, Germany] and xylazine [Rompun, 20 mg/mL; Bayer Vital, Leverkusen, Germany] 1 mL/kg bw intraperitoneal injection). One week after cell inoculation, the animals underwent MRI to confirm the presence of the tumor (n = 6 per group). The CE-MRIs were performed in 2 animal cohorts (2 animals of the first cohorts showed no tumor and were excluded). In the first study (n = 4), the animals received gadobutrol and gadoquatrane in a random order at the same (Gd) dose (0.1 mmol Gd/kg bw, with 60 minutes in between administrations). In a second animal cohort (n = 6), 0.1 mmol Gd/kg bw gadoterate meglumine and 0.025 mmol Gd/kg bw gadoquatrane (corresponding to 0.00625 mmol/kg per molecule) were evaluated. The MRI study was performed using a clinical 1.5 T scanner (Magnetom Avanto; Siemens, Erlangen, Germany) equipped with a rat head coil (Rapid Biomedical GmbH, Rimpar, Germany). The rats were anesthetized using a mixture of isoflurane (2.25%), oxygen gas (0.5 L/min), and nitrous oxide (flow 1 L/min). The MRI procedure started with a standard localizer scan in sagittal, coronal, and axial direction. Based on these images, the 3D imaging block was positioned to cover the cerebrum in axial direction (3D turbo spin echo, repetition time of 500 milliseconds, echo time of 19 milliseconds, 32 × 80 mm field of view, 12 slices at 1 mm, scan time of 4:18 minutes). The analysis of the SI in dedicated ROIs was performed on the MR scanner console. Regions of interest were manually placed around the tumor (SItumor) and in the surrounding healthy (normal appearing) brain tissue (SIbrain). One additional ROI was placed in air in the lower right corner to estimate the SI noise level (SIair). The ROI analysis was done in the 5 minutes postcontrast images in 1 or 2 slices depending on the tumor size. The contrast-to-noise ratio (CNR) between tumor and brain was calculated: CNR = (SItumor − SIbrain)/SIair. The CNRs were calculated for both animal cohorts (intraindividual comparison [1] cohort: n = 4, of gadoquatrane and gadobutrol at 0.1 mmol Gd/kg bw; and [2] cohort: n = 6 gadoquatrane at 0.025 mmol Gd/kg bw and gadoterate meglumine at 0.1 mmol Gd/L).
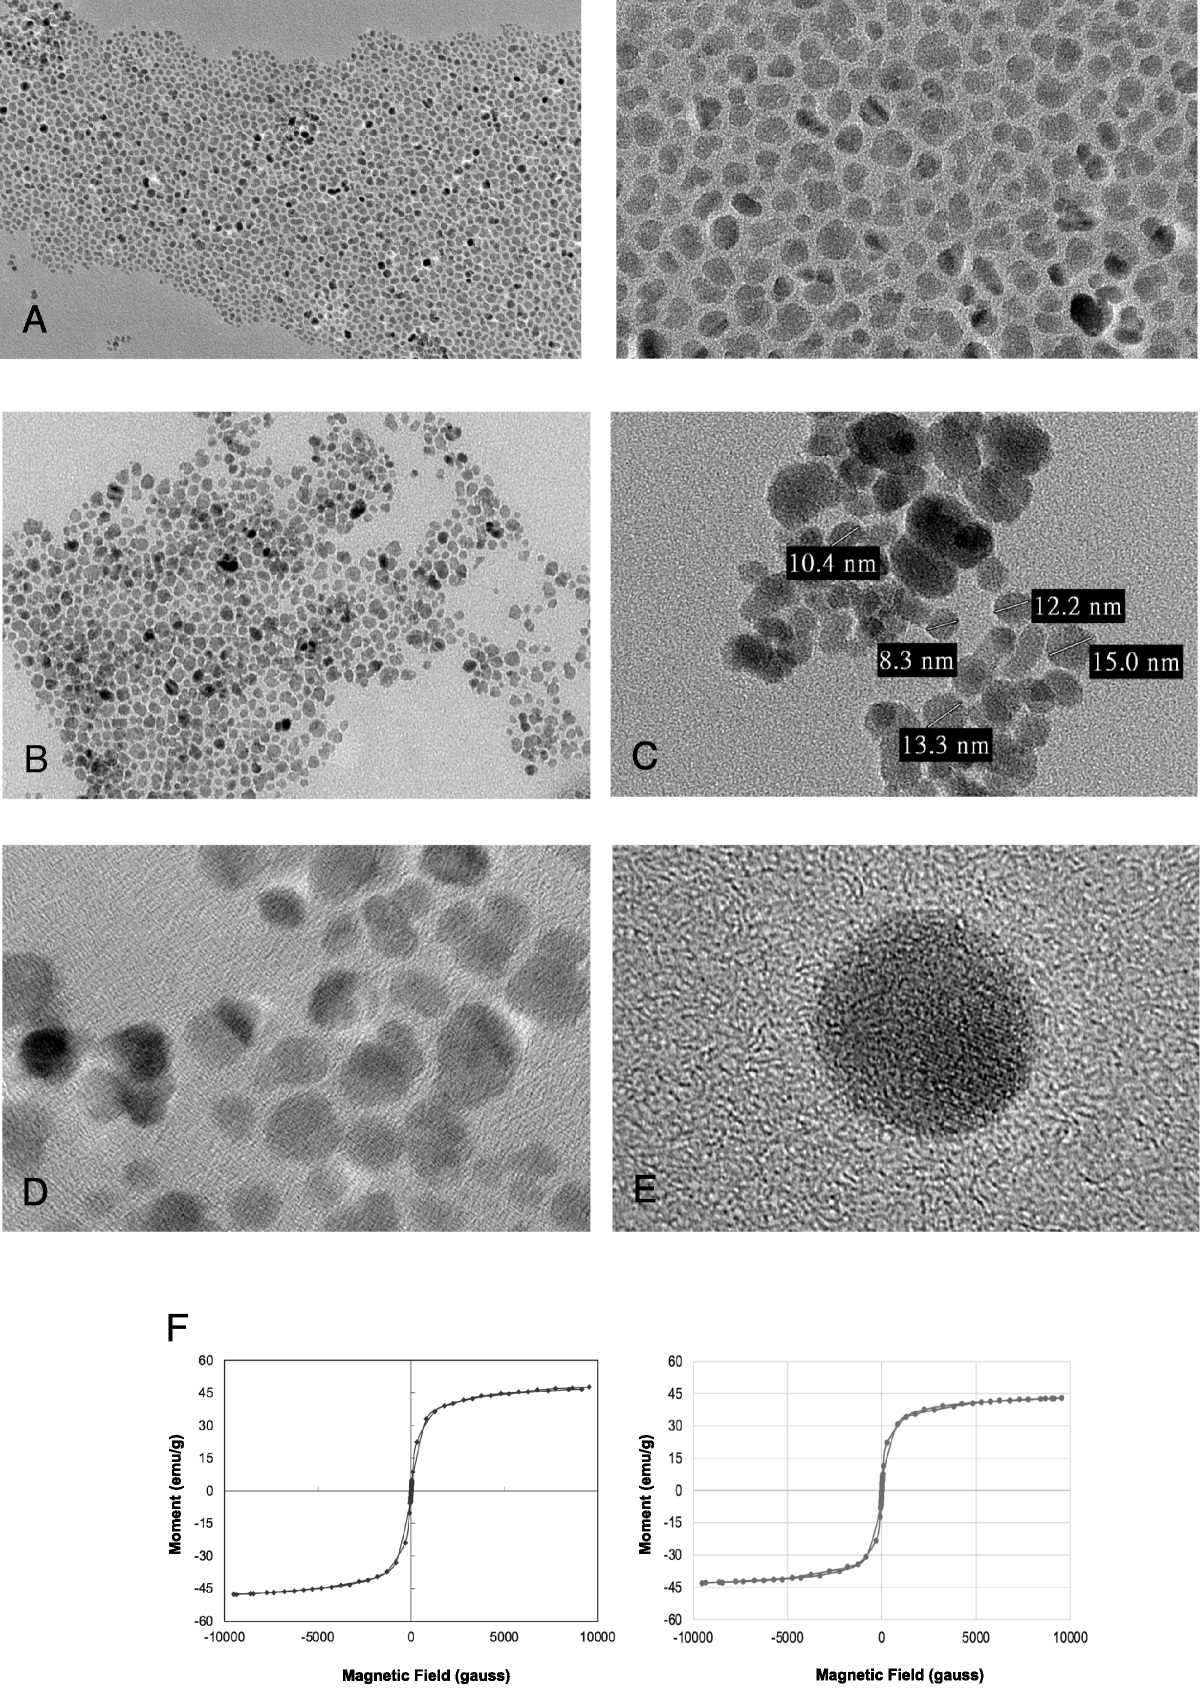
RESULTS Chemical StructureGadoquatrane (BAY 1747846) is a mGBCA. Its molecular weight is 2579 g/mol. The tetrameric complex is carrying 4 macrocyclic Gd-GlyMe-DOTA cages per molecule building a neutral complex (Fig. 1).
Key Physicochemical PropertiesGadoquatrane was soluble up to 1.43 mol Gd/L in buffer (10 mM Tris-HCl, pH 7.4). The partition coefficient (logP −4.32) in 1-butanol/water showed higher hydrophilicity compared with other established mGBCAs (Table 1). The viscosity of the formulation of the gadoquatrane at 37°C was in the low range of all mGBCAs (1.22 mPa·s), and its osmolality was 294 mosmol/kg (Table 1) and significantly lower compared with the other mGBCAs.24
TABLE 1 - Physicochemical Properties of GBCAs (Market Products and Development Candidates) Net Charge GBCA Generic Name Chelate Backbone No. Inner Sphere Water Molecules Gd Concentration of Formulation, mol Gd/L r1-Relaxivity in Human Plasma at 37°C, mM−1 s−1 Log P (1-Butanol/Buffer) Osmolality at 37°C, mosmol/kg H2O Viscosity at 37°C, mPa·s 1.5 T 3.0 T In clinical development Nonionic Gadoquatrane (BAY 1747846) Gd-GlyMe-DOTA (tetramer) q = 1 0.3 (0.075 per molecule) 11.8 ± 0.3* (47.2 ± 1.0 per molecule) 10.5 ± 0.3 (41.9 ± 0.6 per molecule) −4.32 294 (iso-osmolar to blood) 1.22 Nonionic Gadopiclenol Gd-PCTA q = 2† 0.5 12.8‡ 11.6‡ −4.2† 843† 7.6∥ Market products Nonionic Gadobutrol Gd-BT-DO3A q = 1 1.0 4.8 ± 0.1§ 5.0 ± 0.6§ −2.22 1603∥ 5.0∥ Nonionic Gadoteridol Gd-HP-DO3A q = 1 0.5 3.8 ± 0.1§ 3.3 ± 0.1§ −1.98∥ 630∥ 1.3∥ Ionic Gadoterate meglumine Gd-DOTA q = 1 0.5 3.3 ± 0.1§ 3.0 ± 0.1§ −2.87∥ 1350∥ 2.0∥*60 MHz (1.41 T) values for BAY 1747846, mean ± SD (n = 6 synthesized batches).
†Robic et al,21P value in octanol/PBS.‡Fries et al,22 reconstituted lyophilized human plasma.GBCA, gadolinium-based contrast agent.
The r1-relaxivities (37°C, pH 7.4) of gadoquatrane were determined in human plasma at 1.41 T (per Gd: 11.8 mM−1·s−1 corresponding to 47.2 mM−1·s−1 per molecule) and 3.0 T (per Gd: 10.5 mM−1 s−1 corresponding to 41.9 mM−1 s−1 per molecule) (Table 1). The r1-relaxivity of gadoquatrane in human plasma was more than 2-fold (8-fold per molecule) higher compared with established GBCAs.22,23
Nuclear Magnetic Relaxation Dispersion ProfilesThe NMRD profile in water showed ~3-fold higher r1-relaxivities of gadoquatrane per Gd compared with gadobutrol (20–200 MHz ≙ 0.47–4.7 T) (Fig. 2). The NMRD profile of gadoquatrane in human plasma revealed 2-fold higher r1-relaxivities of gadoquatrane per Gd compared with gadobutrol at the clinically relevant magnetic field strengths up to 200 MHz (4.7 T, Fig. 2).
 FIGURE 2:
 Nuclear magnetic relaxation dispersion profiles of gadoquatrane and gadobutrol in water and human plasma at 37°C (20–200 MHz corresponding to 0.47 to 4.7 T).
Complex Stability Under Physiological ConditionsFor both gadoquatrane and gadobutrol, the observed Gd release after 21 days at 37°C in human serum was below limit of quantification (LLOQ 0.1 nmol Gd/g). In contrast to these 2 macrocyclic agents, the linear gadodiamide showed an increasing dissociation over time reaching a total Gd release of 13.5% after 21 days (Fig. 3A).
 FIGURE 3:
 A, Comparison of the Gd3+ release over 21 days of gadoquatrane compared with the macrocyclic gadobutrol and the linear gadodiamide in human serum at pH 7.4 at 37°C. B, Comparison of the T1 relaxation rates (R1) in zinc transmetallation assay over time for the macrocyclic gadolinium-based contrast agents gadoquatrane, gadobutrol, and gadoterate meglumine and for the linear gadolinium-based contrast agents gadopentetate (Gd-DTPA) dimeglumine and gadodiamide.
Zinc Transmetallation AssayFor gadobutrol, gadoterate meglumine, and gadoquatrane, there was no change in the longitudinal relaxation rates (R1) over 3 days demonstrating high kinetic inertness and stability for the mGBCAs and gadoquatrane (Fig. 3B). In contrast to the mGBCAs, the linear GBCAs gadopentetate dimeglumine and gadodiamide revealed a 66% and 97% decrease of the T1 relaxation rates (R1) after 3 days, respectively.
Pharmacokinetic Studies Protein Binding and Blood-to-Plasma Partition RatioGadoquatrane showed negligible binding to plasma proteins. The free fraction in plasma (fraction unbound) was 93% in rat and 96% in human. The blood-to-plasma ratio of gadoquatrane was 0.62 ± 0.06 (6 human donors: mean ± SD) and correlates very well with the plasma fraction 0.58 ± 0.05 (hematocrit: 0.43 ± 0.05). Gadoquatrane does not penetrate blood cells, and its distribution is restricted to plasma.
Pharmacokinetics of Gadoquatrane in RatsThe fitted Gd plasma time-concentration profiles of gadoquatrane and gadobutrol are shown in Figure 4 (n = 3 per group). The calculated PK parameters are given in Table 2. The PK profile of gadoquatrane was essentially the same as for the established extracellular GBCAs, such as gadobutrol. As demonstrated for gadobutrol, gadoquatrane distributes rapidly into the extracellular space of the body and exhibits a plasma clearance (Clplasma) reflecting the glomerular filtration rate (GFR).
 FIGURE 4:
 Plasma Gd time-concentration profiles of gadoquatrane and gadobutrol in rats (n = 3).
TABLE 2 - Calculated Pharmacokinetic Parameters From Rat Plasma Kinetics of BAY 1747846 and Gadobutrol (Dose 0.1 mmol Gd/kg bw) PK Parameter Unit BAY 1747846 Gadobutrol α t1/2 min 6.3 ± 1.5 (24%) 2.5 ± 1.1 (42%) β t1/2 min 25 ± 1.6 (6.4%) 22 ± 0.69 (3.2%) γ t1/2 h 13 ± 2.9 (22%) 13 ± 2.0 (16%) AUC∞ μmol·h/L 183 ± 11 (5.8%) 234 ± 10 (4.3%) γ-AUC % of AUC∞ 1.2 1.1 Clplasma L/h/kg 0.55 ± 0.03 (5.8%) 0.43 ± 0.02 (4.3%) Vss L/kg 0.33 ± 0.05 (14%) 0.29 ± 0.03 (9.1%)Values are calculated as mean estimate ± SD (CV%).
PK, pharmacokinetic.
Organ distribution and recovery studies in rats provided evidence that gadoquatrane is completely (>99% of the injected dose) excreted within 7 days and is almost exclusively eliminated from the body by glomerular filtration without relevant active secretion or reabsorption. After single IV injection (0.1 mmol Gd/kg bw), the determined Gd concentrations in all investigated organs and tissues showed no relevant differences for both contrast agents 7 days p.i. (Table 3). The overall recoveries (in % of the Gd dose), including urine, feces, sum of all organs, and carcass, for gadoquatrane and gadobutrol were nearly identical (0.49% vs 0.50%, respectively) (Table 4).
TABLE 3 - Determined Gadolinium Concentrations (nmol Gd/g Wet Tissue) 7 Days After Single IV Injection of BAY 1747846 or Gadobutrol in Rats (0.1 mmol Gd/kg bw) Organ or Tissue BAY 1747846 Gadobutrol Blood <0.05* <0.05* Kidney 20.3 ± 1.37 19.6 ± 1.47 Liver 0.564 ± 0.065 0.312 ± 0.054 Spleen 0.654 ± 0.175 0.382 ± 0.101 Intestine 0.316 ± 0.120 0.453 ± 0.233 Skin 0.271 ± 0.044 0.202 ± 0.057 Bone 0.470 ± 0.201 1.013 ± 0.767† Bone marrow 0.413 ± 0.048 0.628 ± 0.420 Brain <0.08‡ <0.05* Mesenterial lymph nodes 1.20 ± 0.336 0.631 ± 0.113 Heart 0.133 ± 0.014 0.127 ± 0.004 Lung 0.359 ± 0.024 0.218 ± 0.046 Muscle 0.119 ± 0.021 0.074 ± 0.013 Stomach 0.182 ± 0.023 0.155 ± 0.010 Carcass 0.693 ± 0.126 0.590 ± 0.162Values are given in mean ± SD, LLOQ = 0.05 nmol/g wet tissue.
*n = 3 < LLOQ.
†1 value excluded because of sample contamination.
‡n = 2 < LLOQ.
IV, intravenous; LLOQ, lower limit of quantification.
Values are given in mean ± SD (% of Gd dose).
IV, intravenous.
No in vitro uptake or metabolic degradation of gadoquatrane in human or rat hepatocytes was observed within 4 hours. HPLC analysis of rat urine samples up to 6 hours after single IV bolus administration of gadoquatrane (0.1 mmol Gd/kg bw) showed high metabolic stability and no hint of formation of metabolites.
MRI of GS9L (Rat Glioblastoma) Brain Tumors in RatsUnenhanced T1-weighted images of the tumor appeared isointense to the surrounding brain tissue (Figs. 5 and 6). The contrast between tumor and the surrounding brain tissue was quantified by the CNR (CNR tumor-to-brain, Fig. 5B and Fig. 6B, 5 minutes p.i.). An improved contrast and demarcation of the tumor from the surrounding brain tissue compared with the unenhanced images was observed for all investigated GBCAs at different dose levels. The intraindividual comparison of gadobutrol and gadoquatrane (at the standard dose for currently marketed GBCAs of 0.1 mmol Gd/kg bw) showed a clearly higher CNR (tumor-to-brain) for gadoquatrane (Fig. 5). In addition, gadoquatrane showed an improved tumor demarcation and contrast for smaller tumor sizes (<2 mm) compared with gadobutrol (Fig. 5A, white arrows). Compared with gadoterate meglumine, gadoquatrane revealed a similar tumor-to-brain CNR at a relevantly reduced dose (>90% lower corresponding to 75% lower Gd dose) (Fig. 6B).
 FIGURE 5:
 A, Brain images of tumor rat model (GS9L, first animal cohort, n = 4) investigated at a clinical 1.5 T magnetic resonance imaging scanner. Magnetic resonance images show the intraindividual comparison of gadobutrol and gadoquatrane before and 5 minutes after administration of the standard dose of 0.1 mmol Gd/kg bw (corresponding to 0.025 mmol//kg bw per molecule). The tumors are indicated by white arrows. B, Box plot (min-max) of tumor-to-brain contrast-to-noise ratio 5 minutes after administration of contrast agent.
 FIGURE 6:
 A, Brain images of tumor rat model (GS9L, second animal cohort, n = 6) investigated at a clinical 1.5 T magnetic resonance imaging scanner. Magnetic resonance images show the intraindividual comparison of gadoteric acid at the clinical standard dose of 0.1 mmol Gd/kg bw compared with 0.025 mmol Gd/kg of gadoquatrane (75% lower Gd or more than 90% lower molecule dose). The tumors are indicated by white arrows. B, Box plot (min-max) of tumor-to-brain central nervous system 5 minutes after administration of contrast agent.
DISCUSSIONGadoquatrane is a novel tetrameric, mGBCA combining high water solubility, high complex stability, high relaxivity, and essentially the same PK profile as known from established mGBCAs with rapid distribution into the extracellular space and complete (>99%), almost exclusive renal excretion in an unchanged form. Runge et al15 were advocating the development of next-generation MRI contrast agents with improved relaxivity, extracellular distribution, and renal excretion. The tetrameric GBCA gadoquatrane was specifically designed to address these demands.
Commercially available mGBCAs show mean r1-relaxivity values from 3.3 (gadoterate meglumine) to 4.8 mM−1·s−1 (gadobutrol) in human plasma/serum at 1.5 T, pH 7.4, 37°C.23 Compared with these, gadoquatrane exhibits more than 2-fold (per Gd) and more than 8-fold (per molecule) higher r1-relaxivity in human plasma (r1: 11.8 per Gd corresponding to 47.2 mM−1·s−1 per molecule at pH 7, 1.41 T at 37°C).
Two main strategies have been devised to increase the relaxivity of GBCAs, typically by increasing (1) the molecular size of the paramagnetic system to slow down its rotational motion by either establishing interactions with macromolecules or by linking the single complexes in multimeric systems, and (2) the number of coordinated water molecules (inner sphere water, q).25–28 The molecular design of gadoquatrane is following the first strategy by linking 4 single Gd-GlyMe-DOTA complexes via highly hydrophilic amide bridges yielding an optimized slower rotational motion or tumbling rate (τR).25 In addition to the slower tumbling rate, gadoquatrane has a higher hydrophilicity and an enhanced hydrate shell (second sphere water effect) compared with established GBCAs (logP −4.32 1-butanol/water, Table 1). Gadopiclenol, another GBCA candidate in clinical development, is a PCTA derivative,21 and as such is following the second strategy to enhance the relaxivity by increasing the number of inner sphere water molecules (q = 2). The increase of the hydration state q of the Gd center can be obtained by reducing the number of donor atoms of the chelating ligand. The main issue with q = 2 compounds is the lower stability of the complex as reducing the number of binding atoms from the chelating ligand reduces the stability constant in general.27,29 Gd complexes containing heptadentate ligands such as PCTA, AAZTA, or HOPO30 analogs with 2 inner sphere water molecules (q = 2) are described as having lower in vitro and in vivo complex stabilities and a higher risk of Gd dechelation.2,27,31,32 Gd-PCTA is thermodynamically less stable than Gd-DOTA (log Kcond = 15.5 vs log Kcond = 19.3 at pH 7.4), but its kinetic inertness may be sufficient for in vivo applications.21,30 Gadopiclenol (log Kcond = 15.5) is a Gd-PCTA derivative that carries additional N-(2,3-dihydroxypropyl)propanamide substituents at the α-positions of its 3 acetates.21 In contrast to Gd-PCTA and Gd-PCTA derivatives as well as other q = 2 Gd complexes, gadoquatrane incorporates octadentate ligands (q = 1) comparable to all currently approved mGBCAs on the market (gadobutrol, gadoterate meglumine, and gadoteridol). The mGBCAs (q = 1) provide the highest complex stabilities.4 The crucial issue for clinical applications is the in vivo stability of the complex.
The kinetic inertness combined with the thermodynamic stability is a good predictor for in vivo complex stability.33 The ion exchange ICP-MS analytical investigation of the Gd complexes before and after 3 weeks incubation with human serum reflects both the kinetic inertness and the thermodynamic stability under physiological conditions. Gadoquatrane showed no release of Gd3+ within 3 weeks at 37°C in pooled human serum, and the complex stability of gadoquatrane was in the same range to other macrocyclic (q = 1) GBC
留言 (0)