
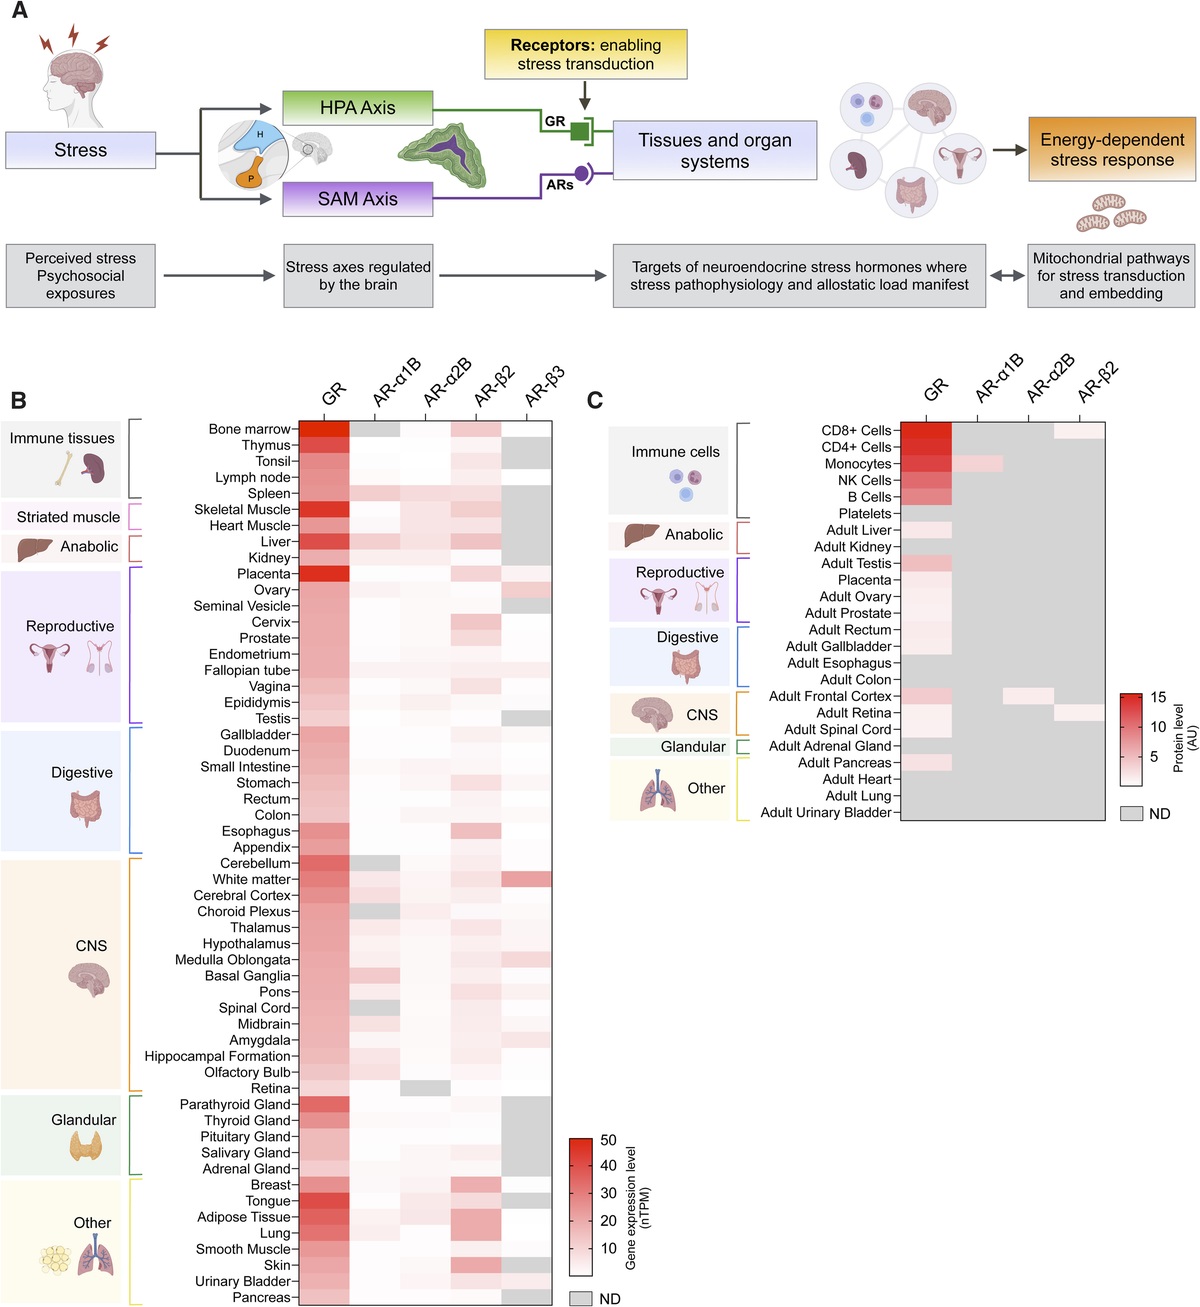
記住我
Trillions of diverse microorganisms inhabit the human gut to form personalized microbial ecosystems. The gut microbiome is composed of bacteria, archaea, and eukaryotes and includes both pathogenic and symbiotic microbes that influence health outcomes (1). Interestingly, emerging evidence has revealed that bidirectional communication is taking place between the mind and the gut microbiome (2) as shown in numerous animal studies (3). Similarly, research on adults has echoed these connections and linked gut microbial composition to psychological traits and processes like the stress response and mood disorders (3,4), and to neurological conditions such as Parkinson disease (5). Importantly, recent work has also indicated that this may start at a young age, with important implications for both emotional and social functioning. However, childhood mind-microbiome literature is sparse and has primarily focused on patients with autism spectrum disorder (ASD), a condition characterized by atypical emotional, attentional, and social behaviors (6,7). Thus, little is known as to whether the microbiome is linked to adaptive psychological constructs in typically developing children. The current study will contribute to this gap in the literature and explore whether certain microbes are connected to prosocial behaviors and constructs in healthy toddlers.
Given the robust body of research examining bidirectional mind-microbiome relations in animals, we first explore this more established research to inform the current study. Early work indicates that social factors can shape microbial composition. For instance, symbiotic bacteria (i.e., Lactobacillus) in infant rhesus monkeys significantly decreased after maternal separation (8). Furthermore, rodents placed with an aggressive cage mate resulted in decreased levels of the symbiotic bacteria Bacteroides and increased levels of the pathogenic bacteria Clostridium (9). However, numerous rodent studies have also shown that the gut microbiome regulates social behaviors (3). For instance, both rats and mice reared in the absence of microbial colonization (germ-free) showed decreased social approach behaviors when introduced to novel rodents compared with conventionally colonized controls (10,11). Similarly, germ-free mice chose to spend more time in a solitary chamber over a social chamber and also showed abnormally low interest in unfamiliar mice compared with controls. Interestingly, microbial reconstitution helped to reverse some of the social deficits observed (12), providing preliminary evidence that certain social behaviors are linked to the gut microbiome. These studies point to the interesting possibility that microbial transmission is fostered by host sociality. Thus, some microbes may have evolved to promote positive social behaviors, for example, by decreasing anxiety (13) and encouraging prosocial behaviors such as the likelihood of exploration, interactions with novel individuals, and general increases in socialization (12).
Adult human studies complement the animal research by connecting microbial composition to psychological domains directly related to social behavior including stress responses, anxiety, and depression. For instance, a meta-analysis of seven human studies showed improvement in depression, anxiety, and perceived stress in participants who ingested a probiotic compared with those given a placebo (14). Similarly, depression is positively linked to naturally occurring levels of Bacteroidales, Lachnospiraceae, and Alistipes (15). Research has also found greater microbial diversity in those with larger social networks, and lower diversity in those with high anxiety and stress (typically tied to reduced sociability) (16). Intriguingly, the same pattern is found in married individuals, especially those with close relationships, who harbor microbial communities of greater diversity relative to those living alone (17).
Although sparse, research assessing mind-microbiome relations in healthy children is promising. For example, one study revealed links between happiness and microbial composition in a sample of typically developing children (18). Furthermore, a study of fifty-one 12-month-olds in China revealed associations between temperament and gut microbiota. Specifically, Hungatella (a member of the Clostridiaceae family) was negatively correlated with cuddliness, whereas the ability to be easily soothed was positively correlated with Bifidobacterium (19). Another study of healthy toddlers revealed a connection between extraverted temperaments and greater microbial diversity. This study also showed that, in girls only, higher EC is tied to bacterial diversity within samples (20). Together, this growing body of research suggests that certain features of socially adaptive psychological constructs, including temperament, are bidirectionally associated with microbial composition. Furthermore, there is a related body of work indicating that numerous environmental factors overlap to shape the microbiome from birth. From infancy to childhood, the composition of the gut microbiome becomes more complex and diverse, and these changes coincide with dietary changes such as weaning and the introduction of solid foods (21). Other factors known to shape the gut microbiome in toddlers are mode of delivery (vaginal versus cesarean delivery) (22), sex (23), body composition (24), and breastfeeding duration (15).
Although there is little work on social-microbiome connections in typically-developing children, we can draw from the more established child ASD literature to identify autism linked microbes and assess whether these bacteria are also related to emotion regulation and social behaviors among a group of typically developing children. Given evidence that social deficits characteristic of ASD are continuously distributed across the population (25,26), gut microbiome composition may also be related to variation in sociability in the general population. This body of work points to a number of bacterial candidates. For example, young ASD patients have lower relative abundances of the bacterium Dialister (27), Akkermansia (28–30), and Parabacteroides (31) and higher relative abundances of Lachnospiraceae (32) and Ruminococcus (31,33) relative to healthy controls. Other bacteria frequently associated with ASD include Bacteroides, Prevotella, Escherichia/Shigella, and Alistipes (25,26). Specifically, research reveals increased levels of certain strains of Bacteroides in those with autism, whereas other research indicates no difference compared with healthy controls (25,27). Similarly, some studies found elevated levels of Prevotella (29,30), Escherichia/Shigella (34), and Alistipes (29), whereas other studies revealed decreased levels of Prevotella (35), Escherichia/Shigella (30), and Alistipes (34) when compared with controls. Taken together, these mixed findings suggest that certain bacteria are symbiotic with the host within optimal parameters, that is, not excessively high or low in relative abundance compared with typically developing individuals.
Indeed, early childhood is a crucial time in which the microbiome becomes established, and this coincides with a child’s emerging temperament, making it a pivotal period in which to examine mind-microbiome connections. In the first years of life, researchers assess adaptive social temperaments via a child’s ability to modify attention, emotion, and behavior (36). One example is the effortful control (EC) component of temperament, which is composed of subcategories assessing factors like child cuddliness (i.e., joy and ease of being held) and attentional focusing (i.e., ability to hold focus and resist distraction) (37). The cuddliness subcategory of EC is especially interesting in this context because it is the only EC category that effectively captures the features of many atypical socioemotional disorders (i.e., the ability/inability to engage in prolonged physical touch to emotion-regulate, presence/absence of prosocial behavior).
The current work uses data from a past study (20) assessing the relations between temperament and microbial composition in healthy toddlers. We build upon this research to examine whether microbiome characteristics typically tied to ASD-related behavior are associated with emotion regulation and social behavior in a sample of typically developing children. Bacteria assessed include Bacteroides, Prevotella, Ruminococcaeceae, Akkermansia (38), Escherichia/Shigella, Alistepes, Parabacteroides, Lachnospiraceae, and Dialister (39) with a particular interest in the EC prosocial subcategory: cuddliness. We predict that higher levels of Akkermansia, Dialister, and Parabacteroides and lower levels of Lachnospiraceae and Ruminococcus will be linked to higher levels of EC. In light of the mixed literature regarding Bacteroides, Prevotella, Escherichia/Shigella, and Alistipes, we test these associations in an exploratory manner.
METHODS ParticipantsParticipants included 79 mother-child dyads recruited from the general community of Columbus, Ohio. This sample size was based on a power analysis with power set at 0.95 and effect size set at 0.2. Participants were excluded if the parent reported that the child had a developmental delay or a major health condition, or if the child was already toilet trained (because of sampling requirements). A more detailed report of recruitment of this sample is described by Christian and colleagues (20). Two microbial samples were removed because of low sequence count (<5108), leaving a final sample of 77 toddlers for analyses (41 boys and 36 girls; mean [standard deviation], or M [SD] age = 23.14 [2.00] months). Mothers were 87.0% White (n = 67), 9.1% Black (n = 7), and 3.9% Asian (n = 3). Mother’s self-reported annual household income in US dollars was coded on a scale of 1 to 6, with 1 representing less than $15,000 per year and 6 representing $100,000 or higher. The average annual household income was $50,000 to $74,999, coded as 4 (M [SD] = 4.04 [1.62]). Parents’ education level was coded on a scale from 1 to 7 (less than a seventh-grade education, junior high, some high school, high school graduate, some college, college graduate, some graduate school or higher). Mother’s average education level was “college graduate,” coded as a 6 (M [SD] = 6.09 [0.98]). Father’s average education level was “some college,” coded as a 5 (M [SD] = 5.65 [1.17]). Mean (SD) maternal age at the time of delivery was 31.1 (5.43) years, and 87.0% of mothers (n = 67) were married. This study was approved by the Ohio State University Biomedical Institutional Review Board. Mothers provided informed written consent on behalf of themselves and their children and were compensated for participation. Data were collected between May 2011 and December 2012.
Microbial Assessment16S rRNA gene sequencing data, previously published by Christian and colleagues (20), were probed in the current study. Phylum and genus relative abundances are provided in Tables S1 and S2 (Supplemental Digital Content, https://links.lww.com/PSYMED/A851), and from these, a total of nine bacterial genera were selected for analysis based on previous literature commonly linking each genus with ASD. ASD-linked genera include the following: Bacteroides, Prevotella, Ruminococcaeceae, Akkermansia (38), Escherichia/Shigella, Alistepes, Parabacteroides, Lachnospiraceae, and Dialister (39). The Benjamini-Hochberg method (40) was used to control for the false discovery rate. False discovery rates (q values) in genome and metagenome (microbiome) research vary and include q values such as 0.15 (41). In the current study, we considered a p value <.05 and a q value <.15 significant. Preliminary analyses revealed that Akkermansia, Dialister, and Alistipes were the only select bacterial genera significantly associated with EC and EC subcategories; thus, these three genera are the primary focus of the current study.
ProcedureAfter providing consent, mothers completed online questionnaires describing the child’s diet, body composition, duration of breastfeeding, demographic characteristics, and child temperament. Stool samples were collected from the toddler by the mother within 7 days of completing questionnaires.
Collection and Storage of Stool SamplesToddler stool samples were collected by mothers from children’s diapers using sterile wooden applicators and 50-ml plastic conical collection tubes. Samples were refrigerated at approximately 4°C for up to 24 hours until delivery by research personnel or the participant to the Ohio State University Wexner Medical Center. Samples were transported in coolers with ice at which time samples were stored at −80°C until pyrosequencing was conducted.
Measures Effortful ControlEC was measured with a composite of five temperament subscales assessed by the short form of the Early Childhood Behavior Questionnaire (37). Mothers were asked to report the number of times in the last 2 weeks the child exhibited behavioral indicators of EC. Each subscale of EC consisted of six to eight items, and items were rated on a 7-point Likert scale (never, very rarely, less than half the time, half the time, more than half the time, almost always, always). Subscales included the following: attentional focusing, the toddler’s ability to resist distraction and sustain focus on the object of concentration; attentional shifting; the ability to redirect focus from one target to another; cuddliness, the degree to which the child expresses joy in and molds to the body of the caregiver when being held; inhibitory control, the ability to change behavior when instructed; and low-intensity pleasure, the level of pleasure or satisfaction derived from low stimulus activities that involve novelty, complexity, or incongruity. We examined each subscale for analyses and the composite score of all subscales to calculate overall EC. Specifically, associations between the 7-point Likert scale ratings for each subscale and the composite score of EC (composite scores ranged from 3.74 to 5.98) were assessed in relation to relative abundances of select bacteria.
Body Composition and Delivery ModeDelivery mode (1, vaginal; 2, cesarean) and the child’s sex (1, boys; 2, girls) were reported by mothers in the online questionnaire and included as covariates in analytic models. In addition, mothers reported the child’s height and weight percentile from the most recent well-child visit to the pediatrician to assess body composition based on weight-to-height ratio. Weight-to-height ratios were converted to decimal numbers (Table 1) for statistical analyses.
TABLE 1 - Descriptive Statistics of Key Variables by Children’s Sex (n = 77) Measures Total (N = 77), M (SD) Boys (n = 41), M (SD) Girls (n = 36), M (SD) Sex Differences, t Age, mo 23.14 (2.00) 23.20 (2.04) 23.08 (1.99) −0.24 Body composition 0.93 (0.68) 1.04 (0.87) 0.80 (0.34) −1.63 Breastfeeding duration 10.06 (7.23) 8.87 (6.34) 11.42 (8.00) 1.54 Vegetable/fruit consumption 7.00 (1.41) 6.76 (1.45) 7.28 (1.34) 1.63 Meat consumption 6.52 (1.80) 6.41 (1.73) 6.64 (1.85) 0.55 Effortful control 4.72 (0.47) 4.61 (0.40) 4.86 (0.52) 2.33 Cuddliness 4.36 (0.75) 4.27 (0.65) 4.46 (0.84) 1.10 Attentional focus 4.89 (0.75) 4.84 (0.68) 4.94 (0.83) 0.60 Attentional shifting 5.09 (0.69) 5.02 (0.69) 5.17 (0.68) 1.00 Inhibitory control 4.19 (0.96) 3.94 (0.91) 4.47 (0.95) 2.49* Low-intensity pleasure 5.11 (0.77) 4.98 (0.71) 5.26 (0.81) 1.57 Dialister 0.06 (0.11) 0.07 (0.13) 0.06 (0.10) −0.25 Alistipes 0.01 (0.03) 0.02 (0.04) 0.01 (0.02) −0.76 Akkermansia 0.01 (0.05) 0.004 (0.01) 0.02 (0.07) 1.26*M (SD) = mean (standard deviation).
Sex coding: 1 for boys, 2 for girls; body composition: weight/height ratio; breast feeding duration: age in months when breastfeeding stopped; vegetable/fruit/meat consumption: reported on a 1- to 8-point Likert scale (1, never; 8, two or more times per day); cuddliness, attentional focus, attentional shifting, inhibitory control, low-intensity pleasure: rated on a 7-point Likert scale (1, never; 8, always); effortful control: composite scores of all effortful control subscales, with values ranging from 3.74 to 5.98; bacterial genera (Dialister, Alistipes, and Akkermansia): relative abundance/percentage of each bacterium. Mothers were 87.0% White (n = 67), 9.1% Black (n = 7), and 3.9% Asian (n = 3), and the mean (standard deviation) maternal age at the time of delivery was 31.1 (5.43) years.
*p < .05.
Mothers completed an online questionnaire reporting the age in months in which fruits/vegetables, cereals/grains, and meats were introduced to the toddlers’ diet and the frequency in which each food type was consumed. For analyses, food frequency item ratings were included as covariates. Specifically, mothers reported fruit/vegetable and meat consumption on a scale from 1 to 8 (less than once per month, once a month, once every 2 weeks, once a week, twice a week, every other day, once a day, two or more times per day). Mothers also reported on the occurrence and duration of breastfeeding (age in months in which breastfeeding stopped); duration was also included in analyses.
Bacterial Tag-Encoded FLX-Amplicon PyrosequencingBacterial tag-encoded FLX-amplicon pyrosequencing (bTEFAP) was performed (42,43). The 16s rrn universal primers 27f (AGA GTT TGA TCM TGG CTC AG) and 519r (GWATTACCGCGGCKGCTG) were used in a single-step 30-cycle polymerase chain reaction with the following thermoprofile: a single cycle of 94°C for 3 minutes, then 28 cycles of 30 seconds at 94°C, 40 seconds at 53°C, and 1 minute at 72°C, with a single 5-minute cycle at 72°C for 5 minutes for elongation. Amplicons were pooled at equivalent concentrations and purified (Agencourt Bioscience Corporation, Beverly, Massachusetts). Sequencing was performed with the Roche 454 FLX Titanium system using the manufacturer’s guidelines.
Sequencing AnalysisThe software package, Quantitative Insights Into Microbial Ecology (QIIME), version 1.8.0. (44), was used for filtering and analysis of attained sequences. Because the current study builds upon previous analyses that used QIIME, version 1.8.0, we continued with the use of this version so results were comparable. Quality filtering and demultiplexing were performed using the provided sequence file (.fasta) and sequence quality file (.qual). Filtering was completed with the following parameters: quality score >25, sequence length between 200 and 1000 bp, 6 allowed ambiguous bases, maximum of 6 homopolymer run, and zero allowed primer mismatches. On average, 14,862 sequences passed filtering per sample.
UClust (45) clustered sequences at 0.97 similarity into operational taxonomic units (OTUs). After representative sequence selection for each OTU, Greengenes v.13_8 was used for taxonomic assignment (46). PyNAST was used for sequence alignment (44) with the Greengenes core reference alignment database (47). Sequences from boys and girls were filtered and de-multiplexed using the aforementioned method together, but were separated before OTU picking. Next-generation 454 pyrosequencing was used to identify bacterial communities. This approach was chosen owing to its low error rate and ability to classify microbes at lower taxonomic levels. Relative abundances of phylum and genera were used to assess relations between EC, community structure, and select bacterial genera.
Analytical ApproachAlpha diversity was measured with the Shannon Diversity Index (48), which assesses bacterial abundance (richness) and equalness of these abundances (evenness) using QIIME. Beta diversity analyses were conducted in R statistical software using the adonis function in the vegan package to generate Bray-Curtis matrices (49) and perform permutational analysis of variance and analysis of similarities (ANOSIMs; uses the R statistic to compare means of groups that use rank variables) between high and low EC groups. Differences in bacterial relative abundances derived from QIIME were assessed using version 25 of SPSS. If participants were missing data for any of the variables used in our analyses, their data were excluded. Male and female participants were very similar, with the exception of Akkermansia levels (Table 1). We first completed preliminary correlational analyses to test whether abundances of select genera were associated with EC, as well as the subscales of EC. Pearson correlation coefficients are reported in Table 2. Independent-samples t tests revealed that there were no significant sex differences in levels of cuddliness (p = .27) or attentional focusing (p = .56). Descriptive statistics for key variables, overall, and by child sex are reported in Table 1.
TABLE 2 - Correlation Matrix for Key Variables (n = 77) Variables 1 2 3 4 5 6 7 8 9 1. Body composition — 2. Breastfeeding duration −0.01 — 3. Vegetable/fruit consumption −0.20 −0.15 — 4. Meat consumption 0.06 −0.11 0.41** — 5. Effortful control −0.08 −0.10 0.07 0.12 — 6. Cuddliness 0.04 −0.08 0.01 0.08 0.65** — 7. Attentional focus 0.06 −0.02 0.10 0.07 0.52** 0.07 — 8. Dialister −0.08 0.04 −0.03 0.00 0.24* 0.23* 0.16 — 9. Alistipes 0.14 −0.03 −0.11 −0.25* −0.24* −0.02 −0.27* 0.02 — 10. Akkermansia 0.02 0.11 −0.14 −0.03 0.25* 0.36** 0.00 0.31** −0.07Sex coding: 1 for boys, 2 for girls.
*p < .05.
**p < .01.
Preliminary analyses revealed associations between select bacterial genera and overall EC. To probe these findings further, we conducted a series of hierarchical regressions on the genera that correlated with EC and EC subscales while adjusting for sex, diet (frequency of fruit/vegetable and meat consumption), body composition (weight to height ratio), and breastfeeding duration (age in months in which breastfeeding stopped) to assess the relations between each subscale. Covariates were chosen based on prior research suggesting that sex (23), delivery mode (22), diet (50), body composition (24), and breastfeeding duration (51) influence gut microbial profiles. Although breastfeeding is linked to compositional changes in the microbiome (51), the mean age of the current sample is 23.14 months and microbial profiles resemble those found in adults by approximately 2 (52,53) to 3 years of age (54). Indeed, progression from infancy to childhood includes dietary changes such as weaning and an increase in solid food consumption, both of which impact microbial composition (21). Because our sample falls within this nutritional and developmental transition, we conduct each analysis twice, once adjusting for breastfeeding duration and once excluding it from the statistical model. We report the adjusted R2 and p values in step 1 of each model, and the R2 change, unstandardized β coefficient, standard error, and p values in step 2 of each model.
RESULTSTo determine whether EC was related to overall measures of microbial community composition, we conducted regression analyses between EC and diversity measures. Regression analyses revealed no significant association between levels of EC and alpha diversity (r = 0.123, p = .293). In addition, permutational analysis of variance analyses of Bray-Curtis (49) dissimilarities (used to quantify variation in genus and phylum between samples) revealed that there were no significant differences in community structure between high and low EC groups on the phylum level (R2 = 0.00372, p = .745; Figure 1) or on the genus level (R2 = 0.01559, p = .276; see Figure 2). ANOSIM analyses of Bray-Curtis (49) dissimilarities were also conducted. ANOSIM’s R statistic measures dissimilarities between groups for rank variables (i.e., relative abundances) by comparing within a between-group differences (55). Results of the ANOSIM revealed no significant differences between high and low EC groups on the phylum (R = −0.0002, p = .545) or on the genus level (R = −0.012, p = .818). Relative abundance data for phylum and genera are reported in Supplemental Tables S1 and S2, https://links.lww.com/PSYMED/A851.
 FIGURE 1:
 NMDS ordination using Bray-Curtis dissimilarity to calculate distances between samples on the phylum level. EC = effortful control; NMDS = nonmetric multidimensional scaling.
 FIGURE 2:
 NMDS ordination using Bray-Curtis dissimilarity to calculate distances between samples on the genus level. EC = effortful control; NMDS = nonmetric multidimensional scaling.
Despite the lack of relationships between EC and measures of microbial diversity, EC was related to the relative abundances of three predicted bacterial taxa. Based on our a priori hypotheses, zero-order correlations among EC and select bacterial taxa (presented in Table 2) revealed that EC was significantly positively intercorrelated with Akkermansia (r(75) = 0.25, p = .027) and Dialister (r(75) = 0.24, p = .034) and negatively correlated with Alistipes (r(75) = −0.24, p = .035). Follow-up analyses of EC’s five subscales revealed that significant findings were driven by cuddliness and attentional focusing. Specifically, cuddliness was positively associated with Akkermansia (r(75) = 0.36, p = .001) and Dialister (r(75) = 0.23, p = .049). In addition, attentional focusing was negatively associated with Alistepes (r(75) = −0.27, p = .017).
Association Between Cuddliness and AkkermansiaAfter adjusting for sex, delivery route, diet, body composition, and breastfeeding duration (adjusted R2 = −0.024, p = .646), cuddliness was positively associated with higher levels of Akkermansia (ΔR2 = 0.116, b = 0.022, SE = 0.007, p = .003). Next, we adjusted for sex, delivery route, diet, and body composition but excluded breastfeeding duration from the model (adjusted R2 = −0.014, p = .558). Cuddliness remained positively associated with higher levels of Akkermansia (ΔR2 = 0.117, b = 0.022, SE = 0.007, p = .002).
Association Between Cuddliness and DialisterWe then probed the relation between cuddliness and Dialister while adjusting for sex, delivery route, diet, body composition, and breastfeeding duration (adjusted R2 = −0.75, p = .994). Cuddliness was no longer associated with higher levels of Dialister in step 2 of the model (ΔR2 = 0.053, b = 0.036, SE = 0.018, p = .052). Next, we conducted the analysis again using the same covariates but excluded breastfeeding duration (adjusted R2 = −0.065, p = .997). Cuddliness was still not significantly associated with Dialister in step 2 of the model (ΔR2 = 0.052, b = 0.035, SE = 0.018, p = .054) at an α level of .05.
Association Between Attentional Focusing and AlistipesFinally, we conducted another series of hierarchical regressions to examine the association between attentional focusing and the relative abundance of Alistipes. Results of the analyses revealed that after accounting for covariates (covariate adjusted R2 = −0.004, p = .463), attentional focusing was negatively associated with levels of Alistipes (ΔR2 = 0.061, b = −0.011, SE = 0.005, p = .031). These results remained significant after, excluding breastfeeding duration from the model (covariate adjusted R2 = 0.005, p = .377). Attentional focusing was again negatively associated with levels of Alistipes (ΔR2 = 0.062, b = −0.011, SE = 0.005, p = .028).
DISCUSSIONThe current study showed that Akkermansia and Dialister were positively associated with EC and Cuddliness. In addition, Alistipes was negatively related to attentional focusing. These findings complement past mind-microbiome research (27,28) and indicate that the microbiome is connected to social behaviors in a healthy, young, toddler sample. One possible explanation for links between Akkermansia, EC, and cuddliness may be the bacterium’s role in stimulating the production of mucous that lines the gut (56). Evidence suggests that low levels of Akkermansia are associated with compromised mucous barrier function resulting in the displacement of gut microbiota and/or their metabolic products into the serum (i.e., leak
留言 (0)