
記住我
A 27-year-old male patient presented with a 20-year history of bilateral progressive hearing loss and childhood-onset, gradually aggravating myopathy. He had motor retardation and dyskinesia with a waddling gait and had been unable to walk fast or climb stairs independently since childhood.
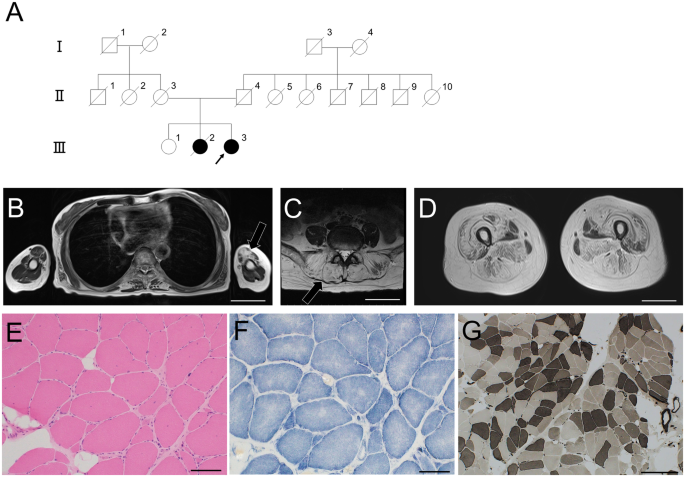
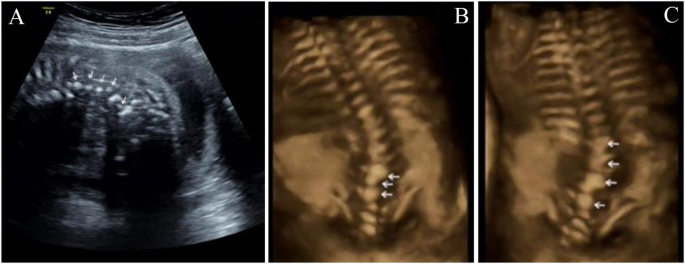
On physical examination, eye movements were bilaterally normal, and pupils were round, regular, and reactive to light. No ptosis was observed. There was no deviation of the tongue or the angle of the mouth. Neck resistance was absent, and the limbs could move freely. The muscle strength of the limbs was near-normal. Tendon reflex of both upper limbs was symmetrically elicited. Knee reflex was absent in both lower limbs. The Achilles tendon reflex of both lower limbs was symmetrically elicited. Rossolimo’s sign, Hoffmann’s sign, and Babinski’s sign were all negative. However, he had a high-arched palate and irregular arrangement of teeth, bilateral excessive bending of the extremities, and pes cavus deformity (Fig. 1A–D). He had never suffered from acidosis or hypoglycemia, with both fasting blood sugars and blood CO2 being in the normal range.
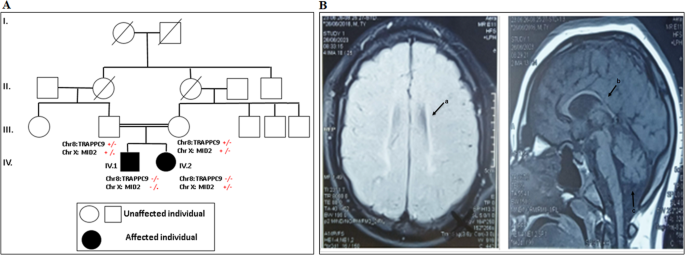
Fig. 1: Clinical manifestations, family information, and Sanger sequencing results.
A, B Bilateral excessive bending of the fingers and toes; C pes cavus. D high arch of the hard palate and irregular tooth arrangement. E Family pedigree; the father had the same phenotype, but a genetic analysis was not performed. F Patient heterozygous DNA2 variant verified via Sanger sequencing. G A Normative control of the gene
His father also complained of bilateral hearing loss and muscular weakness, and had a high-arched palate, irregular arrangement of teeth, bilateral excessive bending of the extremities, and pes cavus deformity. His father had already died of a heart attack at the age of 53; therefore, further physical examination or genetic analysis could not be performed. His mother was healthy with a normal auditory and motor system since childhood, without abnormal physical signs as her son. Her physical and neurological examinations were normal. The course of pregnancy and delivery were both normal (see pedigree in Fig. 1E).
Our patient was identified as the proband, with routine audiology tests revealing bilateral profound sensorineural hearing loss with an unaided pure tone threshold (average of 250 Hz to 8000 Hz) of around 85 dB hearing loss. Radiographic examinations excluded anatomical abnormalities, and cardiac and liver function tests ruled out any cardiac or hepatic diseases when he was received into the hospital before the surgery. We performed bilateral cochlear implantation. Unexpectedly, the patient experienced a generalized tonic-clonic seizure in the postoperative period, accompanied by elevated creatine kinase levels (484 IU/L) lasting for at least 1 month. Seizures did not occur thereafter. One month after the surgery, we turned on the bilateral cochlear, and auditory recovery was satisfactory.
Genetic analysisGenomic DNA was extracted from both peripheral blood leukocytes and muscle samples and analyzed via next-generation sequencing (NGS). First, we performed deafness gene detection with GenCap® Deafness Gene Capture Probe V4.0 (MyGenostics, Beijing, China) to search for target genes with the blood sample. Further, to exclude the possibility of other gene variants, we performed exon sequencing with GenCap® Whole Exon Gene Capture Probe V4.0 (MyGenostics, Beijing, China) with the blood sample, and mtDNA sequencing with GenCap® Mitochondrial Loop Gene Capture Probe V1.0 (MyGenostics, Beijing, China) using both blood and muscle samples. MtDNA sequencing analysis was performed with the latest Cambridge version of the mitochondrial genome (rCRS NC_012920) as the reference genome. Electrophoresis of mtDNA (from the muscle sample) was also performed to exclude large-scale mtDNA deletions and rearrangements. The classification of variants followed the American College of Medical Genetics guidelines
After identifying the pathogenic gene (DNA2), Sanger sequencing was conducted to confirm the variant with the blood sample. PCR amplification was carried out using the following primers (5′-3′): DNA2-F: AATAAGCTTTCACTCATGCCAAG; DNA2-R: 142 AAGGATTCCTGATGCCATAGAAC. We used the Mutation Surveyor® software to compare the reference sequence with our sequencing data. The classification of variants followed the American College of Medical Genetics guidelines.
Muscle biopsy and mtDNA copy number detectionBiceps brachii biopsy and mtDNA copy number detection, muscle staining, and ultrastructural studies were performed to verify the outcome of functional assays, as described below. Muscle mtDNA was extracted, and quantitative PCR was performed to determine mtDNA copy number [17]. Fluorescently labeled primers were used to detect the related mitochondrial genome fragments and nuclear genes, so as to calculate the number of mtDNA copies [17]. Western blot of DNA2 in the muscle sample was also performed with the antibody anti-DNA2(Affinity, Cincinnati, OH, USA; DF9453) and anti-GADPH (Proteintech, Rosemont, IL, USA; 10494-1-AP) to ensure successful translation and detect the concentration of DNA2.
Muscle staining and ultrastructural studiesMuscle tissue samples were stained for histological examinations. Hematoxylin-Eosin (H/E), Modified Gomori trichrome (MGT), Periodic Acid-Schiff (PAS), and Oil Red O (ORO) staining were performed to visualize the morphology of muscle fibers, blood vessels, and connective tissue. Enzyme histochemical analyses of ATPase reactions, and NADH-TR, COX-SDH, and NSE staining were performed to evaluate enzymatic function. Immunohistochemical staining was performed for various proteins associated with muscular dystrophy (i.e., Dystrophin-N, Dystrophin-C, Dystrophin-R, α-Sarcoglycan, β-Sarcoglycan, γ-Sarcoglycan, Dysferlin, and Desmin) and inflammatory myopathy (i.e., CD3, CD4, CD8, CD20, CD68, and MHC-I). Muscle ultrastructure was examined via electron microscopy as per routine methods.
Functional tests in vitroFunctional experiments, including the analyses of mtDNA copy number; levels of ATP, ATPase, reactive oxygen species (ROS); and membrane potential (MMP), were all performed in triplicate.
Plasmid constructionThe target gene fragment was prepared using the following primer sequences (5′–3′): DNA2-F: CTTGGTACCGAGCTCGGATCCatggagcagctgaacgaact; DNA2-R AACGGGCCCTCTAGACTCGAGttattctctttgaaagtcaccca. The target gene was amplified via PCR, and the PCR products were cloned into the pcDNA3.1-3flag-N vector.
Cell culture and transfectionHEK293T cells were incubated in Dulbecco’s Modified Eagle Medium containing 10% fetal bovine serum at 37 °C in 5% CO2. The cells were separated into four groups, as follows: HEK293T cell control group (Control group), HEK293T cells with empty vector (Empty group), HEK293T cells with 3xFlag-hDNA2 (Wild-type group), and HEK293T cells with 3xFlag-hDNA2 Q790X (Variant group). For transient transfection, cells were cultured for 24 h in an incubator at 37 °C and 5% CO2. Thereafter, 7.5 μL of Lipo3000 and 2.5 μg of 3xFlag-hDNA2 plasmid (3xFlag-hDNA2 Q790X plasmid and empty vector for the other groups) with 5 μL of P3000 were separately added to 125 μL of Opti-MEM and mixed at a ratio of 1:1. After 15 min, the compound was added to the medium and incubated for 48 h.
Western blottingTransfected HEK293T cells were washed in phosphate-buffered saline (PBS) and lysed in RIPA buffer (Beyotime, Shanghai, China; P0013B) with protease and phosphatase inhibitors, followed by sonication and centrifugation for 20 min at 4 °C. The purity of recombinant proteins was evaluated via sodium dodecyl-sulfate polyacrylamide gel electrophoresis (SDS-PAGE). Western blotting was performed using whole-cell lysates with the following antibodies: FLAG-TAG (Affinity, Cincinnati, OH, USA; T0003) and anti-GAPDH (Proteintech, Rosemont, IL, USA; 10494-1-AP).
mtDNA sequencing analysis in vitroThe mtDNA of transfected HEK293T cells was extracted and subjected to sequencing via the same procedure as for patient blood samples.
mtDNA copy number detectionThe Human Mitochondrial DNA (mtDNA) Monitoring Primer Set (Takara, Kusatsu, Japan; 7246) was used to quantify the relative human mtDNA copy number via quantitative real-time PCR (RT-qPCR), using nuclear DNA (nDNA) content as a standard. Two pairs of primers (ND1/SLCO2B1 and ND5/SERPINA1) were used for the detection of nDNA and mtDNA, respectively. The Universal Genomic DNA Kit (Kangwei, Shenzhen, China; CW2298) was used to extract sample DNA as per the manufacturer’s instructions. Primer mixes were added, and two mtDNA genes and two nDNA genes were evaluated on the Roche LightCycler480. DNA was amplified using the 2X Color SYBR Green qPCR Master Mix (EZ Bioscience, Roseville, MN, USA; Cat. No. A0012-R2). The threshold cycle (Ct) value for each template was detected via StepOneTM Real-Time PCR Fluorescence Quantitative PCR. The differences in Ct values (ΔCt) for the ND1/SLCO2B1 pair (ΔCt1) and the ND5/SERPINA1 pair (ΔCt2) were determined. The 2ΔCt method was used to obtain the final mtDNA copy number.
ATP concentrationThe ATP concentration was evaluated using the ATP Assay Kit (Nanjing Jiancheng Bioengineering Institute; A095-1-1) as per the manufacturer’s instructions. Briefly, 300 μL of ddH2O was added to cells in each treatment group. The cells were ultrasonicated in a hot water bath and vortexed for 1 min. Appropriate reagents were added as per manufacturer instructions, and the samples were maintained at 25 °C for 5 min, and then detected using a microplate reader (Thermo, Waltham, MA, USA; Multiskan GO). The ATP concentration was calculated according to the following formula:
$$}}}}}}}\,}}}}}}}\,( }}/}}}}}}}\,}}}}}}} ) = \, (}}}}}}}_}}}}}}}}-}}}}}_}}}}}}}})/(}}}}}}}_}}}}}}}} - }}}}}}}_}}}}}}}}}) \\ \times }}}}}}}_}}}}}}}} \, \times \, }}}}}}}/}}}}}}}$$
(where C standard represents the Standard concentration of 1 × 10³ μmol/L, N indicates the dilution before sample dilution; Cpr indicates the Sample protein concentration in mg/mL.)
ATPase concentrationThe ATPase concentration was evaluated using the ATPase Assay Kit (Nanjing Jiancheng Bioengineering Institute A016-1) as per the manufacturer’s instructions. Cells were broken via ultrasound treatment in an ice bath (power 20%, ultrasound 5 s, interval 10 s, repeated three times). Cells were then centrifugated at 1000 rpm/min and 4 ˚C for 5 min. The supernatant was obtained for a bicinchoninic acid (BCA) assay. After the enzymatic reaction and phosphorus measurements were completed, samples were detected using a microplate reader. (Thermo Multiskan GO). The detected ATPases included NaK-ATPase, Mg-ATPase, Ca-ATPase, and CaMg-ATPase, and concentrations were obtained based on the following formula:
$$\begin}}}}}}}\,}}}}}}}\,\left( }}}}}}}/}}}}}}}\,}}}}}}}} \right) = \left( }}}}}}}\,}}}}}}} - }}}}}}}\,}}}}}}}} \right)/}}}}}}}\,}}}}}}}\\ \times }}}}}}}\,}}}}}}}\left( }}}}}}}/}}}}}}}} \right) \times }}}}}}}\,}}}}}}}\,}}}}}}}\,}}}}}}}\,}}}}}}}\,}}}}}}} \\ \times 6/}}}}}}}\,}}}}}}}\,}}}}}}}\,}}}}}}}\,}}}}}}}\,}}}}}}}\,}}}}}}}\,}}}}}}}\,\left( }}}}}}}\,}}}}}}}/}}}}}}}} \right)\end$$
ROS detection via 2′-7′dichlorofluorescin diacetate (DCFH-DA)Cells were washed with PBS. DCFH-DA was diluted to 10 μM/L. The collected cells were added to DCFH-DA and incubated at 37 °C and 5% CO2 for 20 min. The cells were washed with PBS three times to remove the free probe and were then resuspended in PBS after centrifugation. ROS were immediately detected using a flow cytometer (BD CytoFLEX S), and the results were analyzed using FlowJo™ Software.
MMP with JC-1JC-1 working solution was added to cells for incubation at 37 °C. During incubation, an appropriate volume of JC-1 buffer, 1 mL of staining buffer (5×), and 4 mL of ultrapure water were added. The free probe was removed after incubation. A flow cytometer (BD CytoFLEX S) was used to detect MMP [18], and the results were analyzed using FlowJo.
Statistical analysisData are presented as the mean ± SD and were analyzed using analysis of variance. SPSS 25.0 (IBM Corp., Armonk, NY, USA) was used for all statistical analyses. A two-tailed p-value ≤0.05 indicated a statistically significant difference.
留言 (0)