
記住我


The need to protect workers from COVID-19 is a persistent issue with debate around the degree to which SARS-CoV-2 transmission occurs in the workplace and which occupations are most affected, with calls for COVID-19 to be classified as an occupational disease.1 2 It is important that we better understand occupational risks in order to inform policy and practice. COVID-19 disease in the workplace will be a consequence of exposure to SARS-CoV-2 virus; workplace factors known to be related to exposure include ventilation, ability to social distance and number of daily contacts.3 4
Several studies have found increased risks of infection and mortality from COVID-19 among healthcare workers5–8 when compared with other workers. Other studies have not found an increased risk9 or suggest it varies by type of worker and/or stage of the pandemic.10–16 Other non-healthcare occupations considered to have high exposure to SARS-CoV-2 include police and protective services, education workers, social care workers, office workers, transport workers and construction workers.17 The evidence for whether this perceived exposure translates to increased infection and/or mortality is varied.8 10 15 16 18–21 This can be partially explained by different approaches to ascertaining outcome, often using testing regimens linked to self-referral or occupation. In addition, different time periods had different mitigation strategies in place. A systematic approach to comparing across occupations is required.
We analysed data from the Office of National Statistics (ONS) COVID-19 Infection Survey (CIS) aiming to ascertain: (1) whether occupation is associated with SARS-CoV-2 infection (2) which occupations had the greatest risks and (3) how this varied over time.
MethodsDatasetThe CIS is a panel survey of children and adults (aged two upwards) with random sampling designed to be representative of the UK population to allow unbiased estimates of prevalence of SARS-CoV-2 infection and immunity. Recruitment commenced April 2020 and additional participants added monthly. On recruitment participants are visited weekly for 5 weeks and monthly thereafter. The design has been reported in detail elsewhere.22 23 Each in-person visit incorporates a survey and PCR test; regardless of COVID-19 or isolation status. Data include demographic information, COVID-19 symptoms, occupation and work sector. Recruitment rates were reported to have been 51% initially dropping to 12% during later phases, with attrition rates during 2021 of less than 1%.24
Data usedAll analyses were restricted to individuals in the CIS dataset aged 20–64 years at their first ONS visit, using data up to November 2021. To explore how relative differences varied over time, the data were divided into four time periods (table 1) relating to periods of restriction in the UK.
Table 1Details of four time periods
Overall and by time period, a binary infection variable was created relating to at least one positive PCR test result. Multiple infections per person were included if they were across two time periods with a negative test between. We identified the presence and date of the first positive PCR test for each individual. Only positive results obtained as part of the ONS survey (and not self-reported results reported between visits) were used.
Four-digit Standard Occupational Classification (SOC) 2010 codes were used to derive occupational categorisations. The SOC classification is hierarchical with the first digit indicating major occupational groups, and subsequent digits classifying occupations with increasingly greater detail. To allow comparison, we used 13 categories of essential worker25 defined by Nafilyan et al 15 and broad categories used by Mutambudzi et al 7 (see online supplemental appendix 2). The Nafilyan classification included three types of healthcare worker; healthcare professionals (key role in diagnosis and treatment decisions, eg, doctor), healthcare associates (with a technical or complementary role in patient care, eg, pharmacy technician) and healthcare support workers (supportive role, eg, nursing assistant). Two additional classifications were one-digit SOC codes and sector (using categories defined by the ONS). Where a participant had a valid two-digit SOC recorded but not a four-digit SOC, we used their data wherever possible (for analysis by one-digit SOC) but classified them as missing for other analyses (when four digits were required to derive categories as per Nafilyan).
After using available four-digit SOC codes to create the occupational categories, anyone who was recorded as ‘not working’ due to either unemployment, furlough, retirement, childcare, education or other reasons was categorised as ‘not working/student’. Anyone who was working but did not have data on either their SOC code or employment status was recorded as missing. Participants were not excluded on the basis of work status or missing occupational data.
In order to decide which variables to adjust for in our models, a review of potential causal pathways between occupation and COVID-19 has been carried out by examining other analyses in this area.26 27 We derived a Directed Acyclic Graph (DAG)28 (online supplemental S9, an interactive version of which can be accessed at http://dagitty.net/dags.html?id=5J_TeK). We consider our DAG suitable to answer questions about the short term effect of workplace attendance during the pandemic so variables relating to extended tenure in an occupation (health, socioeconomic) were treated as confounders. Adjustment covariates were age (as quintiles), sex, ethnic group, Index of Multiple Deprivation (IMD), geographical region, household size, urban or rural location and presence of health condition.
AnalysisInitially, we used basic frequency tables reported as n (%). The denominator was the number of individuals aged 20–64 active in the CIS during the time period of interest.
We analysed the data using time-varying Cox regression, which produces estimates of HRs (for a first positive PCR test within the survey) with 95% CIs. Time was measured for each individual from the date of the first survey, with uninfected individuals censored at last available follow-up.
In addition, we used a multilevel logistic regression model with a random intercept for participant to take into account repeated measurements by time periods for the same individual. In this analysis, at least one infection within the time period was the dependent variable and a time by occupation interaction was included. Marginal odds ratios (ORs) were calculated postestimation.
No adjustment was made for multiple participants from the same household (due to model convergence issues) and no weighting was used (due to available weights being cross sectional rather than longitudinal). Coefficient plots were used to compare the occupational effects across the different models. Adjustment covariates were entered into all models in a sequence as shown in table 2 using the categorisations seen in table 3.
Table 2Table of adjustment set by model
Table 3Demographic information of adults aged 20–64
Analyses were conducted in Stata V.1729 in the ONS Secure Research Service.
Sensitivity analysesWe ran sensitivity analyses to test whether conclusions were robust. These included alternative categorisations of ‘not working’, alternative definitions of a new infection, running separate models for North versus South of UK, implementing left-censoring for Cox regression and including covariates relating to behaviour and foreign travel. Due to missing four-digit SOCs for some participants, we used multiple imputation to impute four-digit SOCs based on two-digit SOCs and demographic information.
ResultsBy November 2021, there were 312 304 participants of working age in the CIS, of these 25 377 (8%) had at least one infection detected by a PCR test as part of the survey. Online supplemental S2 shows demographic information. The group had more females than males (55% vs 45%), and had a mean age of 45 years. Participants contributed information on a total of 3 910 311 visits, with between 1 and 24 visits per person (mean 12.5 visits). A large proportion (91%) classed themselves as part of a White ethnic group, which is higher than 2019 population estimates (84.8%)30 and there was some overrepresentation of the least deprived IMD quartile (33% in the first compared with 16% in the fourth quartile). 153 302 (49%) were known to be working and had occupational information in the form of a four-digit SOC for at least one time point in the survey and 242 904 (78%) had information on industrial sector.
For all models, adjusting for multiple demographic factors only slightly changed the effect estimates and their confidence intervals. For reporting, we focus on model 3, the fully adjusted model to provide estimates that most likely reflect direct workplace-related risks. Figure 1 and online supplemental S1 compare the hazard of infection for participants in 13 groups of essential worker to non-essential workers. Elevated risks of infection can be seen for social care staff (HR 1.14; 95% CI 1.04 to 1.24), education (HR 1.31; 95% CI 1.23 to 1.39), bus and coach drivers (1.43; 95% CI 1.03 to 1.97) and police and protective services (HR 1.45; 95% CI 1.29 to 1.62) when compared with non-essential workers. It was unclear whether risk of infection was elevated for healthcare support workers 1.13 (95% CI 0.96 to 1.32), food retail and distribution (HR 1.02; 95% CI 0.93 to 1.13), food production (HR 1.04; 95% CI 0.83 to 1.31), taxi and cab drivers and chauffeurs (HR 1.17; 95% CI 0.83 to 1.65), van drivers (HR 1.17; 95% CI 0.92 to 1.23) and other transport workers (HR 1.06; 95% CI 0.92 to 1.23). For healthcare associate professionals (HR 0.96; 95% CI 0.88 to 1.04), there was little evidence of any elevated risk. Healthcare professionals (HR 0.78; 95% CI 0.67 to 0.91) had a small reduction in hazard when compared with non-essential workers during the time period of interest.
 Figure 1
 Results of Cox regression for 13 categories of essential worker compared with non-essential workers. Time to first infection adjusted for (1) age and sex (2) age, sex, IMD, ethnic group, region (3) age, sex, IMD, ethnic group, region, household size, rural or urban location, health conditions. Model uses 3 910 311 observations from 312 304 participants. IMD, Index of Multiple Deprivation.
When repeating this analysis by sector (online supplemental S3 and S4), elevated risks on average for the education, social care, food production and transport sectors were observed compared with the IT and communication sector. The healthcare sector also displayed an increased risk on average. Elevated risks were also observed for retail, hospitality, personal services, financial services, construction, manufacturing and civil service. Analysis by one-digit SOC (online supplemental S5) showed elevated risks for participants in major occupational groups relating to Caring, leisure and other service, process plant and machine operatives and elementary workers when compared with Managers, directors and senior officials.
Figure 2, online supplemental S6,S7 show the interaction between occupation and time for three broad categories of essential workers. There was evidence of an interaction between occupation and time demonstrating variation in relative differences over the pandemic. On average healthcare workers had an elevated risk of infection during the earlier periods (April 2020 to September 2020 (T1), October 2020 to February 2021 (T2)), but this diminished by T3 (March 2021 to May 2021 and by T4 (June 2021 to October 2021) was at a level below that of non-essential workers. The combined group of social care and education workers did not have an elevated odds during T1, but did by T2 and this persisted through T3 and T4. For other essential workers on average, elevated risks were seen at T2 and T3, but not at T1 and T4.
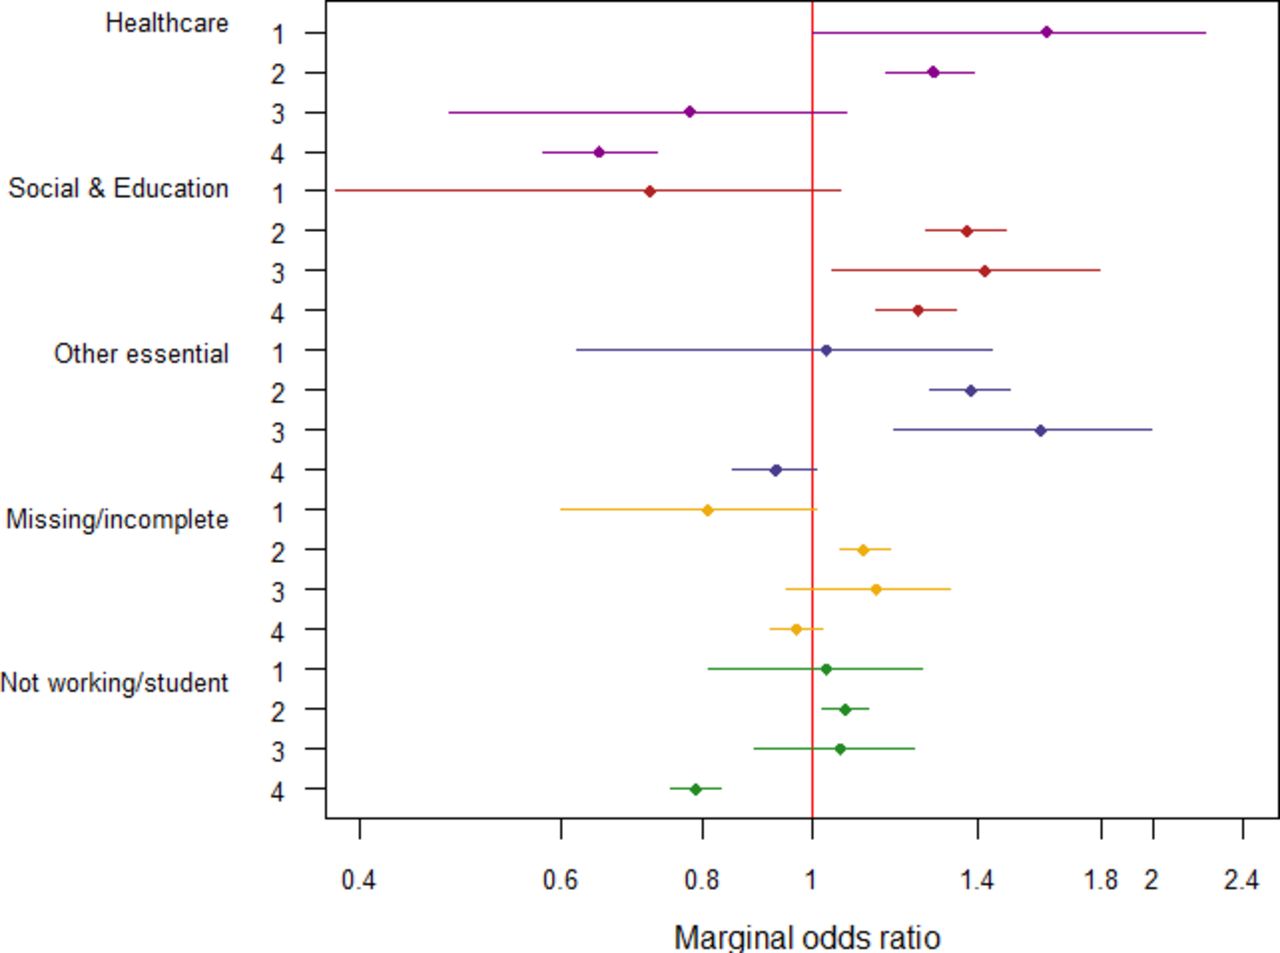 Figure 2
 Marginal ORs (95% CIs) for odds of new infection for essential worker categories compared with other workers in four time tranches: April 2020 to September 2020 (T1), October 2020 to February 2021 (T2), March 2021 to May 2021 (T3), June 2021 to October 2021 (T4). Adjusted for age quintile, sex, ethnicity, IMD, region, household size, urban versus rural area, presence of health conditions. Restricted to working age adults (20–64 years). N=312 304. IMD, Index of Multiple Deprivation.
Repeating this analysis by sector for two time periods (online supplemental S8) shows that for most sectors any elevated odds were most pronounced in the early part of the pandemic, with only education, hospitality and manufacturing having elevated relative odds in both time periods.
The impact of sensitivity analyses on estimates was negligible, and overall conclusions did not change.
DiscussionThere was clear evidence that the relative differences between occupational groups varied over the pandemic. During April 2020 to February 2021, when a large number of restrictions were in place, healthcare workers saw an elevated risk compared with non-essential workers. Later, during March to November 2021 once restrictions were eased, and healthcare workers were offered early vaccines, healthcare did not appear to show an elevated risk compared with other workers. The infection survey did not start until April 2020 and therefore during the period of study many healthcare workers may have had immunity from prior infection. The fact that healthcare associates and healthcare support staff saw increased risks where healthcare professionals did not is in line with other research.31 Healthcare support workers and healthcare associate professionals would have had similar access to vaccines; but it has been reported that access to personal protective equipment (PPE) for healthcare staff varies by role and work area.32 Some health associate professionals such as dentists and opticians had less face-to-face contact with patients during the first national lockdown and therefore less early exposure.
For workers in social care and education, there was little evidence of increased risk in April to September 2020 when schools were mainly closed, but there was a large increase subsequently and this persisted over the time period covered in this analysis. Similar results were observed in another UK cohort, Virus Watch,29 which found a persistently elevated risk for teachers in the third wave of the pandemic compared with other occupations. This group has been shown to have an above average level of exposure with a high number of close contacts and a high probability of intense space sharing during the working day.33
Food production workers did not see an elevated risk when compared with non-essential workers; seen in both the analysis by sector and by essential worker groups and mirroring analyses of COVID-19 mortality.15 This industry has reported a large number of outbreaks with one UK study.18 The defined group in this study combined outdoor agricultural workers with indoor process operatives; therefore, it may be that the average result disguises heterogeneity of risks within the sector. In addition, migrant and temporary workers, thought to be common in this sector, may be missing from the CIS. Food processing workers may have immunity from early infection and/or high levels of PPE and other mitigation.
Elevated risks were seen for the transport sector overall; small numbers lead to wide confidence intervals when we look at individual groups of transport workers, so the picture as to which groups are most at risk is still unclear.
Several sectors and occupations saw elevated risks in the earlier time periods which diminished later. It is possible that with reduced national restrictions and increased social mixing, that differences in workplace transmission have become less pronounced because the main routes of transmission are now outside the workplace. It is also possible that the differences are to do with increased transmission in the references categories used rather than reductions in the categories perceived to be at high risk.
As can be seen in figure 1, adjustment for other variables made very little difference to our estimates in contrast to analyses of mortality.15 Our results appear robust, regardless of the chosen DAG and adjustment set. Some sectors and occupations appear to have persistent high risks even after taking into account confounding factors such as age and comorbidity and therefore workplaces and governments need to invest in mitigation measures and further research into how to reduce these risks.
A very slightly higher risk on average was observed for the ‘not working’ group when compared with non-essential workers which may be due to residual confounding based on socioeconomic status or unhealthy behaviours34 or to the inclusion of students. There also may be a degree of reverse causality, with participants giving up work due to a period of illness.
StrengthsFor these analyses, we used SARS-CoV-2 infection identified via PCR tests during a longitudinal prevalence survey. These tests would identify both symptomatic and asymptomatic infections. This dataset is ideal for assessing questions about occupation and infection because PCR results via survey visits are likely to be independent of occupation.35
We used both occupational groups categorised from four-digit SOC codes and sector groupings from self-reported sector categories and conclusions remained similar for each. We have used occupational groupings used in previous studies to allow triangulation of results.
We looked at how the relative risks between occupations changed over time to see how relative effects changed according to restrictions and mitigation strategies in place. This also allowed us to take into account changes inoccupation or working status over time, plus include reinfections for the same individual.
LimitationsThe ONS infection survey was a prevalence study with monthly tests; it is likely that positive results were missed in between visits. While this is relevant to prevalence estimates, it is less likely to affect relative effects. The CIS started in April 2020, several months into the pandemic, so we are likely to have missed a period where increased risks would have been most evident for some groups.
It is possible that certain occupations will be underrepresented in the survey due to their availability for the study visits. There is risk of selection bias; for example, healthcare workers who were front-line may have been less likely to be recruited or less likely to provide data than those who were non-front line due to shift work or lack of time. There is also under-representation in the survey from participants in the most deprived quartiles and those from non-white ethnic groups and these groups are known to be more likely to work in certain occupations. We adjusted for these factors when making relative comparisons but selection bias may remain and potentially distort estimates of associations.
There are likely to be additional confounders that we have not been able to take into account, for example socialising outside the workplace, and household overcrowding. We had an ecological measure of socioeconomic status, the IMD, which may not fully explain the circumstance of the individual, leaving residual confounding in this area.
Occupational information, particularly four-digit SOC, was missing for a proportion of participants. We used sensitivity analyses and also accompanied analyses by occupation with analysis by sector (where information was more complete) in an attempt to test robustness.
There is likely to be variation within occupational groups that will be masked when assessing group averages. The sample is not large enough to make meaningful analysis of more granular groupings, particularly when assessing separate time periods.
ConclusionsSome occupational groups see elevated risks of SARS-CoV-2 infection when compared with others, and the relative effects varied at different time points. Increased risks for healthcare workers appear to be most pronounced during the early part of the pandemic, but varied according to the type of healthcare worker. Increased risks were seen in education and social care once the initial lockdown of the first wave was over, and this has persisted into the third wave suggesting that increased mitigation is required in these sectors.
Data availability statementData may be obtained from a third party and are not publicly available. These data can be accessed only by researchers who are Office of National Statistics (ONS) accredited researchers. Researchers can apply for accreditation through the Research Accreditation Service. Access is through the Secure Research Service (SRS) and approved on a project basis. For further details see https://www.ons.gov.uk/aboutus/whatwedo/statistics/requestingstatistics/approvedresearcherscheme.
Ethics statementsPatient consent for publicationEthics approvalThis study involves human participants but UK statistics authority self-assessment classified study as low risk. This assessment was approved by the Office for National Statistics (ONS) Research Accreditation Panel. Participants gave informed consent to participate in the study before taking part.
留言 (0)