
記住我


The coronavirus disease (COVID-19) pandemic and associated public health responses (eg, shelter-in-place orders) and subsequent supply chain disruptions have acutely exacerbated pre-existing food insecurity and potentially contributed to worsening nonadherence to nutritional recommendations among at-risk individuals nationally.1,2 Furthermore, older adults and those with multimorbidity are at higher risk for food insecurity, lower diet quality and associated worse health status, and excess resource utilization.2–5
These challenges, combined with the growing national burden of diet-related chronic diseases, have prompted efforts in collaboration with health care providers to develop food-based and nutrition-based interventions based on the hypothesis of “food is medicine.”6 Providing medically tailored meals (MTMs) at no or low cost is considered an intervention focused on high-risk patients with one or more complex chronic conditions who may have difficulty accessing or preparing nutritious food. Certain common conditions such as heart failure, diabetes, and chronic kidney disease are considered nutrition sensitive and associated with adverse clinical outcomes and reduced quality of life, but few randomized controlled trial (RCT) data exist about whether providing MTMs may translate to better clinical outcomes.6,7 Although some states have conducted pilot programs of providing MTMs to low-income adults with heart failure8 along with expanding Medicaid-covered benefits for MTMs in selected populations with chronic conditions in 2022,9 there is a pressing need for more rigorous evidence to guide use of these resource-intensive services and especially in situations where patients may be more vulnerable such as being discharged home after an acute hospitalization.10
To address these knowledge gaps, we conducted a remote, decentralized pragmatic RCT of MTMs compared with usual care on postdischarge outcomes among high-risk hospitalized adults receiving care within an integrated health care delivery system during the COVID-19 pandemic.
METHODS Trial Design and OversightThe Kaiser Permanente Evaluation of Medically Tailored Meals in Adults With Chronic Medical Conditions at High Readmission Risk (KP NOURISH) study was a parallel-group, pragmatic RCT. The trial protocol (see Protocol, Supplemental Digital Content 1, https://links.lww.com/MLR/C499) and statistical analysis plan (see SAP, Supplemental Digital Content 2, https://links.lww.com/MLR/C500) were designed by the trial investigators. The Kaiser Permanente Northern California (KPNC) Institutional Review Board approved the trial, and all participants provided verbal informed consent. The funder was Kaiser Permanente (Oakland, CA).
The executive committee developed the protocol and statistical analysis plan, oversaw recruitment of participants, supervised data analysis, and provided interpretation of the results. The team based at the KPNC Division of Research was responsible for the data collection and storage. The authors made the decision to submit the manuscript for publication, assume full responsibility for accuracy and completeness of the data, and attest to the fidelity of the trial to the protocol (see Protocol, Supplemental Digital Content 1, https://links.lww.com/MLR/C499). The trial was retrospectively registered in ClinicalTrials.gov (NCT05166525) on December 8, 2021, and the authors confirm there were no changes to the protocol or SAP before or after participant enrollment began on April 27, 2020.
ParticipantsAll participants were enrolled within KPNC, an integrated health care delivery system currently providing comprehensive care to >4.5 million members at 21 medical centers and >260 offices. KPNC membership is highly representative of the statewide population in terms of age, sex, race/ethnicity, and socioeconomic status.11
Between April 27, 2020, and June 9, 2021, we identified adult (age ≥18 y) members hospitalized at 5 KPNC medical centers who had a documented history of heart failure12 or diabetes13 based on previously validated electronic health records (EHR)-based algorithms14–16 using diagnosis codes, laboratory results and medications (see eTable 1, Supplemental Digital Content 3, https://links.lww.com/MLR/C501, for International Classification of Diseases, Tenth Edition diagnosis codes and specific criteria), or chronic kidney disease (defined as ≥2 preadmission estimated glomerular filtration rate17 values between 30 and 45 mL/min/1.73 m2, with the most recent value ≥30 mL/min/1.73 m2).18 Patients with a history of organ transplant, admitted from a skilled nursing facility or nursing home, homeless at admission, or whose home residence was outside the geographic area covered by the participating MTMs vendors were excluded. Potentially eligible participants were identified daily through the EHR, had their eligibility manually confirmed by study staff, and then prerandomized19 before hospital discharge within each medical center using a SAS software-based randomization algorithm to be approached for receiving the MTMs intervention on top of usual care or usual care alone. Patients assigned to the MTMs intervention arm were further randomized after obtaining informed consent in a 1:1 ratio to be offered virtual nutritional counseling sessions in addition to MTMs. Patients with a planned discharge to home were subsequently contacted by phone while in the hospital to confirm eligibility and to obtain verbal consent.
InterventionThe intervention involved providing up to 10 weeks of MTMs that were initiated within 7 days after discharge. Meals were delivered to the participant and eligible household members by collaborating MTMs vendors, with 1 large meal per day per person. Nutritional recommendations were based on Food is Medicine Coalition standards that were supported by national guidelines and consistent with KPNC nutritional guidelines tailored to heart failure, diabetes, and chronic kidney disease (see eTable 2, Supplemental Digital Content 3, https://links.lww.com/MLR/C501).20 Given how frequently diabetes and chronic kidney disease co-occur in patients with heart failure, MTMs prioritized nutritional standards for heart failure first, followed by those for diabetes and then for chronic kidney disease, if present. Although sodium restriction has been a key focus in patients with heart failure, there remains controversy about the optimal daily limit given the limited RCT data in the context of different types of heart failure, concomitant use of diuretics, and other factors.21–26 Our MTMs targeted an average sodium intake of 2000–3000 mg/d that was further adjusted toward <2300 mg/d if diabetes or chronic kidney disease was present. In general, the remaining components (eg, percentage of total calories from saturated fat and daily protein, cholesterol, and fiber intake) of the MTMs followed the DASH diet, which emphasizes vegetables, whole grains, lower fat and saturated fat, and lean proteins.27 Participants in the MTMs arm who were randomized to receive nutritional counseling were offered up to 3 virtual nutritional counseling sessions over 10 weeks provided by a registered dietician nutritionist, with content consistent with national and KPNC practice guidelines and educational resources. Participants enrolled at Kaiser Permanente Santa Clara, Oakland and San Francisco medical centers were provided MTMs and nutritional counseling by Project Open Hand (San Francisco, CA), and participants enrolled at Kaiser Permanente Santa Rosa and San Rafael medical centers were provided MTMs and nutritional counseling by Ceres Community Project (Santa Rosa, CA).
Follow-up and OutcomesAll participants were followed through 90 days after hospital discharge. The primary outcome was all-cause hospitalization based on comprehensive EHR data. Secondary outcomes included hospitalization for heart failure, hospitalization for a diabetes-related complication, all-cause death, all-cause emergency department visits, and a composite of all-cause hospitalization, emergency department visit, and death. Hospitalizations attributed to heart failure or a diabetes-related complication were defined based on a primary discharge diagnosis using previously validated International Classification of Diseases, Tenth Edition codes (see eTable 1, Supplemental Digital Content 3, https://links.lww.com/MLR/C501).28 Emergency department visits not leading to hospitalization were identified from EHR data. All network and out-of-network hospitalizations or emergency department visits were comprehensively captured through EHR and billing claims data. Investigators and study staff were blinded to utilization outcome assessment. We identified deaths in an inpatient or emergency department setting from EHR data and outpatient deaths by manual review of medical records and proxy reporting from follow-up calls conducted by study staff.
Statistical AnalysisAnalyses were conducted using SAS, version 9.4 (Cary, NC). Assuming a conservative rate of 10 per 100 person-years for 90-day readmission for any cause in the usual care group, we determined a priori that 2000 enrolled participants (1000 receiving MTMs, 1000 receiving usual care) would provide 80% power for a minimally detectable hazard ratio of 0.68 with a 2-sided α of 0.05, corresponding to an estimated 32% relative reduction in risk of any hospitalization with MTMs. All analyses were conducted based on the intention-to-treat principle. We compared baseline characteristics by group using standardized differences. We also compared characteristics between participants who enrolled and those who refused participation (see eTable 3, Supplemental Digital Content 3, https://links.lww.com/MLR/C501).28 For all outcomes, we calculated cumulative incidence curves and estimated cause-specific hazard ratios and 95% confidence intervals (CIs) from Cox proportional hazards models that adjusted29 for medical center, predicted readmission risk score,30 multimorbidity burden,31 and active COVID-19 infection. Missing values of covariates included in models were imputed with the median value from the overall sample. Exploratory analyses of hospitalizations for heart failure and hospitalizations for a diabetes-related complication were performed in participants with known heart failure and diabetes, respectively. To account for potential competing risk of death, we performed Fine-Gray subdistribution hazard models for all utilization outcomes.32 Finally, in an exploratory analysis to evaluate the incremental effect of virtual nutritional counseling among those receiving MTMs, we calculated cause-specific hazard ratios and 95% CIs for outcomes comparing MTMs plus virtual nutritional counseling with MTMs alone. Given our prespecified hypotheses, no adjustments for multiple comparisons were made.
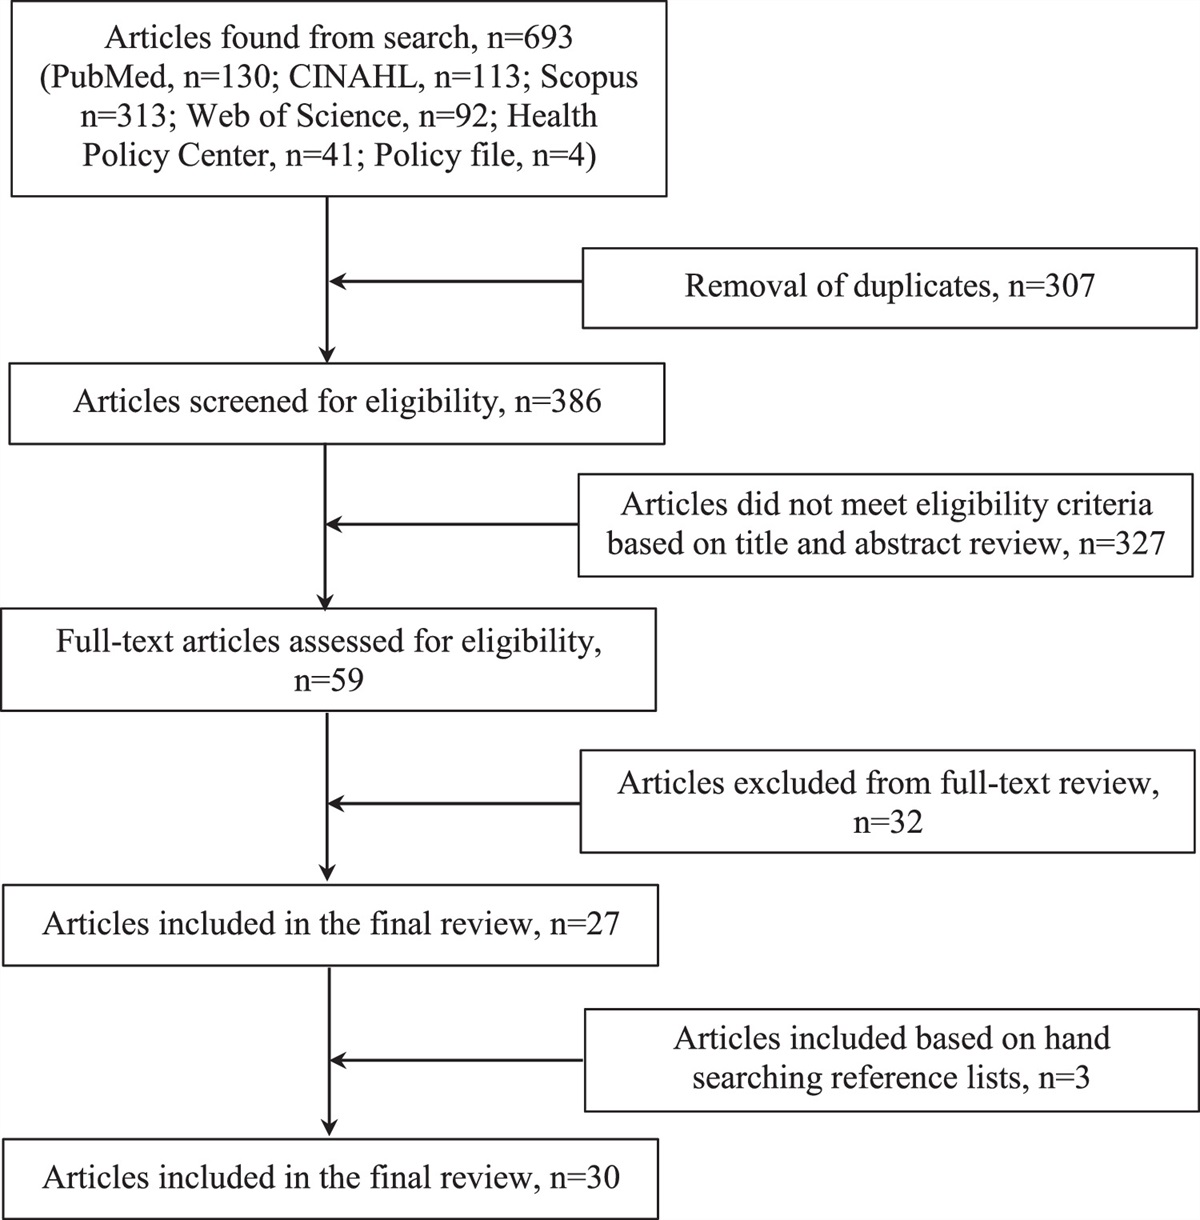
RESULTS PatientsOverall, between April 27, 2020, and June 9, 2021, 2445 prerandomized hospitalized patients were approached, with participation refusal in 298 (23%) of those assigned to MTMs and 147 (13%) of those assigned to usual care, resulting in the target 1000 participants enrolled in each arm (Fig. 1). Comparison of characteristics between enrolled participants and those who refused are described in eTable 3, Supplemental Digital Content 3, https://links.lww.com/MLR/C501. Among enrolled participants, 23 patients who died before hospital discharge (7 in the MTMs group, 16 in the usual care group) were subsequently excluded, leading to a final analytic sample of 1977 participants.
 FIGURE 1:
 Randomization, enrollment, and treatment.
Overall, mean (SD) age was 68.4 (14.6) years, 45.2% were women, 11.5% were Black, 13.8% were Asian or Pacific Islander, and 16.5% were Hispanic. Heart failure was present in 32.4%, diabetes in 68.8%, and chronic kidney disease in 44.9% of participants. In addition, 9.2% had active COVID-19 infection at enrollment. Baseline characteristics were similar between groups, although predicted readmission risk and multimorbidity burden were higher in those assigned to MTMs compared with those assigned to usual care (Table 1). Participants in the MTMs group received a mean (SD) 6.9 (4.1) weeks of meals, with 53.5% receiving all 10 weeks of meals. Of note, those who received more than 5 weeks of meals were younger, less likely to be White or to have Medicare insurance, had lower median annual household income, lower predicted readmission risk and comorbidity burden, lower mean index hospitalization length of stay, and higher mean body mass index compared with those who received ≤5 weeks of meals (see eTable 4, Supplemental Digital Content 3, https://links.lww.com/MLR/C501).
TABLE 1 - Characteristics of 1977 Participants Who Were Alive at Discharge From the Index Hospitalization Variable Medically Tailored Meals (N=993) Usual Care (N=984) Standardized Difference Mean (SD) age (y) 68.2 (14.6) 68.5 (14.6) 0.02 Self-reported sex, n (%) — — 0.06 Men 516 (52.0) 567 (57.6) Women 477 (48.0) 416 (42.3) Nonbinary 0 1 (0.1) Self-reported race/ethnicity (not mutually exclusive), n (%) White 614 (61.8) 627 (63.7) 0.02 Black 119 (12.0) 109 (11.1) 0.01 Asian/Pacific Islander 134 (13.5) 138 (14.0) 0.01 American Indian/Alaska Native 25 (2.5) 19 (1.9) 0.02 Hispanic/Latino 185 (18.6) 142 (14.4) 0.06 Decline to state 4 (0.4) 5 (0.5) 0.01 Medicare insurance 668 (67.3) 662 (67.3) 0 Medicaid insurance 67 (6.7) 59 (6.0) 0.02 Median household income for census tract, dollars/year, mean (SD) 88,455 (34,923) 91,082 (37,782) 0.07 Median household income for census tract <$35,000/y, n (%) 31 (3.1) 31 (3.2) 0 Low educational attainment for census tract (>25% with less than high school education), n (%) 134 (13.5) 122 (12.4) 0.02 Neighborhood deprivation index, mean (SD) −0.4 (0.8) −0.5 (0.7) 0.05 Qualifying condition (not mutually exclusive), n (%) Heart failure 316 (31.8) 325 (33.0) 0.01 Diabetes mellitus 671 (67.6) 689 (70.0) 0.03 Chronic kidney disease 434 (43.7) 453 (46.0) 0.02 Index hospitalization characteristics Hospitalized with COVID-19, n (%) 71 (7.2) 111 (11.3) 0.07 Median (q1, q3) length of stay, days 4.0 (3.0, 6.0) 4.0 (3.0, 6.0) 0.03 Major discharge diagnosis category, n (%) — — 0.08 Circulatory 301 (30.3) 329 (33.4) — Infectious 164 (16.5) 170 (17.3) — Respiratory 128 (12.9) 140 (14.2) — Digestive 102 (10.3) 76 (7.7) — Musculoskeletal 48 (4.8) 53 (5.4) — Kidney/urinary 40 (4.0) 30 (3.0) — Endocrine/metabolic 39 (3.9) 36 (3.7) — Hepatobiliary 39 (3.9) 32 (3.3) — Pregnancy 35 (3.5) 24 (2.4) — Nervous system 33 (3.3) 26 (2.6) — Skin/breast 20 (2.0) 18 (1.8) — Other 44 (4.4) 50 (5.1) — Mean (SD) laboratory-based acute physiology score 68.4 (34.1) 65.7 (34.5) 0.08 Missing, n (%) 11 (1.1) 4 (0.4) — Mean (SD) predicted readmission risk score 15.7 (9.6) 14.7 (9.0) 0.11 Missing, n (%) 30 (3.0) 25 (2.5) — Mean (SD) comorbidity point score 44.9 (34.0) 40.1 (30.6) 0.15 Missing, n (%) 1 (0.1) 0 — Other prior medical history, n (%) Acute myocardial infarction 73 (7.4) 63 (6.4) 0.02 Coronary artery bypass surgery 54 (5.4) 60 (6.1) 0.01 Percutaneous coronary intervention 93 (9.4) 94 (9.6) 0 Mitral or aortic valvular disease 138 (13.9) 139 (14.1) 0 Atrial fibrillation or flutter 254 (25.6) 251 (25.5) 0 Ventricular tachycardia or fibrillation 15 (1.5) 19 (1.9) 0.02 Ischemic stroke or transient ischemic attack 43 (4.3) 34 (3.5) 0.02 Venous thromboembolism 103 (10.4) 95 (9.7) 0.01 Hypertension 724 (72.9) 723 (73.5) 0.01 Dyslipidemia 844 (85.0) 837 (85.1) 0 Current smoker 67 (6.7) 61 (6.2) 0.04 Hospitalized bleed 67 (6.7) 44 (4.5) 0.05 Hyperthyroidism 41 (4.1) 32 (3.3) 0.02 Hypothyroidism 176 (17.7) 171 (17.4) 0 Chronic liver disease 102 (10.3) 87 (8.8) 0.02 Chronic lung disease 364 (36.7) 334 (33.9) 0.03 Diagnosed depression 241 (24.3) 197 (20.0) 0.05 Diagnosed dementia 12 (1.2) 26 (2.6) 0.05 Preadmission vital signs Body mass index, kg/m2 31.9 (8.5) 32.0 (8.4) 0.02 Missing, n (%) 21 (2.1) 51 (5.2) — Systolic blood pressure (mm Hg) 126.5 (16.7) 128.6 (16.4) 0.13 Missing, n (%) 26 (2.6) 54 (5.5) — Inpatient laboratory values, mean (SD) Hemoglobin (g/dL) 11.3 (2.2) 11.5 (2.2) 0.12 Missing, n (%) 9 (0.9) 11 (1.1) — Serum creatinine (mg/dL) 1.0 (0.4) 1.0 (0.4) 0.03 Missing, n (%) 22 (2.2) 23 (2.3) — Blood urea nitrogen (mg/dL) 21.5 (12.4) 21.9 (12.2) 0.03 Missing, n (%) 36 (3.6) 36 (3.7) —COVID-19 indicates coronavirus disease.
No participants were lost to follow-up. Readmission for any cause at 90-days post discharge occurred in 270 (27.2%) participants receiving MTMs and in 242 (24.6%) receiving usual care (risk difference: 2.6%, 95% CI, −1.3% to 6.5%) (Fig. 2A, Table 2). After adjustment for predicted readmission risk score, multimorbidity burden, and COVID-19 status, the cause-specific hazard ratio for MTMs compared with usual care was 1.02 (95% CI, 0.86–1.21), and the subdistribution hazard ratio accounting for competing risk of death was 1.02 (95% CI, 0.86–1.22) (Table 2).
 FIGURE 2:
 Cumulative incidence curves of primary and secondary outcomes.
TABLE 2 - Primary and Secondary Outcomes for Medically Tailored Meals Versus Usual Care Outcome No. Participants No. Events Risk (95% CI) Risk Difference, % (95% CI) Unadjusted Cause-specific Hazard Ratio (95% CI) Adjusted Cause-specific Hazard Ratio (95% CI) Adjusted Subdistribution Hazard Ratio (95% CI) Primary outcome: all-cause hospitalization at 90 d postdischarge Medically tailored meals 993 270 27.1 (24.4, 30.1) 2.6 (−1.3, 6.5) 1.12 (0.95, 1.34) 1.02 (0.86, 1.21) 1.02 (0.86, 1.22) Usual care 984 242 24.6 (21.9, 27.4) — — — — Secondary outcomes at 90 d post discharge Hospitalization for heart failure Medically tailored meals 316 25 7.9 (5.2, 11.5) −5.3 (−10.0, −0.6) 0.57 (0.35, 0.94) 0.52 (0.32, 0.86) 0.53 (0.32, 0.87) Usual care 325 43 13.2 (9.7, 17.4) — — — — Hospitalization related to diabetes Medically tailored meals 671 8 1.2 (0.5, 2.3) −0.4 (−1.7, 0.8) 0.68 (0.27, 1.70) 0.64 (0.26, 1.58) 0.67 (0.27, 1.64) Usual care 689 11 1.6 (0.8, 2.8) — — — — Emergency department visit from any cause Medically tailored meals 993 212 21.4 (18.8, 24.0) 0.0 (−3.6, 3.6) 0.98 (0.81, 1.18) 0.93 (0.77, 1.13) 0.96 (0.80, 1.17) Usual care 984 210 21.3 (18.8, 24.0) — — — — Death from any cause Medically tailored meals 993 41 4.1 (3.0, 5.6) −1.3 (−3.1, 0.6) 0.75 (0.50, 1.13) 0.64 (0.43, 0.97) NA Usual care 984 53 5.4 (4.1, 7.0) — — — — Composite of all-cause death and utilization Medically tailored meals 993 389 39.2 (36.1, 42.3) −1.0 (−5.3, 3.3) 0.97 (0.85, 1.12) 0.88 (0.77, 1.02) NA Usual care 984 395 40.1 (37.0, 43.3) — — — —Hazard ratios are adjusted for predicted readmission risk score, multimorbidity burden, and active COVID-19 infection during the index hospitalization.
CI indicates confidence interval.
Among participants with heart failure, 316 received MTMs and 325 received usual care (see eTable 5, Supplemental Digital Content 3, https://links.lww.com/MLR/C501). After adjustment for predicted readmission risk score, multimorbidity burden, and COVID-19 status, receipt of MTMs was associated with a lower 90-day risk of hospitalization for heart failure [adjusted hazard ratio (aHR): 0.52, 95% CI, 0.32–0.86] (Fig. 2B, Table 2). Among participants with diabetes, 671 received MTMs and 689 received usual care (see eTable 6, Supplemental Digital Content 3, https://links.lww.com/MLR/C501). Receipt of MTMs was not associated with 90-day risk of diabetes-related hospitalization (aHR: 0.64, 95% CI, 0.26–1.58) (Fig. 2C, Table 2).
No differences were seen between groups in all-cause emergency department visits, affecting 21.4% of participants receiving MTMs and 21.6% participants receiving usual care (aHR: 0.93, 95% CI, 0.77–1.13) (Fig. 2D, Table 2).
Fewer participants receiving MTMs died (4.1%) than participants receiving usual care (5.4%) (aHR: 0.64, 95% CI, 0.43–0.97) (Fig. 2E, Table 2). The 90-day incidence of the composite outcome of utilization and death was lower in participants receiving MTMs compared with those receiving usual care, but the difference was not statistically significant (aHR: 0.88, 95% CI, 0.77–1.02) (Fig. 2F, Table 2).
Among 993 participants receiving MTMs, 497 were randomized to receive additional virtual nutritional counseling. Of these, 57% completed at least 1 session and 16% completed all 3 sessions. Characteristics between those randomized to MTMs with nutritional counseling and those randomized to MTMs alone were similar (see eTable 7, Supplemental Digital Content 3, https://links.lww.com/MLR/C501). In multivariable analyses, there was no association between assignment to receive virtual nutritional counseling and 90-day utilization or death (see eTable 8, Supplemental Digital Content 3, https://links.lww.com/MLR/C501).
Full model results for primary and secondary outcomes are shown in eTable 9, Supplemental Digital Content 3, https://links.lww.com/MLR/C501.
DISCUSSIONAmong a large, ethnically diverse population of adults with heart failure, diabetes, or chronic kidney disease hospitalized during the COVID-19 pandemic and discharged to home, receipt of up to 10 weeks of MTMs did not affect the primary outcome of risk of any readmission during the 90 days after discharge compared with usual care. For exploratory outcomes, compared with those assigned to usual care, those assigned to receive MTMs experienced no significant difference in 90-day risk of an emergency department visit for any cause but did experience lower all-cause mortality. In additional exploratory subgroup analyses, compared with usual care, MTMs were linked to a lower risk of admission for heart failure in those with known heart failure, but there was no benefit observed with regard to the risk of a diabetes-related admission in those with diabetes. Finally, assignment to receive virtual nutritional counseling sessions in addition to MTMs did not incrementally impact subsequent 90-day resource utilization or survival.
Although the postdischarge period is recognized as a particularly vulnerable time for many patients with serious medical conditions that are exacerbated by nutritional challenges10,33 and the ongoing pandemic, very limited RCT data exist about the value of MTMs in recently hospitalized adults.6,34 In the Meals Enhan
留言 (0)