
記住我
We developed a mouse model, entitled repro-transformable, to conditionally induce reprogramming or transformation in the same population of cells (Fig. 1a). OSKM was selected as the prototypical cocktail of reprogramming4,30,31,32. The cooperation between K-rasG12D and c-Myc was chosen as it triggers MEF transformation18,25,26. R26rtTA;Col1a14F2A mice33 carrying an inducible OSKM cassette were crossed with LSL-K-rasG12D;R26cre-ERT2 mice harbouring an excisable K-rasG12D allele34 and MEFs were derived (Fig. 1a). Doxycycline treatment led to the formation of iPS colonies (15 days (d); efficiency = 0.21 ± 0.1%) expressing Nanog and Ssea1 (Fig. 1b) and capable of undergoing multilineage differentiation in teratomas (Fig. 1c). Tamoxifen treatment to induce K-rasG12D, combined with c-Myc expression (Fig. 1a), triggered transformation after serial passaging (30 d). Foci assays indicated clonal loss of contact inhibition (efficiency = 0.66 ± 0.3%) (Extended Data Fig. 1a). Soft agar assays revealed the acquisition of anchorage-independent growth potential (Extended Data Fig. 1b). Injection of transformed cells (TC) into mice led to the formation of liposarcoma-like tumours (Fig. 1d).
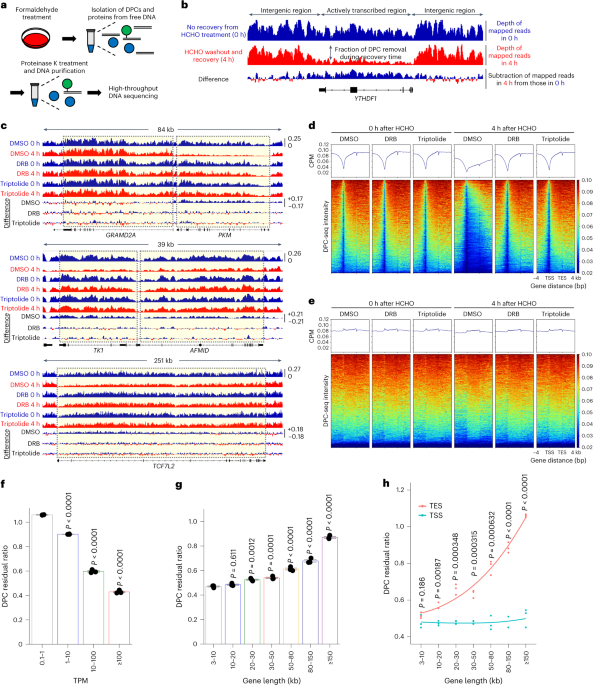
Fig. 1: Comparing single-cell trajectories of reprogramming and transformation.
a, Schematic of the repro-transformable mouse model. Reprogramming (repro; doxycycline-induced OSKM expression) or transformation (transfo; tamoxifen-induced K-rasG12D expression combined with c-Myc overexpression) gave rise to iPS cells or transformed cells (TCs), respectively. b, Immunofluorescence staining of repro-induced iPS cells for Ssea1 and Nanog. Scale bar, 100 µm. c, Histological analysis of teratomas derived from iPS cells. Scale bar, 1 mm. d, Tumour generated by transformed cells injected into nude mice. Scale bar, 0.2 mm. e, Proliferation curves of MEFs upon induction of repro, transfo and repro plus transfo. The data from one representative experiment out of two are shown. f,g, T-SNE visualization of scRNA-Seq profiles integrating the replicate values of 30,146 preprocessed cells (individual dots), corresponding to two biological replicates run in one sequencing experiment. The cells are coloured by sample (f) or by cluster (g). h,i, Diffusion maps of scRNA-Seq profiles where the cells are coloured by sample (h) or by cluster (i). The trajectories defined by Slingshot are represented by red (repro) and blue lines (transfo). The intersection area is indicated by a red box. j, Composition of samples in the intersection area. k,l, Patterns of the MEF identity signature score using gene lists from Schiebinger et al.13, with the score represented on the diffusion map (k) or on the calculated pseudotime trajectories (l).
This model provides a unique opportunity to compare reprogramming and transformation in a genetically matched manner. We showed that MEF proliferation increased in response to both processes and this effect was cumulative (Fig. 1e). Next, we evaluated the impact of 3 d of reprogramming or transformation on DNA damage. As expected, K-rasG12D/c-Myc triggered the formation of γH2AX phosphorylation foci in 45.1 ± 10.0% of cells (Extended Data Fig. 1c,d) and similar results were obtained with other oncogenic events, including p53 depletion and H-rasG12V expression (Extended Data Fig. 1e). Conversely, reprogramming did not significantly induce γH2AX foci. Moreover, when both processes were simultaneously induced, OSKM significantly prevented γH2AX foci formation triggered by K-rasG12D/c-Myc (Extended Data Fig. 1c,d). A preventive effect of OSKM was also observed on the changes of cell cycle features but not on apoptosis induced by K-rasG12D/c-Myc (Extended Data Fig. 1f–i). Altogether, we identified similar and divergent responses to reprogramming and transformation, as well as a preventive action of OSKM on cell cycle and DNA damage induced by K-rasG12D/c-Myc.
Single-cell trajectories of reprogramming and transformationNext, we compared the cellular trajectories of reprogramming and transformation. Single-cell RNA sequencing (scRNA-Seq) was conducted on MEFs either left untreated or induced for 5 or 10 d of reprogramming or transformation, as well as on fully reprogrammed (iPS) and transformed cells (TCs). After preprocessing 30,146 cells, principal component analysis (PCA) and t-distributed stochastic neighbour embedding (t-SNE) defined 12 clusters of cells (Extended Data Fig. 1j,k). To focus on the early dynamics, we defined eight clusters by excluding the iPS and transformed cell samples (Fig. 1f,g). Diffusion maps35 and Slingshot36 were used to establish pseudo-temporal ordering of cells in a high-dimensional gene expression space and to infer the cellular trajectories (Fig. 1h,i). This unveiled that single reprogramming and transforming cells (mainly from clusters 3, 4, 7 and 8) intersect within a reprogramming–transformation area before they bifurcate (Fig. 1i,j), suggesting the existence of shared transcriptomic features. Single-sample gene set enrichment analysis37 was used next to compute activity scores for different pathways. The use of two independent scores12,13 revealed a progressive decrease in MEF identity in cells progressing into reprogramming and transformation trajectories, as well as in iPS and transformed cells (Fig. 1k,l and Extended Data Fig. 1l–n). In contrast, proliferation was modulated mainly independently of the trajectories (Extended Data Fig. 1o). Collectively, we unveiled an early intersection between the trajectories of reprogramming and transformation that suggests the existence of molecular similarities in individual cells.
Bcl11b hinders reprogramming, transformation and transdifferentiationThe scRNA-Seq dataset constitutes a unique tool to identify somatic barriers. By computing marker genes of each cluster, we identified 150 genes expressed predominantly in MEFs (clusters 1 and 2 (C1 and C2, respectively)) (Fig. 2a and Supplementary Table 1). Gene set enrichment analysis (PantherDB) highlighted enrichment for embryo development and transcription regulation (Fig. 2b). Among them, we identified the glycoprotein Thy1, which has already been reported as a MEF marker during reprogramming6. We assessed whether Thy1 levels correlated with reprogramming and immortalization potential. For reprogramming, Thy1low and Thy1high cells were sorted by fluorescence-activated cell sorting (FACS) after 5 d of OSKM induction and replated at similar densities. Thy1low cells formed significantly more alkaline phosphatase-positive (AP+) iPS colonies than Thy1high cells, as reported previously6,15 (Extended Data Fig. 2a,b). For transformation, with a similar sorting (5 d post K-rasG12D/c-Myc induction), Thy1low cells formed fourfold more foci than Thy1high cells (Extended Data Fig. 2c,d). Even if the observed differences are limited, Thy1 can be used to slightly enrich fractions of cells prone to reprogramming and transformation.
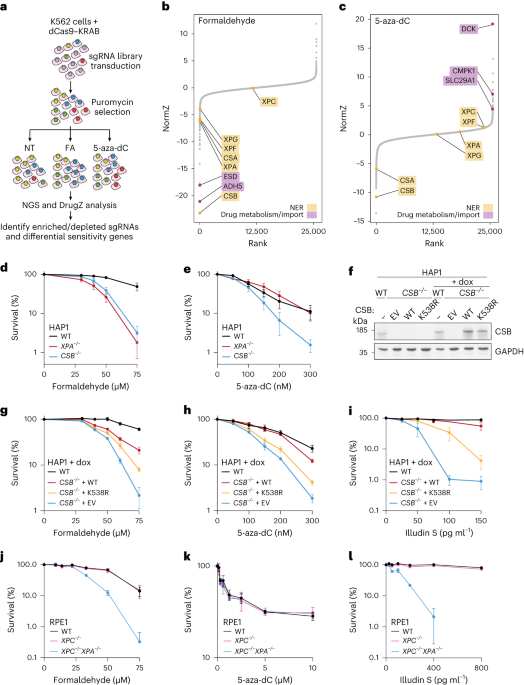
Fig. 2: Bcl11b broadly constrains cell fate changes.
a, Patterns of the gene signature score composed of 150 genes enriched in C1 and C2 on the diffusion map. The graph integrates the 30,146 preprocessed cells of two biological replicates that were run in one sequencing experiment. b, Statistical over-representation assays conducted with PantherDB on the gene signature. c, Patterns of Thy1 and Bcl11b transcript levels on the diffusion map. d, Western blot for Bcl11b in MEFs, Thy1low and Thy1high cells after 5 d of reprogramming and transformation. e, Top, experimental design. Bottom, pictures of soft agar colonies, representative of four independent experiments. f, Colony quantification (n = 4 independent experiments). g, Top, experimental design. Bottom, pictures of iPS colonies stained for AP. Dox, doxycycline. h, Colony quantification (n = 3 independent experiments). i, Pou5f1+ colony quantification (n = 3 independent experiments). j, Pictures depicting the histological analysis of teratomas. Two independent teratomas were analysed per cell line. Scale bars, 1 mm. k, Top, experimental design. Bottom, pictures depicting mouse T cells and iPS cells obtained following reprogramming. cKO, conditional knockout; Tamox, tamoxifen. Scale bars, 120 µm. l, Colony quantification (n = 2 independent experiments). m, Top, experimental design. Bottom, pictures of MAP2+ neural progenitors. Scale bars, 100 µm. n, MAP2+ cell quantification (n = 2 independent experiments). o, Venn diagram showing the numbers of differentially expressed genes in control versus Bcl11b KD MEFs (orange) and control versus Bcl11b OE MEFs (blue) (log2[FC] < −0.5 or >0.5; adjusted P value < 0.05). p, Distribution of endogenous Bcl11b peaks in relation to genes. UTR, untranslated region. q, Distribution of Bcl11b peaks in relation to the TSS. kb, kilobases. TSS, transcription start site. r, Most enriched DNA-binding motifs associated with Bcl11b derived from a de novo motif analysis (MEME). s, Graph presenting the distribution of Bcl11b peaks on genes deregulated by Bcl11b modulation in MEFs (differentially expressed genes in Bcl11b KD and Bcl11b OE versus control MEFs. t, Western blot depicting Bcl11b and ERK1/2 levels in Control and Bcl11b KD MEFs. In f, h and i, the data represent means ± s.d. Statistical significance was determined by Fisher’s exact two-sided test (b) or two-tailed Student’s t-test (f, h and i).
Among the identified candidates, we selected the TF Bcl11b, which was previously described as a cellular identity gatekeeper in haematopoiesis, for further investigation (Fig. 2c)38. We showed that Bcl11b expression is high in MEFs, specifically decreased in Thy1low cells during reprogramming and transformation, and silenced in iPS and transformed cells (Fig. 2d and Extended Data Fig. 2e). Interrogation of published datasets broadened Bcl11b downregulation to keratinocyte reprogramming (Extended Data Fig. 2f).
First, we investigated Bcl11b function during transformation. Bcl11b downregulation by RNA interference (Bcl11b knockdown (KD)) (Extended Data Fig. 2g,h), before the induction of transformation, significantly increased the efficiency of soft agar colony formation. In contrast, Bcl11b overexpression (Bcl11b OE) severely hindered the process, indicating that a tight Bcl11b level safeguards MEFs from transformation (Fig. 2e,f). Similar results were obtained in foci assays (Extended Data Fig. 2i,j). Next, we assessed Bcl11b function during reprogramming. Bcl11b KD significantly improved the efficiency of generation of AP+ but also Pou5f1-GFP+ iPS colonies (Fig. 2g–i). Similar results were obtained using Bcl11b conditional KO MEFs (Extended Data Fig. 2k,l). However, Bcl11b OE did not negatively impact the reprogramming efficiency (Fig. 2g,h). Of note, Bcl11b KD iPS cell lines were capable of forming three germ layers in teratoma (Fig. 2j), indicating that Bcl11b loss is compatible with the acquisition of multilineage differentiation potential. Because Bcl11b is expressed in T lymphocytes39, T cells isolated from mice conditional KO for Bcl11 were induced to reprogramme (Fig. 2k). Bcl11b depletion triggered the formation of twofold more AP+ iPS colonies (Fig. 2k,l). In addition, Bcl11b KD, before the induction of MEF transdifferentiation into neurons, significantly improved the efficiency of generation of MAP2+ cells (Fig. 2m,n)40.
Next, we combined RNA-Seq and chromatin immunoprecipitation sequencing (ChIP-Seq) assays to identify the gene regulatory network (GRN) controlled by Bcl11b. Transcriptomic analyses of Bcl11b KD and Bcl11B OE MEFs led, respectively, to the identification of 774 and 321 deregulated genes compared with control MEFs (adjusted P value < 0.05; log2[fold change (FC)] > 0.5 or <−0.5) (Fig. 2o). Bcl11b ChIP-Seq identified 7,430 specific peaks located mainly in the vicinity of genes (<10 kilobases from the transcription start site (TSS)) with enrichment for an Elk motif (Fig. 2p–r). Among the 979 genes deregulated by Bcl11b, 122 (12.4%) presented a Bcl11b-specific peak (Fig. 2s). Moreover, while MEF identity was not significantly impacted by Bcl11b deregulation (Extended Data Fig. 2m), we noticed that several Bcl11b targets were associated with the Mapk pathway, such as Calponin-1 and Bmf41,42. In line with this, we unveiled that Bcl11b constrains phospho-Erk1/2 levels in MEFs, potentially explaining its barrier role during reprogramming43 (Fig. 2t). Altogether, we demonstrated that Bcl11b regulates reprogramming, transformation and transdifferentiation, as well as a specific GRN and phospho-Erk1/2 levels.
Bcl11b faithfully indicates reprogramming and transforming potentialNext, we investigated whether Bcl11b could be used as a marker to track cells changing fate using Bcl11b-tdTomato reporter MEFs (Extended Data Fig. 2n)38. FACS analysis confirmed that the majority of MEFs expressed Bcl11b-tdTomato. However, after 5 d of reprogramming or transformation, a subset of Bcl11blow cells emerged (Extended Data Fig. 2o). Bcl11blow cells, sorted at day 5 of reprogramming, formed sevenfold more AP+ iPS colonies than Bcl11bhigh cells (Extended Data Fig. 2p,q). Bcl11blow cells, sorted at day 5 of transformation, formed immortalized foci with a tenfold higher efficiency than Bcl11bhigh cells (Extended Data Fig. 2r,s). Collectively, these results identify Bcl11b as a MEF marker whose downregulation faithfully reflects the ability of cells to engage into pluripotency or immortalization paths.
Capture of early cellular intermediates using Bcl11b and Thy1Our scRNA-Seq analysis did not allow the interrogation of the functional features of individual cells4,18. Therefore, we attempted to design a strategy to isolate early cellular intermediates using FACS. Most reprogramming strategies combined the downregulation of a MEF marker with the activation of a pluripotent factor6,15,44,45,46. However, as we aimed to capture cells emerging during both reprogramming and transformation, the use of pluripotent markers was not possible. We noticed, in contrast, that the downregulation of Bcl11b and Thy1 was not occurring in the same cells during reprogramming and transformation (Fig. 2c) and in published OSK-mediated reprogramming dataset (Extended Data Fig. 3a)14. This finding was confirmed by the visualization of four subpopulations of cells (Bcl11bhigh/Thy1high (BHTH), Bcl11bhigh/Thy1low (BHTL), Bcl11blow/Thy1high (BLTH) and Bcl11blow/Thy1low (BLTL)) on the diffusion map or trajectories (Fig. 3a and Extended Data Fig. 3b). This result prompted us to investigate whether the combined downregulation of Bcl11b and Thy1 can be used to capture cellular intermediates by FACS. We profiled Bcl11b and Thy1 changes during reprogramming and transformation using Bcl11b-tdTomato MEFs (Fig. 3b). To begin with a homogeneous population, BHTH MEFs were FACS sorted to purity. In the absence of reprogramming or transformation, MEFs stably maintained a BHTH phenotype (Extended Data Fig. 3c,d). By day 17 of both processes, most cells displayed Bcl11b and Thy1 downregulation, as expected (Fig. 3b). However, rare BLTL cells emerged as early as 3 d after the induction of reprogramming (R-BLTL) and transformation (T-BLTL) (Fig. 3b). We demonstrated that R-BLTL and T-BLTL cells were respectively highly prone to forming iPS (Fig. 3c) or immortalized (Fig. 3d) colonies compared with R-BHTH and T-BHTH cells that remained heavily refractory. Next, we assessed the emergence of BLTL cells with alternative molecular cocktails that did not rely on c-Myc. BLTL cells emerged during reprogramming induced by Sall4-Nanog-Esrrb-Lin28 (ref. 5) or by Oct4-Sox2-Klf4-Wnt inhibitor IWP2 (ref. 47). BLTL cells also emerged during transformation induced by cyclin E, H-RasG12V and p53 depletion (Fig. 3e and Extended Data Fig. 3e). In addition, BLTL cells were found to emerge during reprogramming and transformation of mouse adult ear fibroblasts (Fig. 3f and Extended Data Fig. 3f) and to be more efficient at forming pluripotent colonies than BHTH cells (Fig. 3g,h).
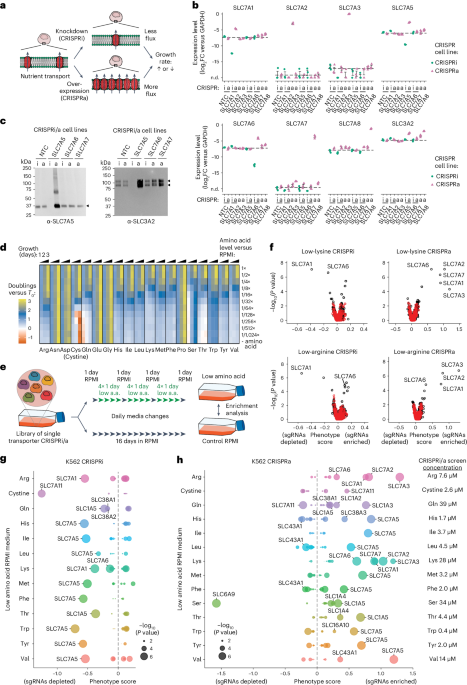
Fig. 3: Sequence of intermediates during reprogramming and transformation.
a, Representation of Bcl11b and Thy1 expression in single cells. The thresholds were as follows: Bcl11b < 1 and Thy1 < 2 for BLTL; Bcl11b > 2 and Thy1 < 2 for BHTL; Bcl11b < 1 and Thy1 > 4 for BLTH; and Bcl11b > 2 and Thy1 > 4 for BHTH. b, Expression of Bcl11b-tdTomato and Thy1 during reprogramming and transformation. KI: knock-in. c, Left, pictures of iPS colonies from a representative experiment. Right, quantification of AP+ colonies (n = 6 independent experiments). d, Left, pictures of foci assays from a representative experiment. Right, foci quantification (n = 5 independent experiments). e, Emergence of Bcl11b-tdTomatolow/Thy1low cells. The graph represents the distribution of BHTH, BLTH, BHTL and BLTL cells. IWP2, Wnt inhibitor; OSKM, Oct4, Sox2, Klf4, c-Myc; SNEL, Sall4, Nanog, Esrrb, Lin28. BHTH cells were FACS sorted before reprogramming/transformation. f, Emergence of BLTL cells from mouse adult ear fibroblasts. The settings were similar to those for e. g, Left, pictures of iPS colonies following reprogramming induced by OSK + IWP2, taken from a representative experiment. Right, quantification of AP+ colonies (n = 2 independent experiments). h, Left, pictures of iPS colonies from mouse adult ear fibroblasts, taken from of a representative experiment. Right, quantification of AP+ colonies (n = 3 independent experiments). i, Schematic of the experimental design. j, Left, brightfield images of tumours in a chick (as indicated by the dashed lines). Right, quantification of the tumours (n = 23 for T-BLTL cells; n = 27 for T-BHTH cells). k, Left, tumour growth curves. Right, survival curves of the mice (n = 6 animals per group). l, Left, FACS profiles. Cells harboring various levels of Bcl11b and Thy1 were FACS sorted at day 5 of reprogramming, plated back in culture and analyzed 2 days later. Right, quantification of AP+ colonies (n = 5 independent experiments). m, Left, FACS profiles. Cells harboring various levels of Bcl11b and Thy1 were FACS sorted at day 5 of transformation, plated back in culture and analyzed 2 days later. Right, quantification of foci (n = 6 independent experiments). n, Schematic of the sequence of intermediates. The corresponding efficiencies are indicated using arbitrary units. In h, j and the left panel of k, the data represent means ± s.d. Statistical significance was determined by two-tailed Student’s t-test (c, d, h and j), two-way ANOVA combined with Šidák’s multiple comparisons test (left panel in k), Gehan–Breslow–Wilcoxon test (right panel in k) or one-way ANOVA followed by Tukey’s post-hoc test (l and m).
Next, we assessed whether T-BLTL cells acquired increased aggressiveness compared with T-BHTH cells48,49 by comparing the functional features of transformed cell lines generated from these subsets of cells. Practically, T-BHTH and T-BLTL cells were FACS sorted 5 d after the induction of transformation, replated and serially passaged to establish independent polyclonal cell lines. While the cell lines presented similar growth curves when grown in two dimensions in vitro (Extended Data Fig. 3g), T-BLTL-derived lines formed sevenfold more soft agar colonies than T-BHTH-derived ones (Extended Data Fig. 3h,i). Next, we performed chick chorioallantoic membrane and mouse xenograft assays as in vivo models of tumorigenesis (Fig. 3i). The size of the tumours generated in chick embryos by T-BLTL-derived cells was significantly higher than by T-BHTH (Fig. 3j). An accelerated growth of T-BLTL-derived tumours and reduced survival were also observed in immunocompromised mice (Fig. 3k). These data indicate that Thy1 and Bcl11b loss broadly delineate early intermediates highly amenable to forming pluripotent or tumorigenic derivatives.
Sequence of intermediates during reprogramming and transformationNext, we sought to characterize the sequential emergence of intermediates during reprogramming and transformation. To ensure that changes in Bcl11b/Thy1 (Fig. 3b) reflected the transition of individual cells from one stage to the next, and not merely the loss of one major population and expansion of another, each fraction was sorted after 5 d of reprogramming then replated for 48 h before FACS analysis. The progression of cellular intermediates revealed the routes induced by OSKM. First, we observed that R-BLTL cells were stable as they did not transit efficiently into other states. R-BHTH and R-BHTL cells generated R-BLTL cells at a very low rate while R-BLTH cells transited into R-BLTL cells efficiently (35%) (Fig. 3l), suggesting that Bcl11b downregulation is a rate-limiting step of reprogramming, in line with our previous results (Fig. 2). Importantly, these cellular progressions were correlated with the capacity of the intermediates to form AP+ colonies (Fig. 3l and Extended Data Fig. 3j). For transformation, the T-BLTL state was also relatively stable and prone to forming immortalized foci (Fig. 3m). T-BHTH and T-BLTH cells were poorly efficient at generating T-BLTL while T-BHTL cells efficiently reached this state (Fig. 3m and Extended Data Fig. 3k). On this basis, we generated the functional roadmaps presented in Fig. 3n.
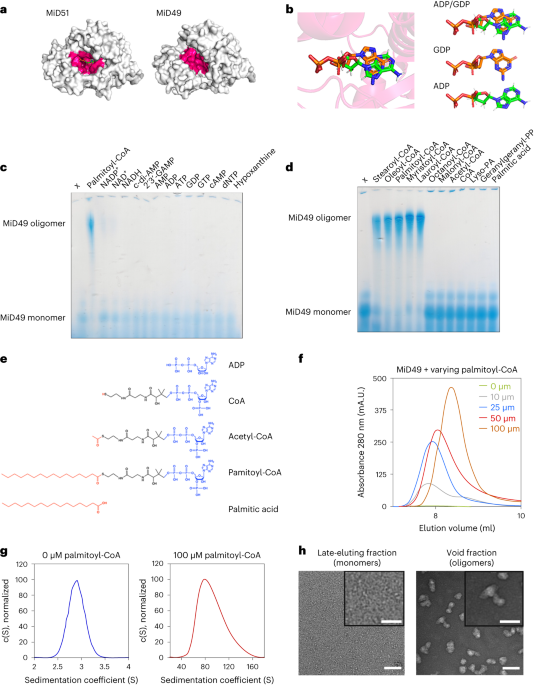
Chromatin reconfigurations in early intermediatesWe next dissected the reconfigurations of chromatin accessibility by conducting assay for transposase-accessible chromatin sequencing (ATAC-Seq) on cellular intermediates captured at day 5 of reprogramming or transformation. PCA analysis showed that R-BLTL and T-BLTL cells segregated together on the x axis (principal component 1) (Fig. 4a) and towards the direction of the iPS/transformed cells (Extended Data Fig. 4a), suggesting the existence of common changes of chromatin accessibility, as exemplified with Thy1 (Fig. 4b). To test this, we classified the peaks in clusters defining regions that were accessible in MEFs but not in both R-BLTL and T-BLTL cells (C1); became accessible in both R-BLTL and T-BLTL cells over MEFs (C2); specifically lost (C3) or gained (C4) accessibility in R-BLTL cells over MEFs and T-BLTL cells; or specifically lost (C5) or gained (C6) accessibility in T-BLTL cells over MEFs and R-BLTL cells (Fig. 4c). We also generated an unsupervised heatmap to visualize peak intensities for differential loci (Extended Data Fig. 4b). To uncover TFs possibly driving these changes, we performed a DNA motif enrichment on clusters (Fig. 4d and Extended Data Fig. 4c). A subset of regulatory elements changing accessibility in R-BLTL and T-BLTL cells were enriched in the FosL1 motif (C2, C3 and C5), suggesting relocation of this TF. We assessed whether Fosl1 functionally regulates both processes. FosL1 depletion (Extended Data Fig. 4d,e) led to a fourfold reduction in the number of immortalized foci (Extended Data Fig. 4f,g) and an average sixfold increase in reprogramming efficiency (Extended Data Fig. 4h,i). Hence, ATAC-Seq shed light on changes in chromatin accessibility that occur specifically or commonly during reprogramming and transformation, as well as identified FosL1 as a common but antagonistic regulator.
Fig. 4: Chromatin and transcriptome reconfigurations in cellular intermediates.
a, PCA conducted on ATAC-Seq data. Untreated MEFs (black), BLTL and BHTH cells FACS sorted after 5 d of reprogramming (red) or transformation (blue) are represented. b, Example of ATAC chromatin sites at the Thy1 locus. c, Definition of the clusters described in the main text (n = 2 independent experiments). Central lines represents medians, box edges represent upper and lower quartiles and whiskers show the highest and lowest values, excluding outliers (at most 1.5× the interquartile range above or below the upper and lower quartile). d, Enrichment in TF motifs. Each point represents significant enrichment in the motif (x axis) for the cluster (y axis). The point size represents the proportion of sequences in the cluster featuring the motif and the colour gradient represents the enrichment significance. e, PCA conducted on RNA-Seq data. f, Venn diagram showing the numbers of differentially expressed genes in MEFs versus R-BLTL cells (red), MEFs versus T-BLTL cells (blue) and control MEFs versus Bcl11b KD MEFs (green) (log2[FC] < −0.5 or >0.5; base mean < 40; adjusted P value < 5 × 10⁻²). g, Visualization of R-BLTL and T-BLTL score activities on single-cell trajectories. h, Venn diagram showing the numbers of differentially expressed genes in T-BLTL versus T-BHTH cells (blue) and R-BLTL versus R-BHTH cells (red) (log2[FC] < −1 or >1; adjusted P value < 5 × 10⁻²). i, Statistical over-representation assays conducted with PantherDB. Statistical significance was determined by Fisher’s exact two-sided test. j, Top, patterns of the downregulated genes signature plotted on the diffusion map. Bottom, patterns of the upregulated genes signature plotted on the diffusion map. k, Heatmap clustering the 301 commonly deregulated genes. The MEF sample was excluded from the representation. l, Western blot depicting Atoh8, Id4, Twist2 and Gapdh levels in cellular intermediates. m, Western blot depicting Atoh8, Id4, Twist2 and Actin levels in MEFs, iPS and transformed cells.
Transcriptomic changes in early intermediatesPCA conducted on RNA-Seq data of day 5 cellular intermediates revealed that R-BLTL and T-BLTL cells segregated together on the x axis, suggesting common changes (Fig. 4e). In addition, a significant number of the genes deregulated by Bcl11b modulation in MEFs (Fig. 2o) were also impacted in both R-BLTL and T-BLTL cells (Fig. 4f). Next, we exploited published datasets to characterize R-BLTL and T-BLTL cells. MEF identity scores12,13 were not downregulated in R-BLTL and T-BLTL cells (Extended Data Fig. 4j), indicating that these cells constituted early intermediates that gained plasticity but did not yet downregulate identity, in contrast with previously isolated intermediates8. In line with this, R-BLTL and T-BLTL cells did not induce CD73 and CD49d, which delineate late intermediates (Extended Data Fig. 4k)45. R-BLTL and T-BLTL cells harboured some moderated reductions in stromal markers (Csf1, Prrx1 and Id3) but no concomitant inductions of mesenchymal-to-epithelial transition (MET) markers (Fut9 and Zic3), reinforcing the notion that they are not yet fully engaged on a MET trajectory (Extended Data Fig. 4l)13. These findings demonstrate that a
留言 (0)