
記住我


HIV continues to affect many lives globally especially in sub-Saharan Africa (SSA), which accounts for 67% of people with HIV (PWH) in 2020 [1] making HIV prevention and treatment essential, particularly in this region. HIV testing has played a crucial role in the prevention and management of HIV/AIDS as the entry point that links individuals to prevention and treatment services.
Routine offer of HIV testing in health settings, such as antenatal clinics was recommended by the World Health Organization in 2007 [2], which changed the profiles of testing users and increased uptake in HIV testing [3]. However, in spite of the significant progress in reducing HIV incidence over the past decade in SSA, HIV incidence has not declined sufficiently to reach the UNAIDS 90–90–90 fast-track goals by 2020 and the Sustainable Development Goal of ending the AIDS epidemic by 2030 [4]. A modelling study that investigated the progress towards the first 90 (90% of PWH will know their status) found that 84% of PWH in SSA knew their status by 2020, with proportions consistently lower in Western and Central Africa (WCA, 67% and 70%, respectively) than in Eastern and Southern Africa (ESA, 86% and 90%, respectively) [5]. These still left a gap of around 3.8 million PWH left undiagnosed in SSA [5].
Health inequalities that favour the wealthiest subgroups have also persisted in most SSA countries, especially in WCA [6]. Studies found that people with higher socioeconomic position (SEP) were associated with better knowledge of HIV status and were more likely to seek testing [7–13]. Potential drivers of these inequalities include knowledge on HIV, stigma, distance to care and cost of services, among many others. A study found that cost of services and physical distance between health facilities were the most significant supply-side barriers in accessing obstetric care in SSA [14]. We hypothesize these drivers to also be important barriers in the uptake of HIV testing. Documenting such mechanisms can be useful in understanding the role of each factor in driving such inequalities.
Despite the literature in socioeconomic inequalities in HIV testing, few studies have explored their possible underlying mechanisms. Such studies are timely to help better orientate testing strategies in order to reach the first 95 of the 2030 UNAIDS 95–95–95 targets and to ensure ‘no one is left behind’. In this study, we analysed population-based surveys to understand mediating factors linking SEP and HIV testing uptake at the individual level.
Methods Data and study designWe analysed data from the Demographic and Health Surveys (DHS) conducted between 2010 and 2018 to understand the role of different mediating factors in the pathway between SEP and recent (<12 months) HIV testing uptake.
The DHS are publicly available nationally representative population-based surveys, conducted regularly in low- and middle-income countries (LMIC), collecting data on a wide range of objective and self-reported health indicators including data on HIV/AIDS, using a two-stage sampling design [15]. All women aged 15–49 years are all eligible in all households and, in some surveys, men aged 15–54/59 from a sub-sample are also eligible to participate (https://dhsprogram.com/). Those who consented are interviewed face-to-face by trained interviewers using a standardized questionnaire that includes items on different sociodemographic characteristics, maternal and reproductive health, and HIV-related questions [15].
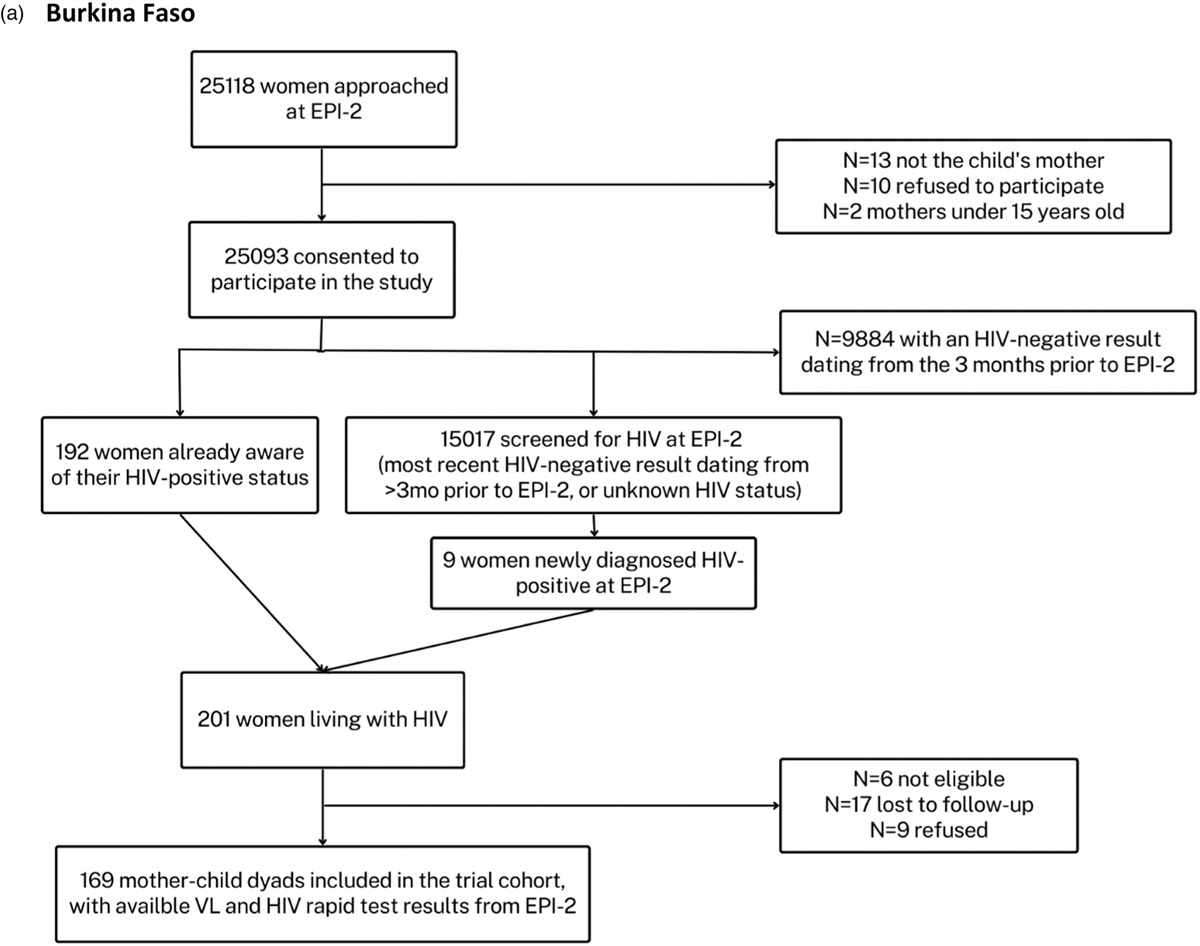
Country sample was based on convenience sampling (with data available as of February 2021) that was slightly extended from a previous study [6]. In total, we analysed 10 WCA countries (Burkina Faso, Cameroon, Congo DR, Côte d’Ivoire, Guinea, Liberia, Mali, Niger, Senegal and Sierra Leone) and eight ESA countries (Ethiopia, Kenya, Lesotho, Malawi, Rwanda, Tanzania, Zambia and Zimbabwe).
The national implementing agencies and research institutes that conducted the surveys were responsible for ethical clearance which ensured informed consent from the participants prior to their involvement and guaranteed confidentiality of information [16].
Variables Socioeconomic positionWe defined participant SEP based on the DHS wealth index, a composite measure of household wealth based on living standards such as household assets and characteristics [17]. More specifically, we used the relative wealth rank of the participants in the country-specific cumulative distribution of the wealth index score, a continuous variable ranging from 0 to 1. We compared the predicted outcomes between the richest and the poorest individuals in the wealth distribution.
Outcome variableThe outcome of interest was the self-report of recent (<12 months) HIV testing.
MediatorsWe selected six potential individual-level mediators available in the DHS that we hypothesized to be in the pathway between wealth and recent HIV testing based on the literature. We categorized these mediators into two categories based on a principal component analysis for women (Figure S1, Supplemental Digital Content, https://links.lww.com/QAD/C570).
The first category of mediators referred to the individual's ability to perceive the need for and to seek care [18] (i.e. HIV-related knowledge and positive attitudes towards PWH). The second category included factors that characterize the ability to reach, pay for, and engage in healthcare [18] (i.e. reporting no distance-related problem to seek care, reporting no money-related problem to seek care, no permission needed from spouse/partner to seek a doctor and no/single difficulty in seeking care). For simplicity, we labelled the first category internal and the second category external characteristics to the participants. External mediators were only available for women in the DHS except in Tanzania.
All mediators were coded as binary variables with favourable responses coded as 1. Complete descriptions of these variables and how they were constructed can be found in Table S1, Supplemental Digital Content, https://links.lww.com/QAD/C570.
ConfoundersThe confounders that we identified a priori were age (15–24, 25–34, 35 and above), type of residence (urban and rural) and family situation (in a union, single and widowed/separated).
Statistical analysisFirstly, we estimated country- and sex-specific percentages of reporting favourable levels of the mediators and recent HIV testing while accounting for survey design and sampling weights. We also calculated the proportions of the mediators at favourable levels between the richest and poorest quintiles.
Secondly, we fitted multivariable modified Poisson regressions adjusting for confounders and accounting for survey design to compute the inequalities and mediated effects [19]. We estimated the wealth-related inequalities in recent HIV testing by estimating the total effect (TE) of wealth on recent testing using Eq. (1).
P(recent HIV testing)=f(wealth rank, confounders)
Outcome model:
P(recent HIV testing)=f(wealth rank, mediator, EM interaction, confounders)
where EM = exposure-mediator.
Mediator model:
P(mediator)=f(wealth rank, confounders)
Thirdly, we applied different outcome and mediator models (Eqs. (2) and (3)) using the product method based on the potential outcomes framework [20,21] to explore different pathways linking wealth and recent HIV testing through the internal and external mediators. We explored each mediator separately and assumed that they do not influence one another in the analysis. We considered four assumptions in this analysis: no unmeasured exposure – outcome confounding, no unmeasured mediator – outcome confounding, no unmeasured exposure – mediator confounding, and none of the mediator – outcome confounder is itself affected by the exposure [22]. Figure 1 shows the Directed Acyclic Graph (DAG) of the pathways that we explored.
 Fig. 1:
 DAG illustrating the pathway between wealth and recent (<12 months) HIV testing through each mediator while adjusting for confounders (i.e., age, type of residence and family situation) and exposure-mediator interaction when statistically significant (P-value <0.05) (∗).
Lastly, we estimated the proportion mediated (PM, in %) by each mediator. The PM is the proportion of the TE of the exposure on the outcome that is mediated. The PM captures how important the pathway is through the mediator in explaining the observed effect of the exposure on the outcome (i.e. TE) [23]. To calculate the PM, we decomposed the TE of wealth on recent HIV testing into the controlled direct effect (CDE) and the natural indirect effect (NIE) (Fig. 1) using coefficients from the outcome and mediator models (Text S1, Supplemental Digital Content, https://links.lww.com/QAD/C570). The CDE is the effect of the exposure on the outcome, while the mediator is set to a pre-specified level uniformly over the entire population [21]. Here, we pre-specified the level of the mediator to a favourable level. The NIE represents the change in the outcome when SEP is held constant and the mediator changes to what it would have been for a change in the other SEP category [21,24]. We also accounted for the EM interaction in our outcome models (Eq. 2) when it was statistically significant (P-value < 0.05) to calculate for these effect estimates [21]. We used the formula based on Valeri and VanderWeele to calculate for such effects (Text S1, Supplemental Digital Content, https://links.lww.com/QAD/C570). We bootstrapped the 95% confidence interval (CI) with 1000 replications. Considering the low rate of missing data (Table S2, Supplemental Digital Content, https://links.lww.com/QAD/C570), we conducted a complete-case analysis.
To focus on settings in which wealth-related inequalities were substantial before decomposing the TE into CDE and NIE to calculate the PM, we established a cut-off based on the TE, with a prevalence ratio (PR) ≥1.5. All analyses were conducted using R version 4.0.3 (R Foundation for Statistical Computing, Vienna, Austria).
Sensitivity analysisWe repeated the analysis among women while excluding those who had recent birth in the past year. We also conducted an additional analysis using joint-mediators approach to check for the identification assumption related to the mediators influencing each other [25].
Results Characteristics of study populationData were collected from 392 044 participants, 261 935 female and 130 109 male participants. Table 1 and Table S3, Supplemental Digital Content, https://links.lww.com/QAD/C570 illustrate the survey and participants characteristics. Overall, 93–100% of eligible women were successfully interviewed, and 86–100% of men (Table S3, Supplemental Digital Content, https://links.lww.com/QAD/C570).
Table 1 - Survey and population characteristics, by country and sex. Western-Central Africa BFA(Burkina Faso) CIV(Côte d’Ivoire) CMR(Cameroon) COD(Congo DR) GNA(Guinea) LIB(Liberia) MLI(Mali) NIG(Niger) SEN(Senegal) SLE(Sierra Leone) Survey year 2010 2011–2012 2018 2013–2014 2018 2013 2018 2012 2017 2013 Sex F M F M F M F M F M F M F M F M F M F M N 17 087 7307 10 060 5135 14 677 6978 18 827 8656 10 874 4117 9239 4118 10 519 4618 11 160 3928 16 787 6977 16 658 7262 Internal mediators HIV-related knowledge (%) 23.3 21.5 14.5 13.2 32.4 25.8 11.8 13.8 14.6 18.9 1.3 17.1 15.8 16.3 10.0 13.9 16.2 21.2 21.9 14.0 Positive attitudes towards PWH (%) 32.8 38.7 47.3 46.3 57.0 51.2 33.6 40.2 15.4 17.5 33.6 37.5 29.5 34.0 18.3 24.9 34.2 30.0 34.7 33.0 External mediators No distance-related problem to seek care (%) 56.4 – 60.3 – 60.3 – 61.1 – 53.9 – 59.9 – 71.5 – 57.1 – 77.9 – 61.4 – No money-related problem to seek care (%) 28.2 – 33.0 – 32.7 – 31.4 – 39.9 – 53.1 – 59.5 – 40.1 – 55.3 – 32.9 – No permission needed to seek a doctor (%) 78.9 – 75.6 – 65.4 – 67.3 – 70.5 – 92.2 – 72.9 – 78.9 – 93.4 – 82.5 – No/single difficulty in seeking care (%)† 56.6 – 56.7 – 53.5 – 54.1 – 54.2 – 70.6 – 68.1 – 59.2 – 80.4 – 59.7 – Recent (<12 months) HIV testing (%) 11.8 8.6 15.4 9.9 40.0 35.0 9.1 7.6 9.4 5.9 21.6 13.7 9.2 4.9 8.4 2.7 13.0 6.3 17.6 8.2 Eastern-Southern Africa ETH(Ethiopia) KEN(Kenya) LES(Lesotho) MWI(Malawi) RWA(Rwanda) TNZ(Tanzania) ZBW(Zimbabwe) ZMB(Zambia) Survey year 2016 2014 2014 2015–2016 2014–2015 2011–2012 2015 2018 Sex F M F M F M F M F M F M F M F M N 15 683 12 688 31 079§ 12 819 6621 2931 24 562 7478 13 497 6217 10 967 8352 9955 8396 13 683 12 132 Internal mediators HIV-related knowledge (%) 18.3 27.0 28.6 23.7 27.0 16.5 35.6 31.5 44.8 40.3 30.5 25.5 44.6 34.9 33.7 24.9 Positive attitudes towards PWH (%) 35.5 44.5 73.0 77.7 84.4 71.6 80.5 85.0 83.4 86.4 59.1 64.8 77.2 78.8 70.7 75.1 External mediators No distance-related problem to seek care (%) 49.7 – 77.3 – 74.5 – 44.4 – 78.4 – – – 66.7 – 71.2 – No money-related problem to seek care (%) 45.2 – 63.3 – 72.7 – 47.2 – 50.7 – – – 57.0 – 79.5 – No permission needed to seek a doctor (%) 67.9 – 94.0 – 96.4 – 83.6 – 97.3 – – – 94.7 – 96.2 – No/ single difficulty in seeking care (%)† 55.1 – 82.0 – 84.9 – 56.2 – 82.8 – – – 76.4 – 85.2 – Recent (<12 months) HIV testing (%) 21.2 19.7 67.9 57.5 59.1 37.9 44.4 42.3 39.7 36.9 32.5 27.7 49.3 36.8 65.4 53.4F, female; M, male; N, total number. PWH, people with HIV.
†A ioint mediator of no distance-related to seek care, no money-related to seek care and no permission needed to seek a doctor.
§All version: 31 079; long version: 14 741, short version: 16 338.
In many of the countries, female and male participants lived in rural areas (except in Côte d’Ivoire, Cameroon and Liberia among both sex, and in Senegal among males). They were either married or cohabitating except in Cameroon, Senegal and Lesotho where most males were single (Table S3, Supplemental Digital Content, https://links.lww.com/QAD/C570).
Table 1 shows that around 18–45% of the female participants and 17–40% of the male participants had comprehensive HIV-related knowledge in ESA countries compared to 1–32% and 13–26% among female and male participants, respectively, in WCA countries. Moreover, the proportion of participants with positive attitudes towards PWH was lower in WCA countries (around 15–57% among females and 18–51% males) compared to ESA countries (about 36–84% among females and 45–86% among males). In terms of the external variables, most women reported no external-related problems except in Burkina Faso, Côte d’Ivoire, Cameroon, Congo DR, Guinea, Niger and Sierra Leone in WCA (majority of women reported money-related problems in seeking care), and in Ethiopia and Malawi in ESA (majority of women reported distance-related and money-related problems). Most female participants did not need spousal/partner permission to seek a doctor in all countries.
Self-reported recent HIV testing uptake among female and male participants in WCA was lowest in Niger (8.4 and 2.7%, respectively) and highest in Cameroon (40 and 35%, respectively). Meanwhile in ESA, uptake among women and men was lowest in Ethiopia (21.2 and 19.7%, respectively) and highest in Kenya (67.9 and 57.5%, respectively).
Socioeconomic inequalities in HIV TestingFigure 2 illustrates that the richest were more likely to have comprehensive HIV-related knowledge, have positive attitudes towards PWH and were less likely to report problems external to the participants. We also observed different magnitudes across countries and mediators.
 Fig. 2:
 Path from wealth to mediator – proportion of the richest and poorest participants who self-reported favourable levels of the mediator in 18 sub-Saharan African countries, stratified by sex.
Table 2 shows the TE of wealth on recent HIV testing which was the effect estimate we used to measure wealth-related inequalities. We estimated the adjusted PRs of recent testing between the richest and the poorest participants while accounting for confounders. Applying the cut-off of PR ≥1.5 led us to keep nine countries for women and 15 countries for men in our final mediation analyses. Levels of wealth-related inequalities vary greatly by country and sex with pro-rich inequalities in HIV testing in most countries. Inequalities tended to be higher among men than women.
Table 2 - Total effect of wealth on recent HIV testing – adjusted prevalence ratios of recent HIV testing between the richest and poorest participants (stratified by sex), while accounting for confounders. Adjusted PR (95% confidence interval)P(recent HIV testing) = f(wealth rank, confounders) Country Female Male BFA 2.74 (2.09 – 3.58) 14.97 (9.12 – 24.57) CIV 3.39 (2.53 – 4.52) 8.93 (5.27 – 15.15) CMR 2.68 (2.33 – 3.07) 3.95 (3.23 – 4.83) COD 12.14 (7.34 – 20.08) 15.30 (8.67 – 26.98) ETH 3.97 (3.14 – 5.01) 3.89 (3.00 – 5.05) GNA 10.63 (6.57 – 17.19) 11.27 (4.93 – 25.74) KEN 1.30 (1.23 – 1.37) 1.59 (1.47 – 1.71) LES 0.90 (0.82 – 0.99) 1.61 (1.30 – 2.00) LIB 1.21 (0.99 – 1.47) 2.92 (1.94 – 4.38) MLI 11.17 (7.08 – 17.63) 6.16 (2.14 – 17.72) MWI 1.10 (1.04 – 1.17) 1.13 (1.01 – 1.26) NIG 4.82 (3.23 – 7.17) 46.04 (10.47 – 202.43) RWA 1.08 (0.99 – 1.19) 0.93 (0.80 – 1.07) SEN 1.62 (1.30 – 2.01) 3.08 (1.75 – 5.44) SLE 1.35 (1.07 – 1.70) 2.58 (1.45 – 4.61) TNZ 1.44 (1.27 – 1.65) 1.68 (1.42 – 1.99) ZBW 1.13 (1.00 – 1.28) 1.37 (1.16 – 1.63) ZMB 1.13 (1.04 – 1.23) 1.51 (1.37 – 1.66) PR, prevalence ratio; P, probability; f, function of. Bold fonts indicate that the model is statistically significant and eligible (PR ≥ 1.5), italic indicates that the model is statistically significant but ineligible, and normal fonts indicate that the model is not statistically significant. Refer to Table 1 for full country names.Wealth-related inequalities were markedly observed in WCA countries. Among women, the highest inequalities were in Congo DR where the prevalence of recent testing among the richest women was 12.14 (95% CI 7.34–20.08) times greater than among the poorest women. Meanwhile in men, the highest inequality was in Niger where the prevalence of testing among the richest men was 46.04 (10.47–202.43) times greater than among the poorest men.
留言 (0)