
記住我
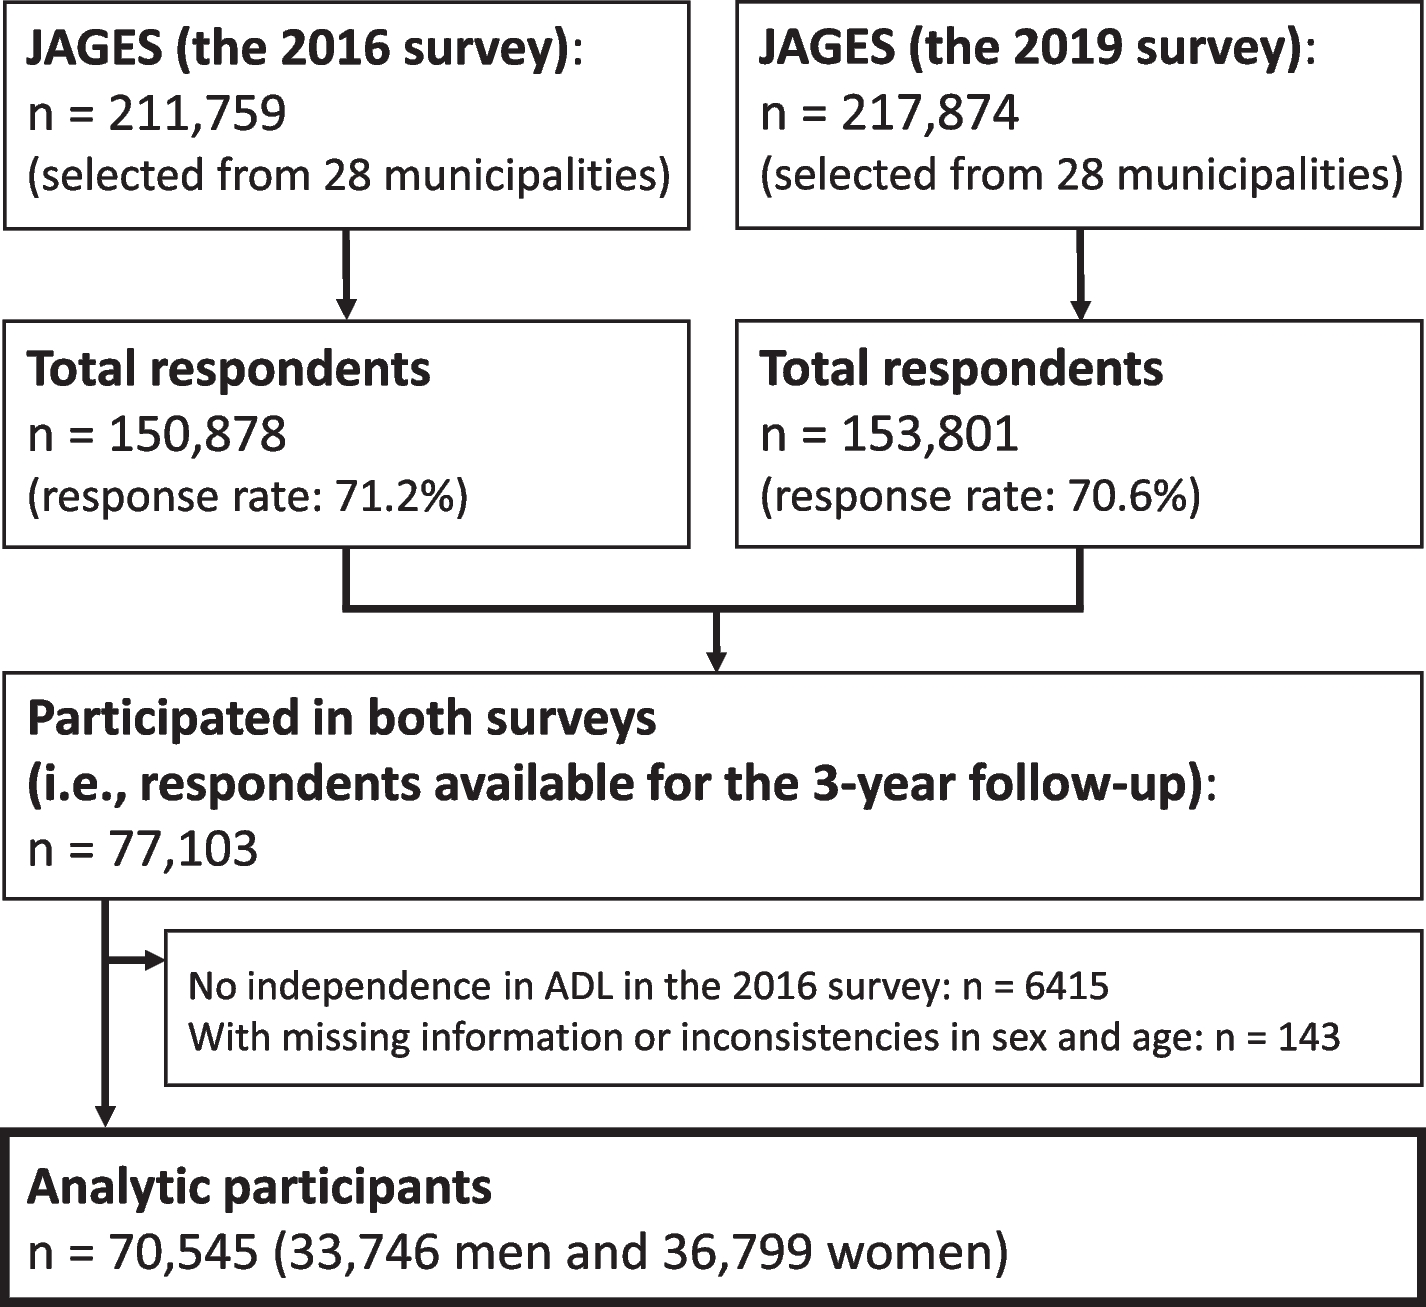
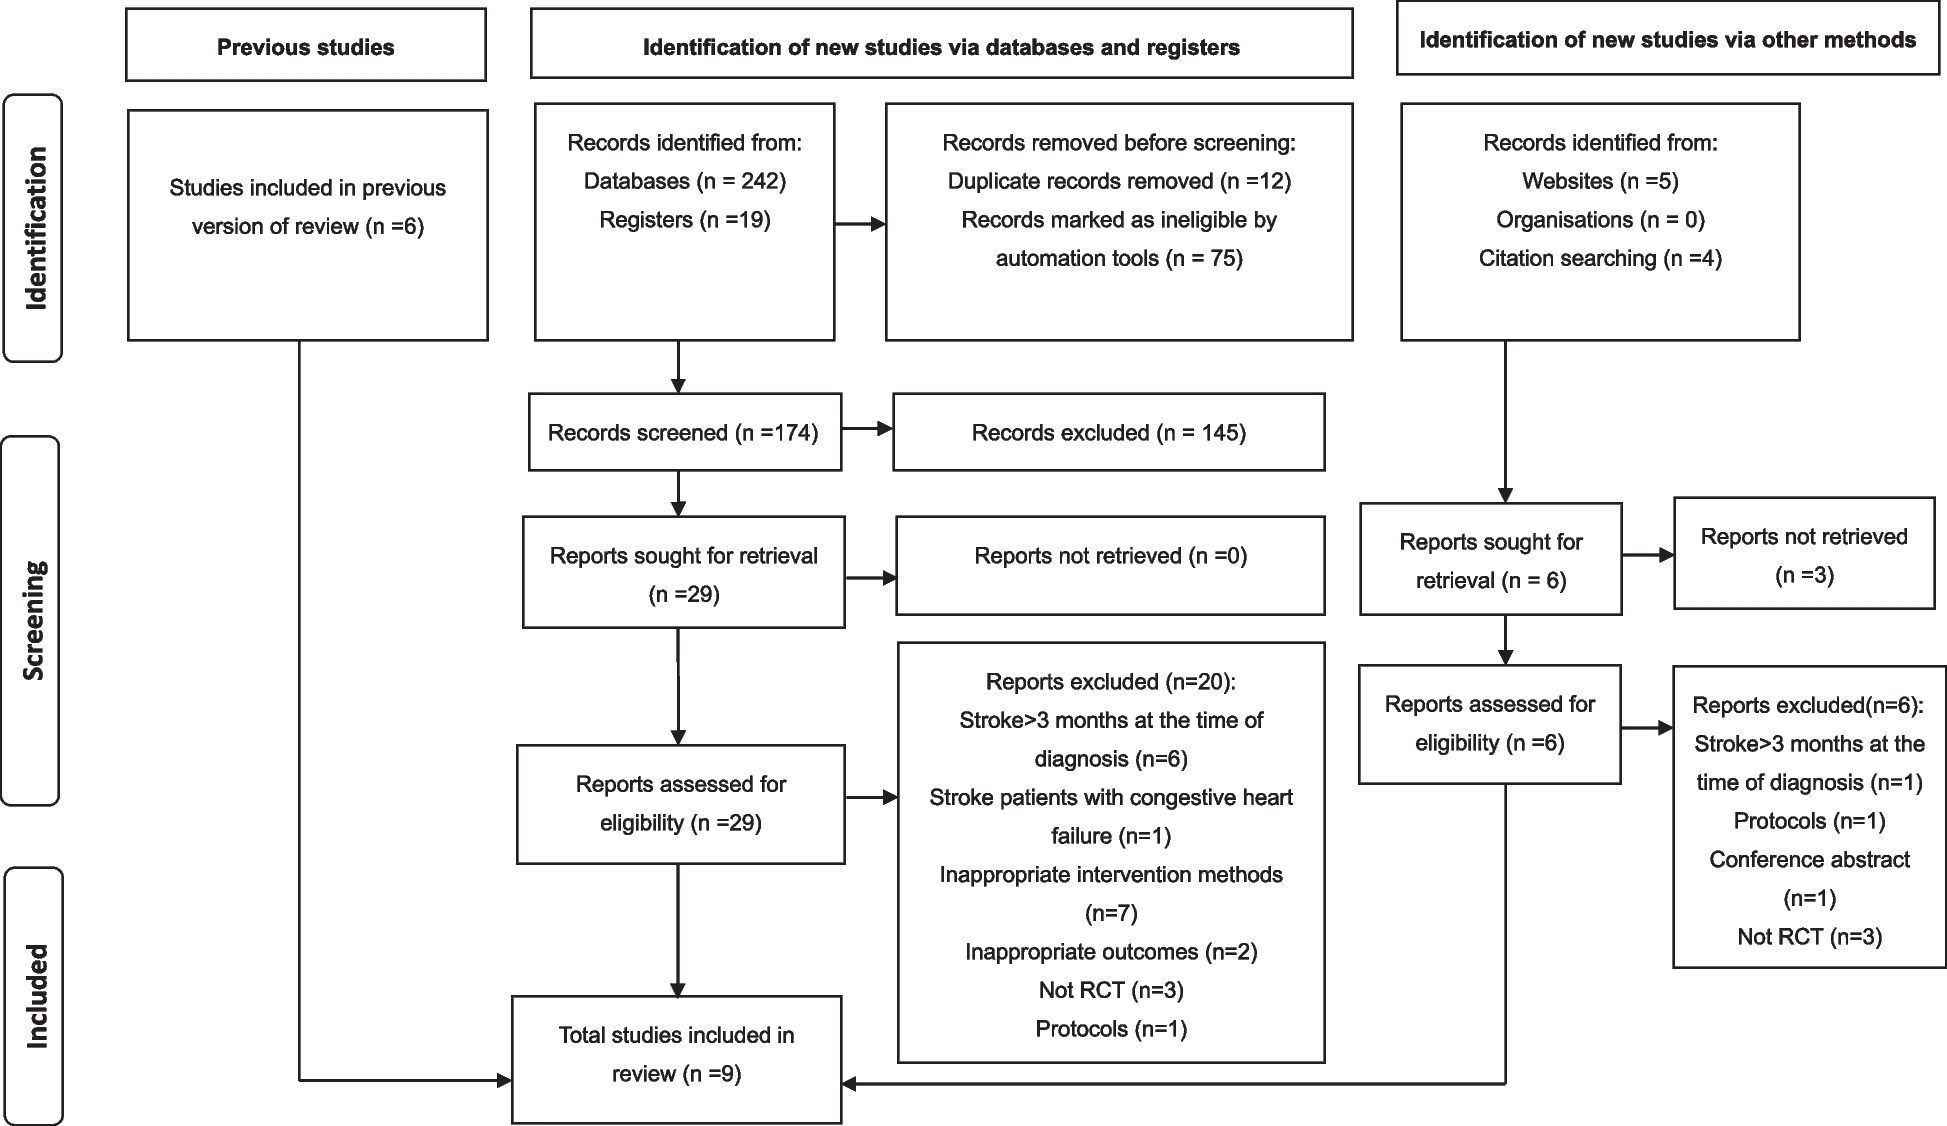
This study used a cohort design. The predictor was PA levels in the baseline survey (hereafter referred to as the first survey), and the outcome was fall occurrence determined in a survey conducted 5 years after the baseline survey (hereafter referred to as the second survey). All 34,802 residents aged 40–74 years living in Murakami city, Sekikawa village, and Awashimaura village in Niigata Prefecture, Japan were originally recruited, and 14,364 completed the first survey. Details of participant selection and the structure of the study are outlined in Fig. 1. After excluding participants with missing data on falls, PA, body mass index (BMI), education, lifestyles, and multiple falls at baseline, the remaining 12,783 participants were considered eligible. Among the eligible participants, 7,688 (60.1%) completed the second survey, and 7,561 were included in the final study population after those with missing data on falls were excluded. All participants provided written informed consent. The study protocol was approved by the Ethics Committee of Niigata University School of Medicine (No. 2371). The protocol of the Murakami cohort study has been published elsewhere [16].
Fig. 1
Flow chart of participant selection and structure of the study
Baseline survey (first survey)The first survey was conducted in 2011–2013 using a self-administered questionnaire. The questionnaire elicited information on PA, sex, age, marital status, education, occupation, smoking habit, alcohol consumption, body height and weight, disease history (stroke, diabetes, and knee osteoarthritis), and falls.
The Japan Public Health Center-based prospective study-PA questionnaire (JPHC-PAQ) requested information on occupation-related activities (commuting, work, and housework) and leisure-time activities during free time in the previous year. Participants were asked to indicate the number of hours spent sitting, standing, walking, and doing strenuous work for occupational PA at different levels of intensity, as well as the frequency and number of hours spent walking slowly, walking quickly, performing light to moderate exercise (e.g., golf, croquet, and gardening), and performing strenuous exercise (e.g., tennis, jogging, aerobics, and swimming) for leisure-time PA at different levels of intensity. PA levels were estimated using metabolic equivalent (MET) scores (MET-h/day), which were calculated by multiplying the time spent on a given activity per day by its MET intensity. Total PA was classified into leisure-time PA (walking slowly, 2.8 METs; walking quickly, 4.0 METs; light-to-moderate exercise 3.0 METs; strenuous exercise, 6.0 METs), non-leisure-time PA (sitting, 1.3 METs; standing, 2.0 METs; walking, 3.0 METs; strenuous occupational work, 6.0 METs), sleep (0.9 METs), and other (1.3 METs). Spearman's correlation coefficients for activity volume (MET-hour/day) between JPHC-PAQ and 24-h activity records were reported to be 0.67 (P < 0.001) for total PA, 0.38 (P < 0.001) for sedentary behavior or light PA, 0.30 (P = 0.002) for moderate PA (0.002), 0.61 (P < 0.001) for moderate-to-vigorous PA, and -0.10 (P = 0.326) for vigorous PA, and their test–retest correlations were 0.48–0.74 (all P < 0.001), suggesting that JPHC-PAQ has acceptable validity and reliability for intensity-specific PA [17].
Marital status was classified as (a) married, (b) never married, and (c) divorced, separated, or bereaved. Education level was classified as (a) junior high school, (b) high school, (c) junior or vocational college, and (d) university or higher. Occupation was classified as (a) office work and sales/service work, (b) professional/management, (c) manual (security, farming/forestry/fishery, transportation, and labor services), and (d) no job/other. BMI was calculated as weight (kg) divided by height squared (m2). Correlation coefficients between self-reported and measured data were 0.985 for body height and 0.983 for body weight [12]. Smoking habit was classified as (1) non-smoker, (2) past smoker, (3) 1–20 cigarettes/day, and (4) ≥ 20 cigarettes/day. Alcohol consumption was classified as (1) non- or rare drinker, (2) 1–149 g ethanol/week, and (3) ≥ 150 g ethanol/week. History of fall (falling down to the ground from a standing position) in the year before the first survey was recorded as none, once, or twice or more (recurrent falls).
Second surveyThe second survey was conducted in 2016–2017 using a self-administered questionnaire. Completed questionnaire forms were collected via postal mail. The questionnaire solicited information on falls that occurred in the previous year in the same manner as in the first survey. Occurrence of recurrent falls (present or absent) in the past year was used as the outcome of this study because recurrent fallers are considered to be at risk of functional decline and mortality [18, 19]. The accuracy of fall recall in the past year was reported to be highly specific (91–95%) [20].
Statistical methodsParticipants with incorrect data, i.e., body height larger than 2.3 m or body weight larger than 200 kg, were excluded, resulting in a final analysis population of 7,561 participants. Mean values and standard deviations (SDs) were calculated for continuous variables. Statistical significance of linear associations between baseline characteristics and PA levels is presented with P for trend values calculated by simple linear or logistic regression analyses. The cumulative incidence of recurrent falls in the past year before the second survey was calculated. Simple and multiple logistic regression analyses were used to calculate P for trend values and odds ratios (ORs) to assess the effect of PAs on recurrent falls. Multiple logistic regression analysis was conducted by first adjusting for age (age-adjusted model); the model was further adjusted for basic potential confounders including demographic and lifestyle factors (Model 1), as well as for disease history (Model 2). Covariates in Model 1 included age, sex, marital status (dummy variable), education level, occupation (dummy variable), BMI, smoking habit, and alcohol consumption. Covariates in Model 2 included the history of stroke, diabetes, and knee osteoarthritis, in addition to Model 1 covariates. Non-leisure-time PA was also included as a covariate in multivariate analyses (both Models 1 and 2) for leisure-time PA and falls; leisure-time PA (dummy variable: medium level or others) was included as a covariate for non-leisure-time PA and falls. PA levels were categorized into four groups to compare ORs: levels of total PA and non-leisure PA were divided into quartiles (by sex), whereas levels of leisure-time PA were divided into “0” and tertiles (by sex) according to leisure-time PA MET scores (> 0), since more than 25% of participants had a MET score of 0. Subgroup analyses stratified by sex and age group (middle-aged: < 65 years; older: ≥ 65 years) were also conducted. ORs for falls were calculated according to intensity-based levels of leisure-time PA, as follows: 1) 0 min/week for both moderate- and strenuous-intensity exercises (reference), 2) low (moderate-intensity exercise for 0–149 min/week and strenuous-intensity exercise for 0–74 min/week [excluding 0 min/week for both exercises]), 3) moderate (moderate-intensity exercise for ≥ 150 min/week and strenuous-intensity exercise for < 75 min/week), and 4) high (strenuous-intensity exercise for ≥ 75 min/week), according to WHO recommendations (i.e., moderate-intensity exercise for ≥ 150 min/week and strenuous-intensity exercise for ≥ 75 min/week) [6], where “moderate-intensity exercise” included “walking quickly” and “light-to-moderate exercise” of JPHC-PAQ. The SAS (release 9.4, SAS Institute Inc., Cary, NC, USA) was used for statistical analyses. P < 0.05 was considered statistically significant.
留言 (0)