
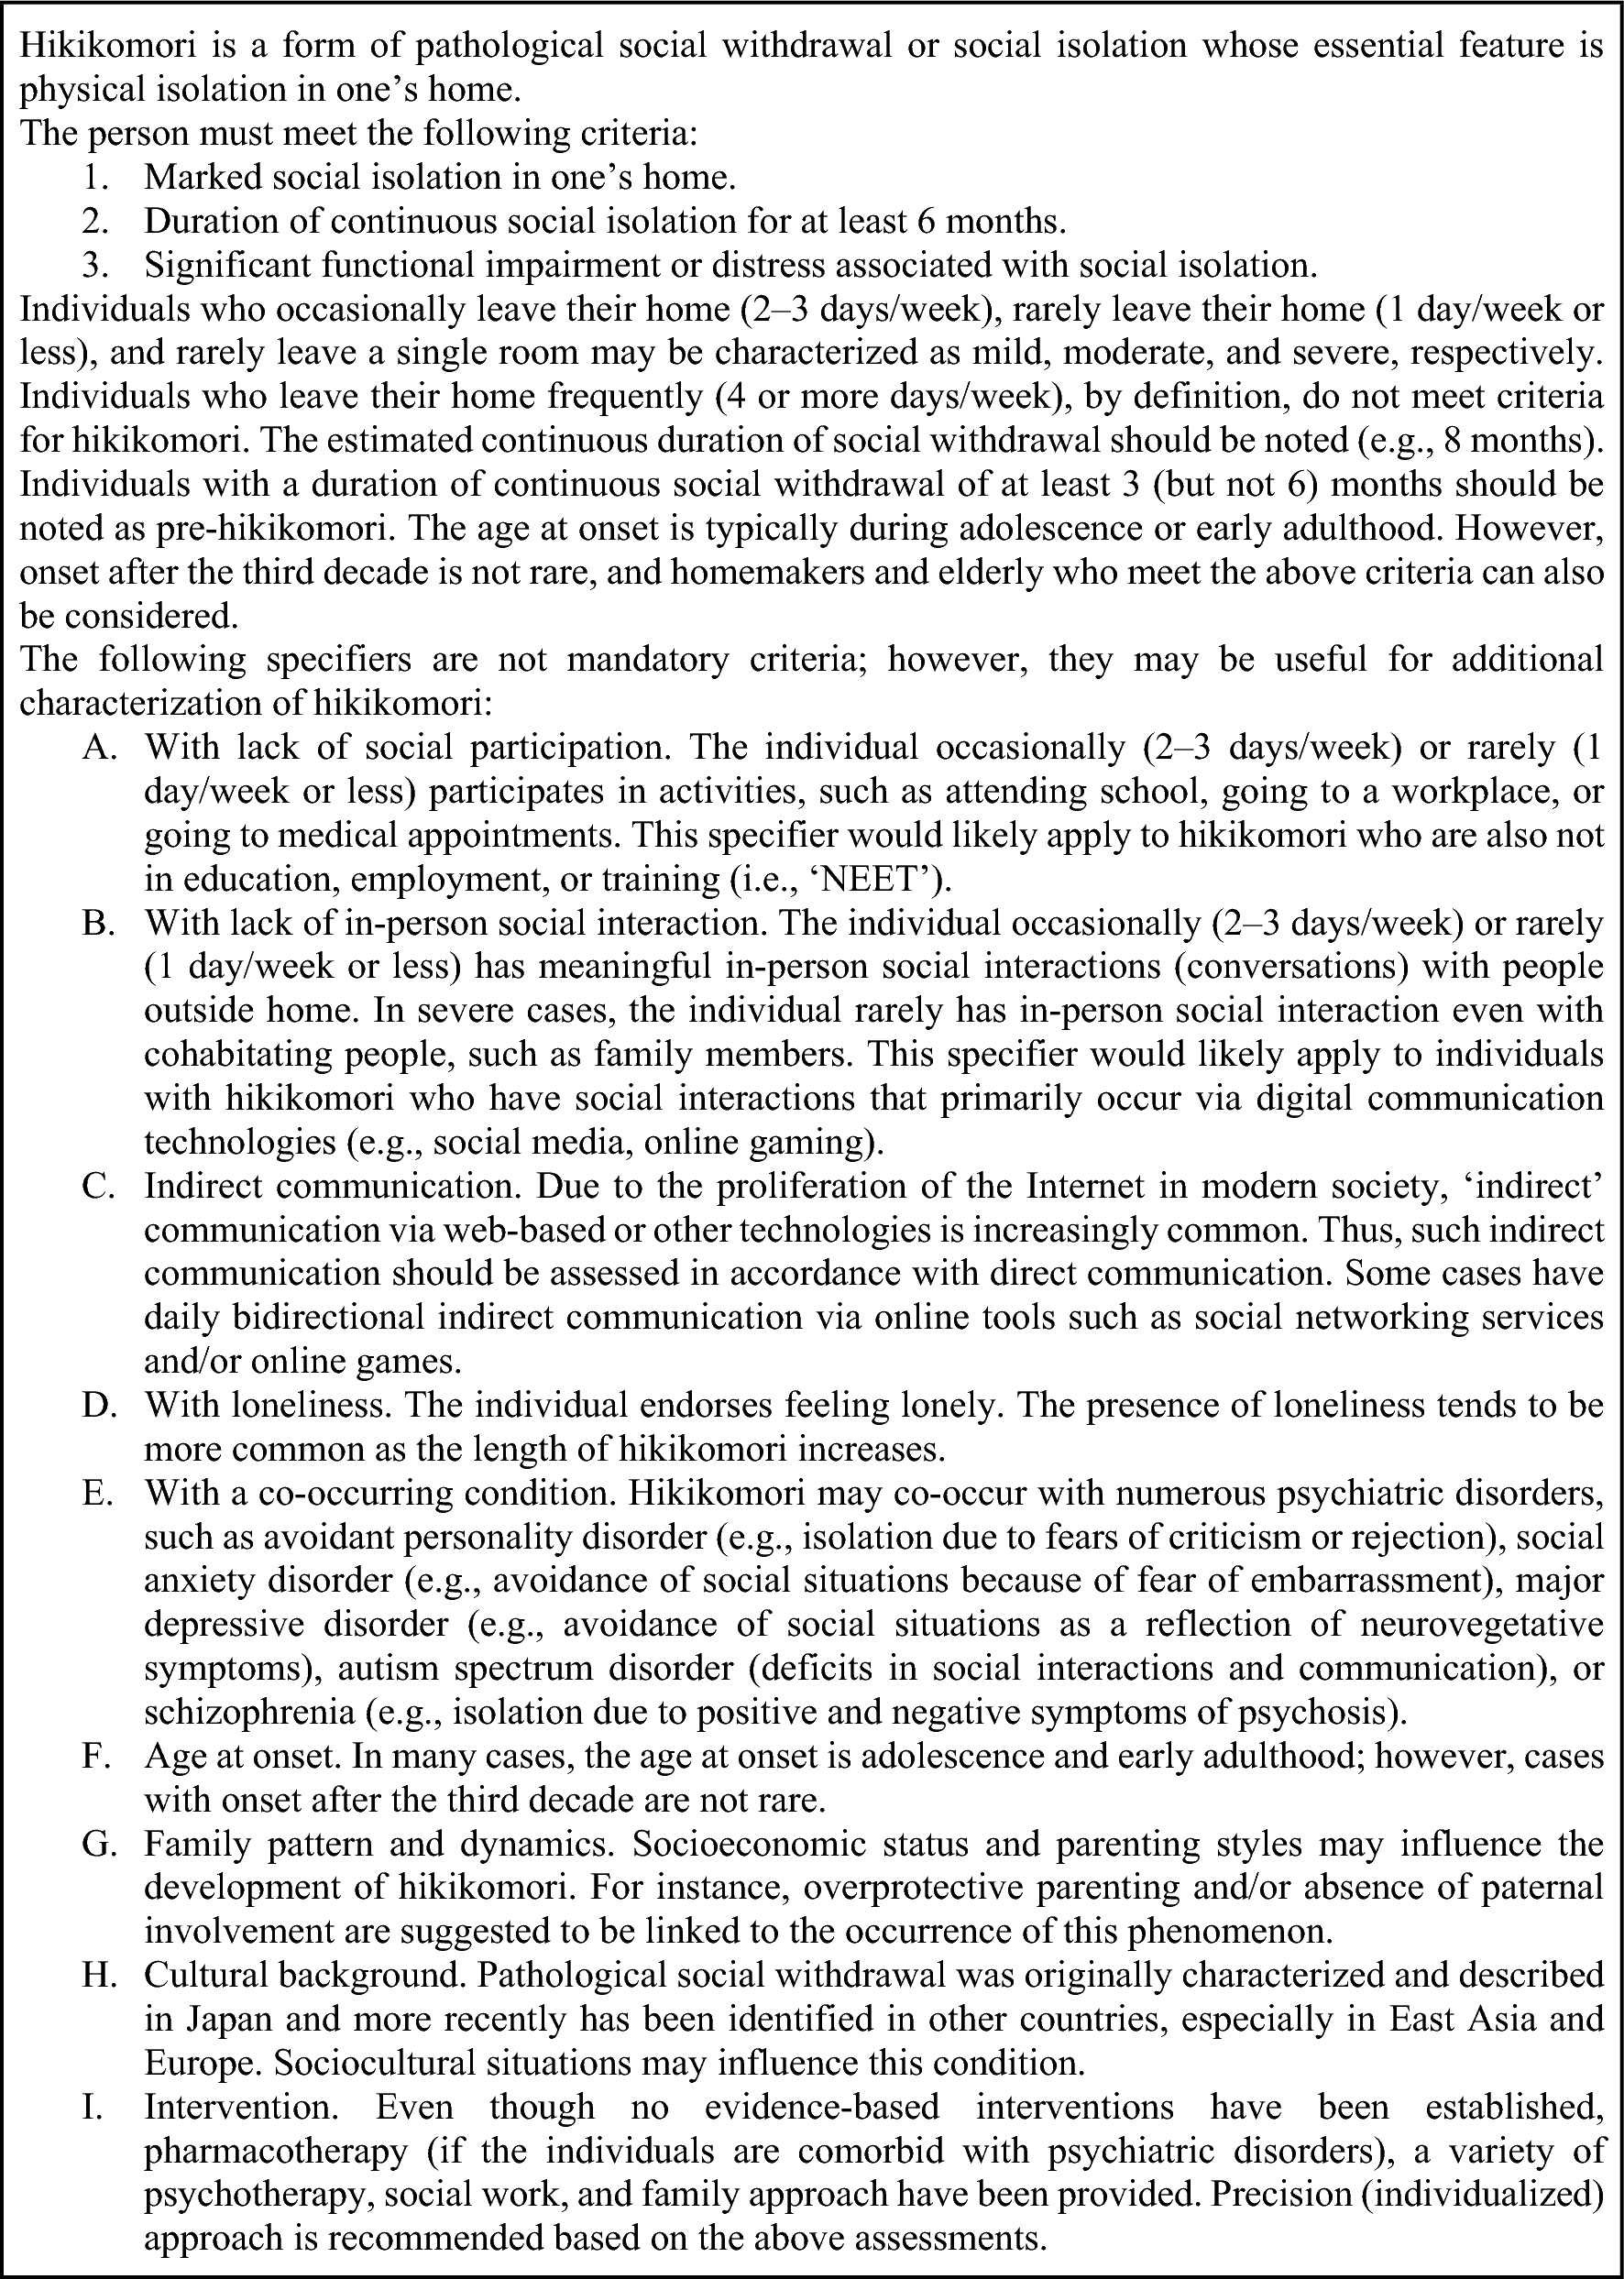
記住我


As shown in Fig. 1, we identified a total of 225,947 person-time visiting records between 2019 and 2020, collecting information such as gender, age, unique number, diagnosis and visiting date. After removing unqualified records, 215,908 records were finally included and then sorted out by age groups and diagnosis categories.
Fig.1
Flowchart of data filtering
In the total medical records of the 3 hospitals from 2019 to 2020, age ranged from 3 to 103 years, with a median age of 44 [14–79] years, and the male-to-female ratio was 1:1.69. The median visit frequency of male and female patients was 2 [1–20] and 2 [1–19], respectively. Anxiety disorder, mood disorder, undetermined diagnoses, sleep disorders, schizophrenia and other psychotic disorders were the most common diagnostic categories, accounting for 36.83%, 16.60%, 15.45%, 13.57% and 9.40%, respectively (see Table 1). The number of medical records in January, February, March, April and December was decreased in 2020 compared to that in 2019 (see Fig. 2).
Table 1 Characteristics of total medical records of psychiatric outpatients from 2019 to 2020(n=215,908)Fig.2
Monthly distribution of medical records of psychiatric outpatients in 2019 and 2020
Gender difference in yearsFigure 3 and Additional file 1: Table S2–S4 show a significantly increased proportion of female psychiatric outpatients in 2020 at the level of total patient visits (χ2 = 18.308, P < 0.001), patient number (χ2 = 8.736, P = 0.003) and first-visit patient number (χ2 = 12.693, P < 0.001).
Fig.3
The gender differences in years and age groups. The figure represents the gender composition in 2019 and 2020 at the level of total patient visits (a), number of patients (b) and number of first-visit patients (c), and by age groups in 2019–2020 at the level of total patient visits (d), number of patients (e) and number of first-visit patients (f)
Gender differences in 5 age groupsAt the 3 levels, female patients were more common in all age groups in psychiatric clinic, with 50–64 years group owned the greatest difference and 35–49 years group the least. Interestingly, the female proportion of 19–34 years group ranked the second at the level of first-visit patient number, while 65 years and over group was the second at other 2 levels (see Fig. 3 and Additional file 1: Table S2–S4).
The female proportion of group aged 0–18 and 19–34 years in 2020 was significantly increased when compared to that of 2019, especially in 19–34 years group at the level of total patient visits (χ2 = 71.657, P < 0.001), patient number (χ2 = 13.895, P < 0.001) and first-visit patient number (χ2 = 13.603, P < 0.001) (see Fig. 4, Additional file 1: Table S5).
Fig.4
The gender composition change of different age groups in 2019–2020. The figure represents the change of gender composition in different age groups from 2019 to 2020 at the level of total patient visits (a), number of patients (b) and number of first-visit patients (c). *: p < 0.05. ***: p < 0.001
Gender differences in 9 diagnostic categoriesAt the three levels, female patients were more common in all diagnosis categories except mental and behavioral disorders due to psychoactive substance use, as shown in Fig. 5. Eating disorder and mood disorder were the first two categories with the highest proportion of women.
Fig.5
The gender differences in diagnostic categories. The figure represents the gender composition by diagnostic categories in 2019–2020 at the level of total patient visits (a), number of patients (b) and number of first-visit patients (c)
The female proportion of anxiety disorder category in 2020 was significantly increased at the level of total patient visits (χ2 = 9.781, P < 0.05), patient number (χ2 = 7.801, P < 0.05) and first-visit patient number (χ2 = 15.655, P < 0.001) when compared to that of 2019 (see Fig. 6, Additional file 1: Table S6). The female proportion of undetermined diagnoses category in 2020 was significantly increased at the level of total patient visits (χ2 = 27.142, P < 0.001), patient number (χ2 = 11.041, P < 0.05) and first-visit patient number (χ2 = 8.458, P < 0.05) when compared to that of 2019 (see Fig. 6, Additional file 1: Table S6).
Fig.6
The gender composition change of different diagnostic categories in 2019–2020. The figure represents the change of gender composition in different diagnostic categories from 2019 to 2020 at the level of total patient visits (a), number of patients (b) and number of first-visit patients (c). *: p < 0.05. ***: p < 0.001
留言 (0)