Data collection
The dataset selection criteria were as follows: 1. transcript profiling (transcriptomic) data including RNA-seq data; 2. accessible basic clinicopathological parameters (stage and OS information included); and 3. sample size exceeding 50 subjects. 1 dataset, namely, GSE135860, was extracted from https://www.ncbi.nlm.nih.gov/geo/query/acc.cgi?acc=GSE135860. We assessed the expression profiles of each dataset manually. A total of 6 datasets were enrolled. The GEO approved publication guidelines were complied with, and the data were extracted from the database. Therefore, the approval of the ethics committee was not required.
Identification of DEGs
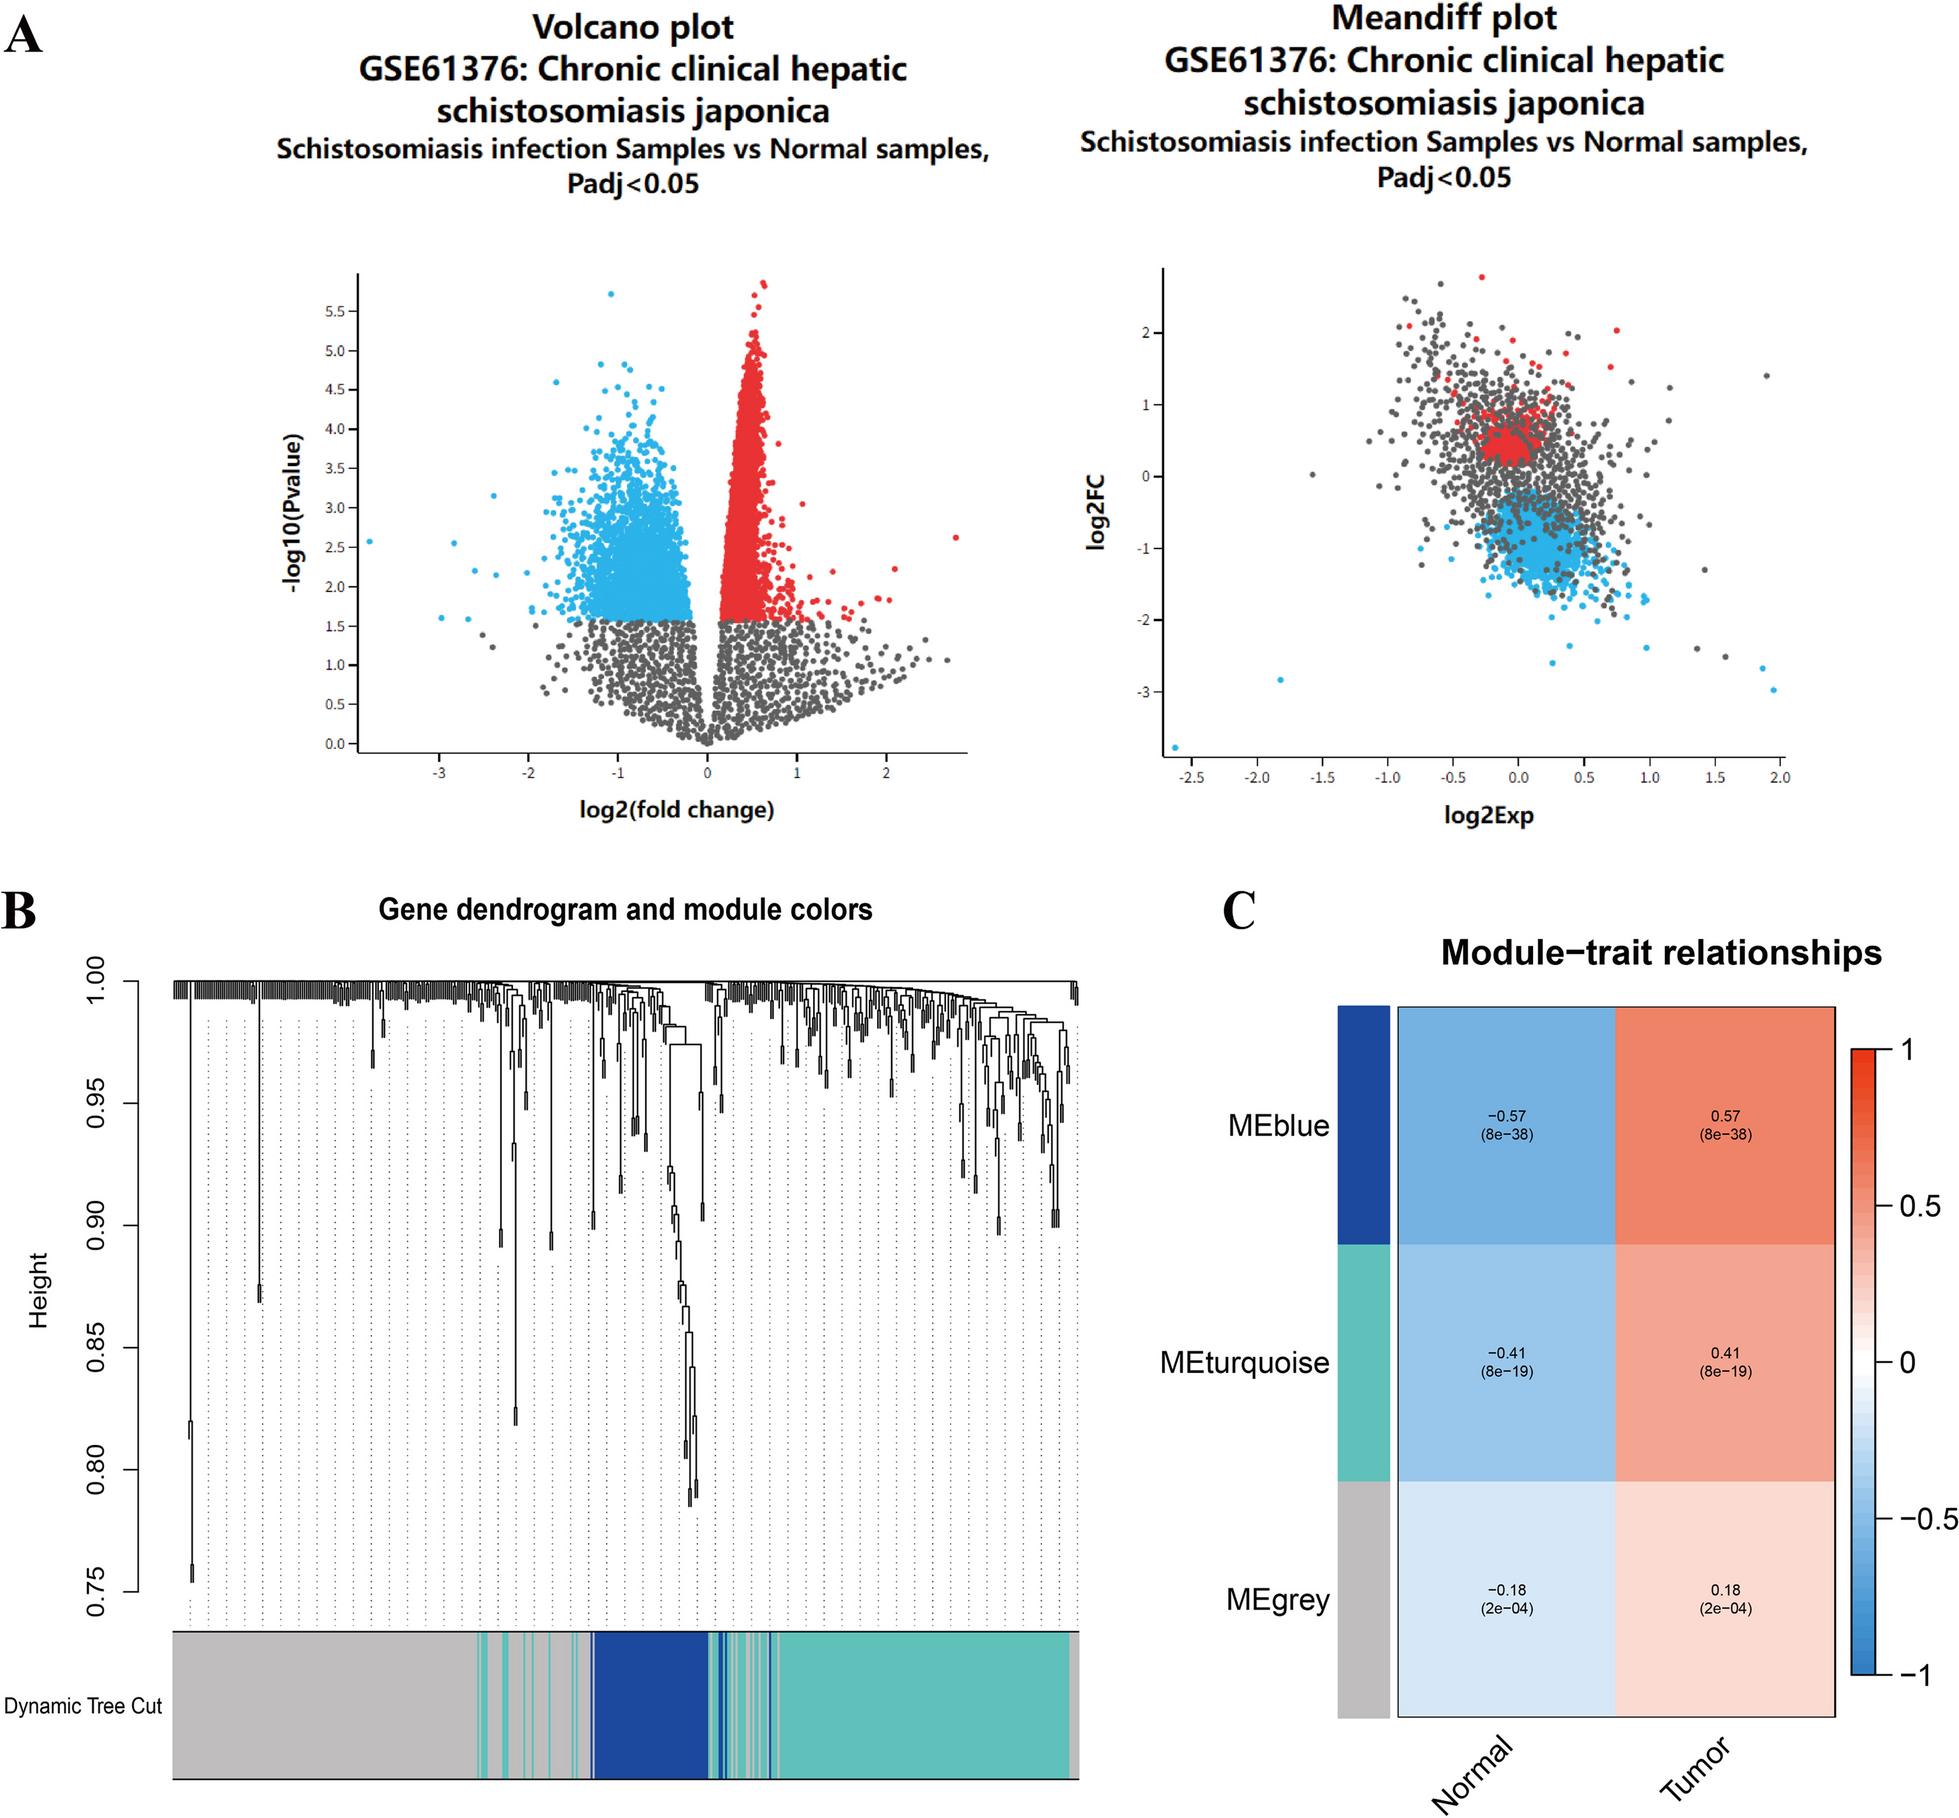
We utilized R software’s limma package [23] to conduct differential gene analysis by using cut-off values set at false discovery rate (FDR) < 0.05 and log2 | fold change |> 1. Based on these results, we acquired an itemized list of significant DEGs (differentially expressed genes) in the expression matrix. R software’s limma package was used to carry out the differential gene analysis. A false discovery rate (FDR) < 0.05 and log2 | fold change |> 1 were employed as cut-off values.
IRG function and pathway enrichment analyses
Necessary information for IRG biological pathway and functional analyses was obtained. A GO analysis of biological process (BP), molecular function (MF), and cellular component (CC) terms was performed. The R package clusterProfiler [24] was used for Kyoto Encyclopedia of Genes and Genomes (KEGG) pathway enrichment analysis. A false discovery rate (FDR) < 0.05 was considered statistically significant.
Protein–protein interaction (PPI) network
The PPI network was generated by the STRING database [25] through Cytoscape software [26]. Individual networks with 10 or more nodes were included, and those with fewer than 10 nodes were excluded. In each network node, the grade of the connectivity was computed, and the clusters were collected according to their typology to trace densely connected regions by molecular complex detection (MCODE).
Clinical samples
All serum samples, which included the serum samples of eighty-nine HBV-CH, ten HBV-LC, and eight HBV-HCC patients, were collected from Chiba University Hospital in Japan. The diagnosis of all the patients was based on pathological sections taken during surgical resection or liver biopsy, along with the detailed data of the B-HCC and B-LC/CH patients, which is itemized in Table 1. Use the METAVIR Score to understand the stages of liver fibrosis, and patients with F4 grade was diagnosed LC. The clinical characteristics of HBV markers were showed in Table 2. Serum samples and tissue samples were stored at − 20 °C and − 80 °C freezers, respectively, until need for use arose.
Table 1 Clinicopathological characteristics of B-CH, B-LC and B-HCC patientsTable 2 HBV serological markers characteristics of participants, number (%)Cell culture
HepG2.2.15 cells containing the complete HBV genome and supporting the assembly and secretion HBV DNA, were obtained from translational medicine research center (North Sichuan Medical College, Nanchong, China). We cultured human hepatoma HepG2 cells in Dulbecco’s modified Eagle’s medium, which we obtained from Invitrogen (Carlsbad, CA, USA). More specifically, the medium contained 10% heat-inactivated foetal bovine serum, 100 units/ml penicillin, and 100 µg/ml streptomycin from Sigma (St. Louis, MO, USA), and cells were cultured under a 5% CO2 atmosphere at 37 °C.
Real-time reverse transcription quantitative polymerase chain reaction (Real-time RT–qPCR)
We extracted total RNA from serum samples and HBV-paired serum samples. We used the standard protocols from the TaqMan microRNA Reverse Transcription kit (Applied Biosystems, California, USA) and TaqMan Universal Master Mix (Applied Biosystems) to perform reverse transcription and real-time PCR, respectively. The lin28B primers were as follows: 5’-CATGGTGGCAAACTGCCCACATAA-3’ (forwards) and 5’-TTCGTGGAGGAAGCTTCTTGAGGT-3’ (reverse). To normalize variance, we utilized GAPDH as an endogenous control. The primers were 5’-AGCCTCAAGATCATCAGCAATG-3’ (forwards) and 5’-TGTGGTCATGAGTCCTTCCACG-3’ (reverse). We obtained the Let-7c primers (479,365, Applied Biosystems, California, USA) from Applied Biosystems, and cel-miR-39 and U6 (4,427,975, Applied Biosystems, California, USA) were used as endogenous controls. We utilized relative quantification (2−ΔCT) to compute fold changes.
Cell proliferation assay
Using a cell counting kit-8 (CCK-8) assay kit (Dojindo, Kyushu Island, Japan), we assessed cell proliferation. In 96-well plates, we cultured HepG2 cells separately at a density of 5000 cells/well overnight. We transfected the cultures with Let-7c inhibitor and control. After 24 h, 48 h, 72 h, and 96 h of transfection, 10 μl of CCK8 solution was added to each well. The cells were cultured for 3 h. Using a Glomax multidetection system (Promega, Wisconsin, USA) according to the manufacturer’s instructions, we detected the absorbance level at 450 nm.
Western blotting
The cells were transfected with a Let-7c inhibitor. Additionally, 1X SDS lysis buffer was used to lyse the cells. SDS-PAGE was used to isolate proteins, which were transferred onto PVDF membranes. MYC (#9402, Cell Signaling Technology, Massachusetts, USA) and GAPDH (10,494–1-AP, Proteintech, Wuhan, Hubei, China) staining was detected. The Odyssey CLx Infrared Imaging System (LI-COR Biosciences, Lincoln Nebraska, USA) was used to visualize immunoreactive bands.
Statistical analysis
We executed the data analysis using SPSS Graduate Pack 21.0 (IBM, New York, USA), GraphPad Prism 5 software (GraphPad Software, San Diego, USA), or Student’s t test. The cut-off for statistical significance was P < 0.05.


留言 (0)