
記住我

This retrospective study was approved by the Institutional Review Board of Zhejiang Provinical People’s Hospital (NO. 2020QT108), which waived the informed consent of all patients.
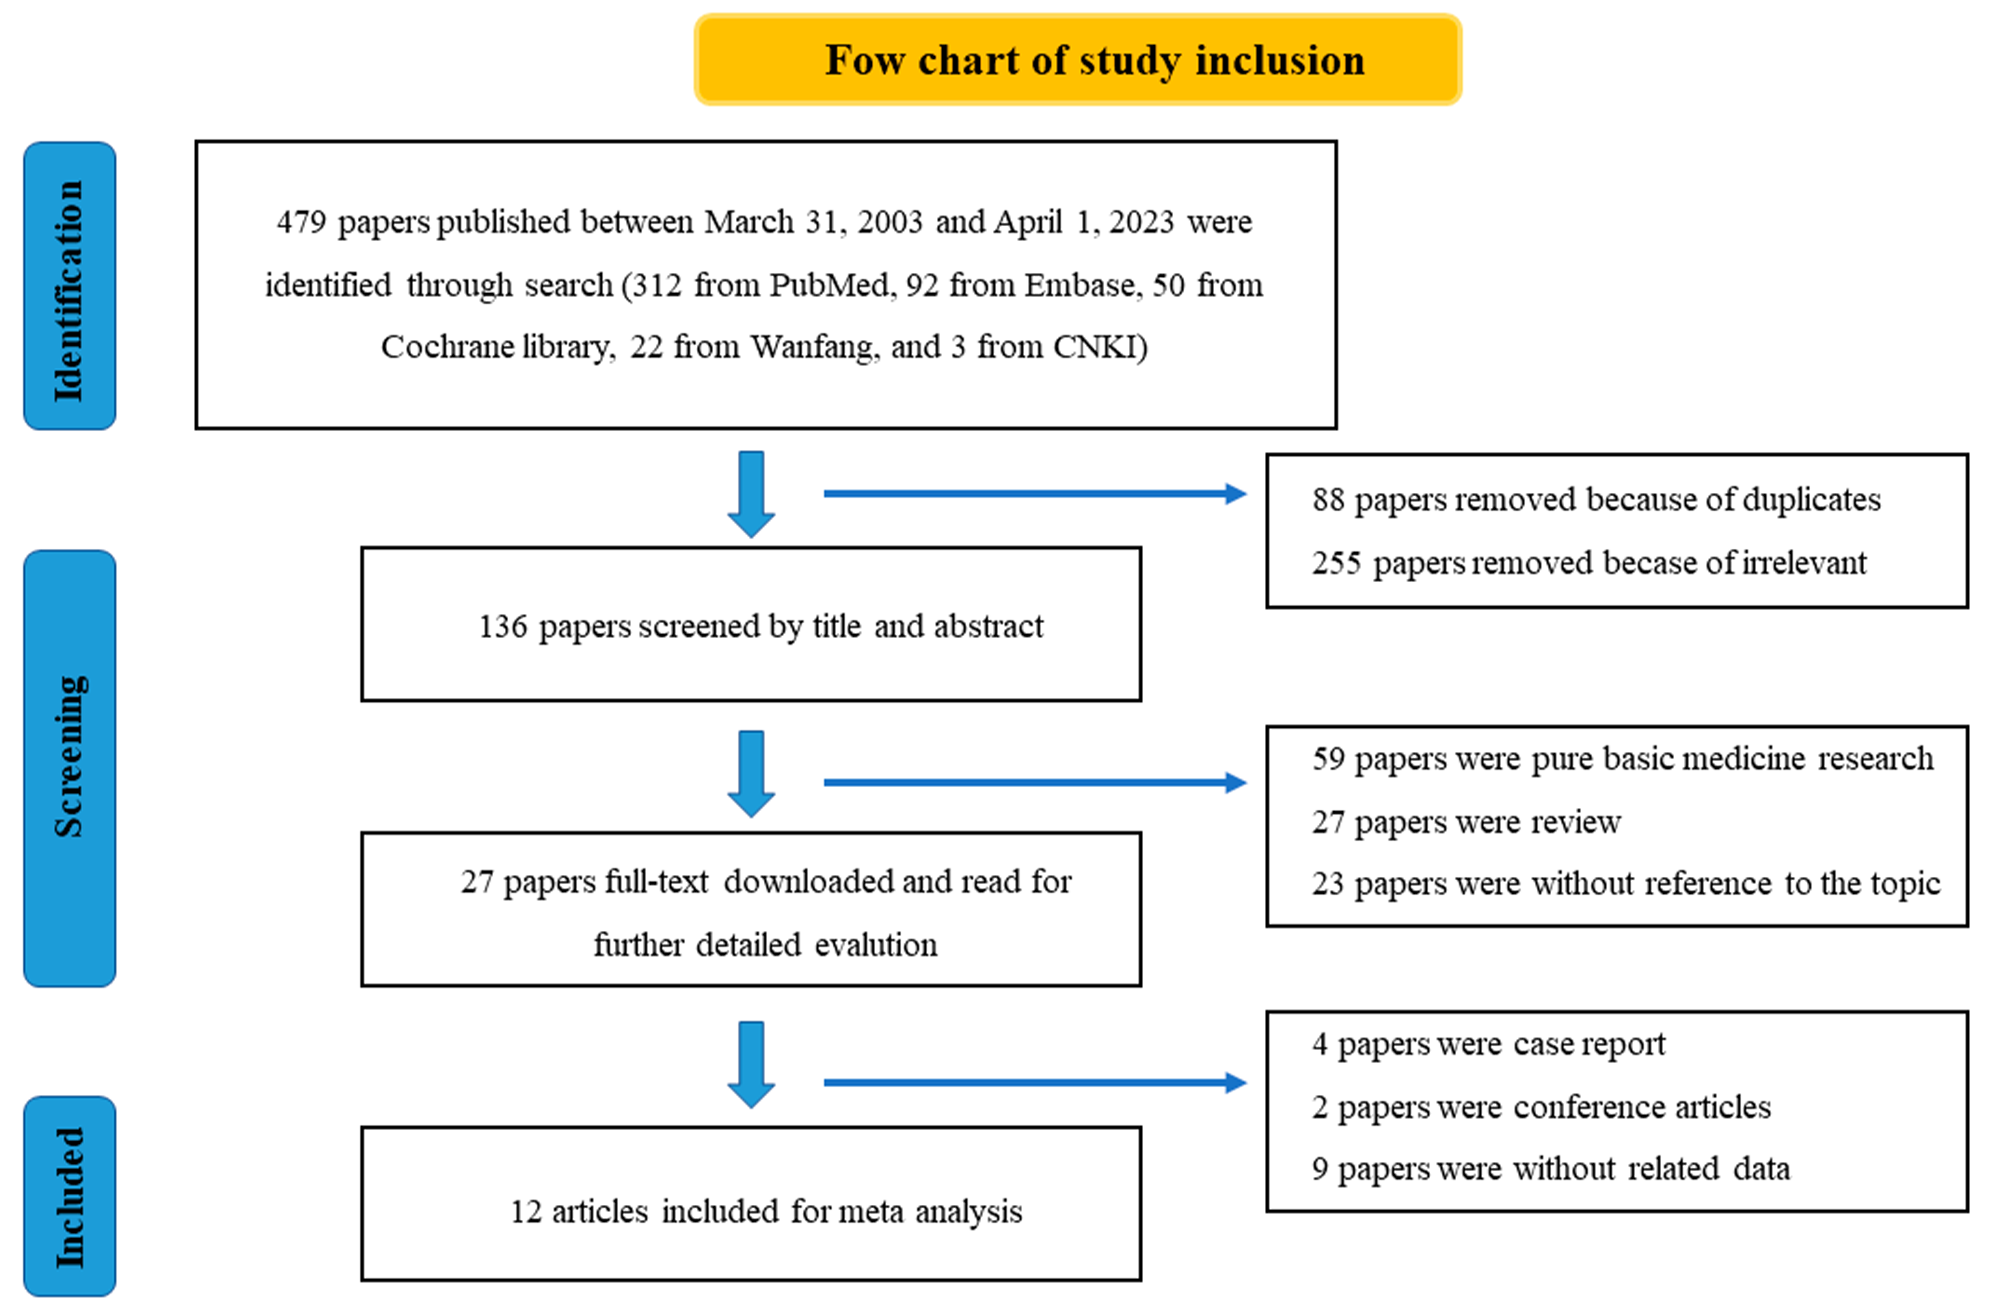
Patients screeningThis retrospective study enrolled 1094 patients who were pathologically diagnosed as lung adenocarcinoma after 6 years follow-up surveillance, including 826 patients with SPLAs and 268 MPLAs, from January 2014 to December 2020. Among these patients, there were 320 SPLAs and 225 MPLAs patients with regular surveillance were incorporated for delta-radiomics analysis (Fig. 1). The inclusion criteria were as follows: (1) tumors were classified to be MPLAs according to the criteria of the 2nd edition of ACCP evidence-based clinical practice guidelines [6] (Table 1); (2) patients had only one primary lung tumor at the time cut-off of inclusion were classified to be SPLAs; (3) patients were pathologically proved to be minimally invasive (MIA) or invasive adenocarcinoma (IAC) of lung; (4) patients underwent CT examinations with the same protocol. The exclusion criteria were as follows: (1) patients were pathologically confirmed to be atypical adenomatous hyperplasia, in situ adenocarcinoma, or pulmonary squamous carcinoma; (2) patients was pathologically confirmed by needle biopsy; (3) patients were treated with the methods of radiation, chemotherapy, or radio-chemotherapy.
Fig. 1
The flow diagram of patients selection
Table 1 The criteria to diagnose multiple primary lung carcinoma according to ACCPCT examination and volume of interest segmentationAll the patients underwent CT unenhanced examinations in Somanton Definition AS 64 or 128 CT (Siemens Medical Solutions, Germany). The scan parameters were as follows: tube voltage, 120 kVp; tube current, 200 mA; rotation speed, 0.75 s; beam pitch, 1.375; pixel matrix, 512*512; detector collimation, 64*0.625 mm; slice thickness, 2.0 mm; reconstruction interval, 2.0 mm; width of lung window, 1500HU; level of lung window, -600HU.
The tumoral volume of interest (VOI) was depicted in software of “ITK-snap 3.8.0” (http://www.itksnap.org/pmwiki/) by two radiologists with 10 (Doctor Ma) and 12 years (Doctor Li) of experience, manually (Fig. 2a, b). Then, the radiomic features were automatically calculated in software of “A.K. 3.0.0” (GE Healthcare) after steps of preprocessing involved resampling images to be 1.0 mm at X/Y/Z space, reducing the image noise by a method of Gaussian, and discretizing the gray level to the range of 1 to 32. The intra-class correlation coefficients (ICCs) of radiomic features from two radiologists were calculated to evaluate the agreement between different observers. The radiomic features with ICCs greater than 0.75 were selected and the mean values of radiomic features from two radiologists were calculated for further analysis.
Fig. 2
The VOI of tumor was manually depicted in the software of “ITK-snap”
Radiomics and delta-radiomics analysisPrior to radiomic analysis, the steps of excluding variables with zero variance, replacing abnormal values by median values, and standardization were adopted to normalize radiomic features. Then the cohort was divided into the training set and testing set with a random proportion of 7:3. In order to eliminate the influence of unbalanced sample size, the way of synthetic minority over-sampling technique (SMOTE) was carried out [12]. After the methods of analysis of variance, correlation analysis with a threshold of 0.7, and gradient boosting decision tree (GBDT), the optimal radiomic features were extracted. Ultimately, the corresponding machine learning based classifiers including Bayes, forest, k-nearest neighbor, logistic regression, support vector machine, and decision tree algorithms were developed to identify MPLAs and SPLAs. The relative standard deviation (RSD) was calculated and the classification model with minimal RSD was chosen for further analysis. The area under the curve (AUC) with 95% confidence interval (95%CI) of receiver operator characteristic curve (ROC) was quantified to evaluate the efficiency of the machine learning based classifiers.
With consideration of the different progression during regular follow-up surveillance between MPLAs and SPLAs, the delta-radiomics was utilized. The delta-radiomics was defined as the change of radiomic features between baseline and follow-up surveillance, which was divided into three groups including Group A (3–12 months), Group B (13–24 months), and Group C (25–48 months), according to different follow-up surveillance. The equation of delta-radiomics was: (follow-up radiomics—baseline radiomics)/follow-up interval. The specific information of radiomics and delta-radiomics analysis were listed in Supplementary Material.
StatisticsThe general clinical characteristics were analysis by software of “SPSS 22.0” with methods of student’s t-test or chi-square test. The methods of radiomic feature selection including variance, correlation analysis, GBDT, and machine learning algorithms were performed by the software of “Python 3.5”. The ROC curve was delineated by the software of “MedCalc 15.8”. A p-value less than 0.05 indicates statistical significance.
留言 (0)