
記住我


A total of 235 prospective participants were recruited through public social media activities. Prospective participants registered their interest initially through an online screening form, followed by an e-consult of a comprehensive assessment including medical history and medications to establish eligibility. A total of 70 participants aged between 32 and 75 years met the inclusion and exclusion criteria and, following the provision of written informed consent, were enrolled in the study.
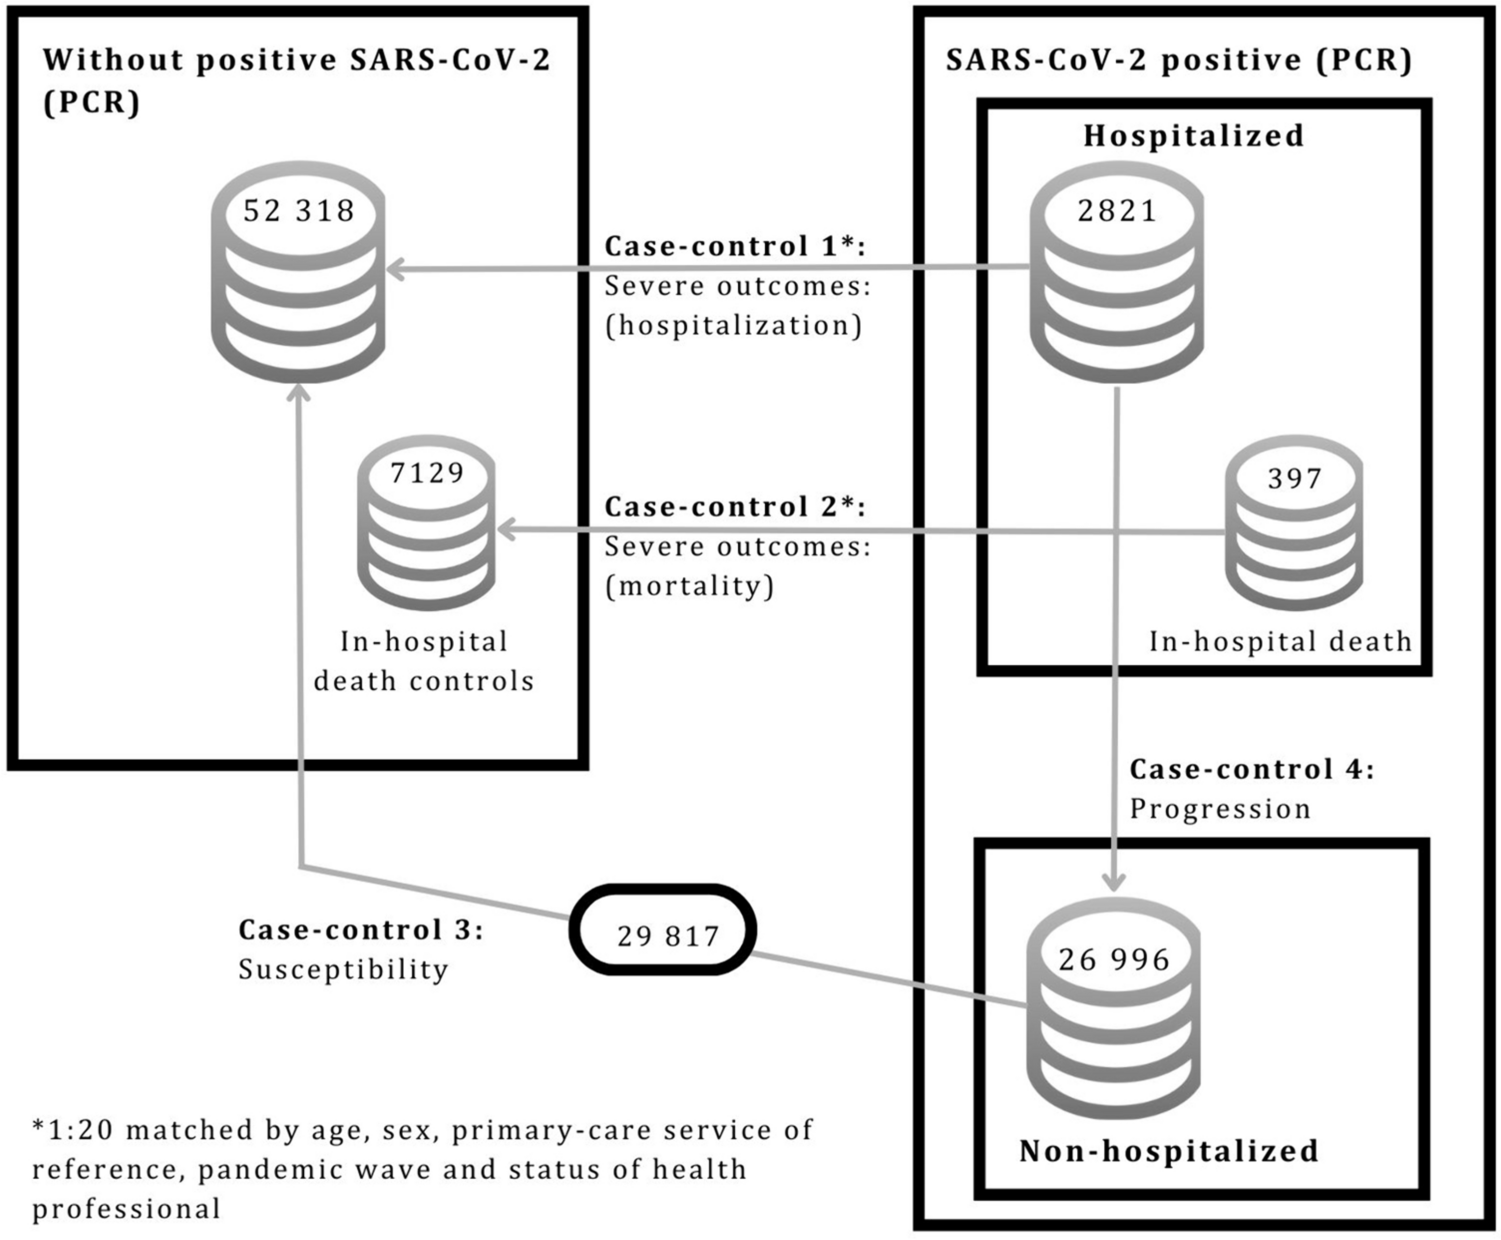
The final analysis group included 66 participants (Fig. 1, Table 1), 33 in each arm. Four participants were excluded from analysis: three due to incomplete baseline assessments and one due to pre-existing (unknown) disease that was an exclusion criterion (Fig. 1). The cohort included three participants with type 1 and 62 with type 2 diabetes (Table 1). The groups had a different ratio of men to women, but there was no significant difference in baseline health parameters of body weight, BMI, blood pressure and lifestyle factors (Table 1). All participants were taking prescribed diabetic medications, and the majority were also taking prescribed pain medications as well as other medications for co-morbidities (Table 1).
Fig. 1
Participant progress CONSORT flow chart
Table 1 Baseline CharacteristicsCorrelations between glucose metabolism, pain, sleep and moodThere was a wide range in fasting blood glucose (FBG) and glycosylated haemoglobin (HbA1c) levels, despite the participants taking prescribed anti-diabetic medications (Table 3). The baseline FBG levels correlated with HbA1c levels (r = 0.662, P < 0.001). There were correlations between glucose metabolism and pain indices; particularly, a negative correlation between HbA1c and NPSI evoked pain (r = − 0.251, P = 0.045) and FBG and BPI-PN Pain Severity Index (r = − 0.322, P = 0.01), BPI-PN total pain (r = − 0.370, P = 0.003), the NPSI paroxysmal pain (r = − 0.266, P = 0.03), evoked pain (r = − 0.347, P = 0.005) and paraesthesia/dysesthesia (r = − 0.257, P = 0.04). Furthermore, CRP positively correlated with both NPSI deep pain (r = 0.261, P = 0.04) and fibrinogen levels (r = 0.387, P = 0.002). There was also a positive correlation between BPI-PN pain interference and depression scores (r = 0.431, P < 0.001), anxiety scores (r = 0.275, P = 0.03), stress scores (r = 0.270, P = 0.03) and sleep quality (r = 0.276, P = 0.03). Furthermore, CRP positively correlated with both NPSI deep pain (r = 0.261, P = 0.04) and fibrinogen levels (r = 0.387, P = 0.002) (Figs. 2 and 3).
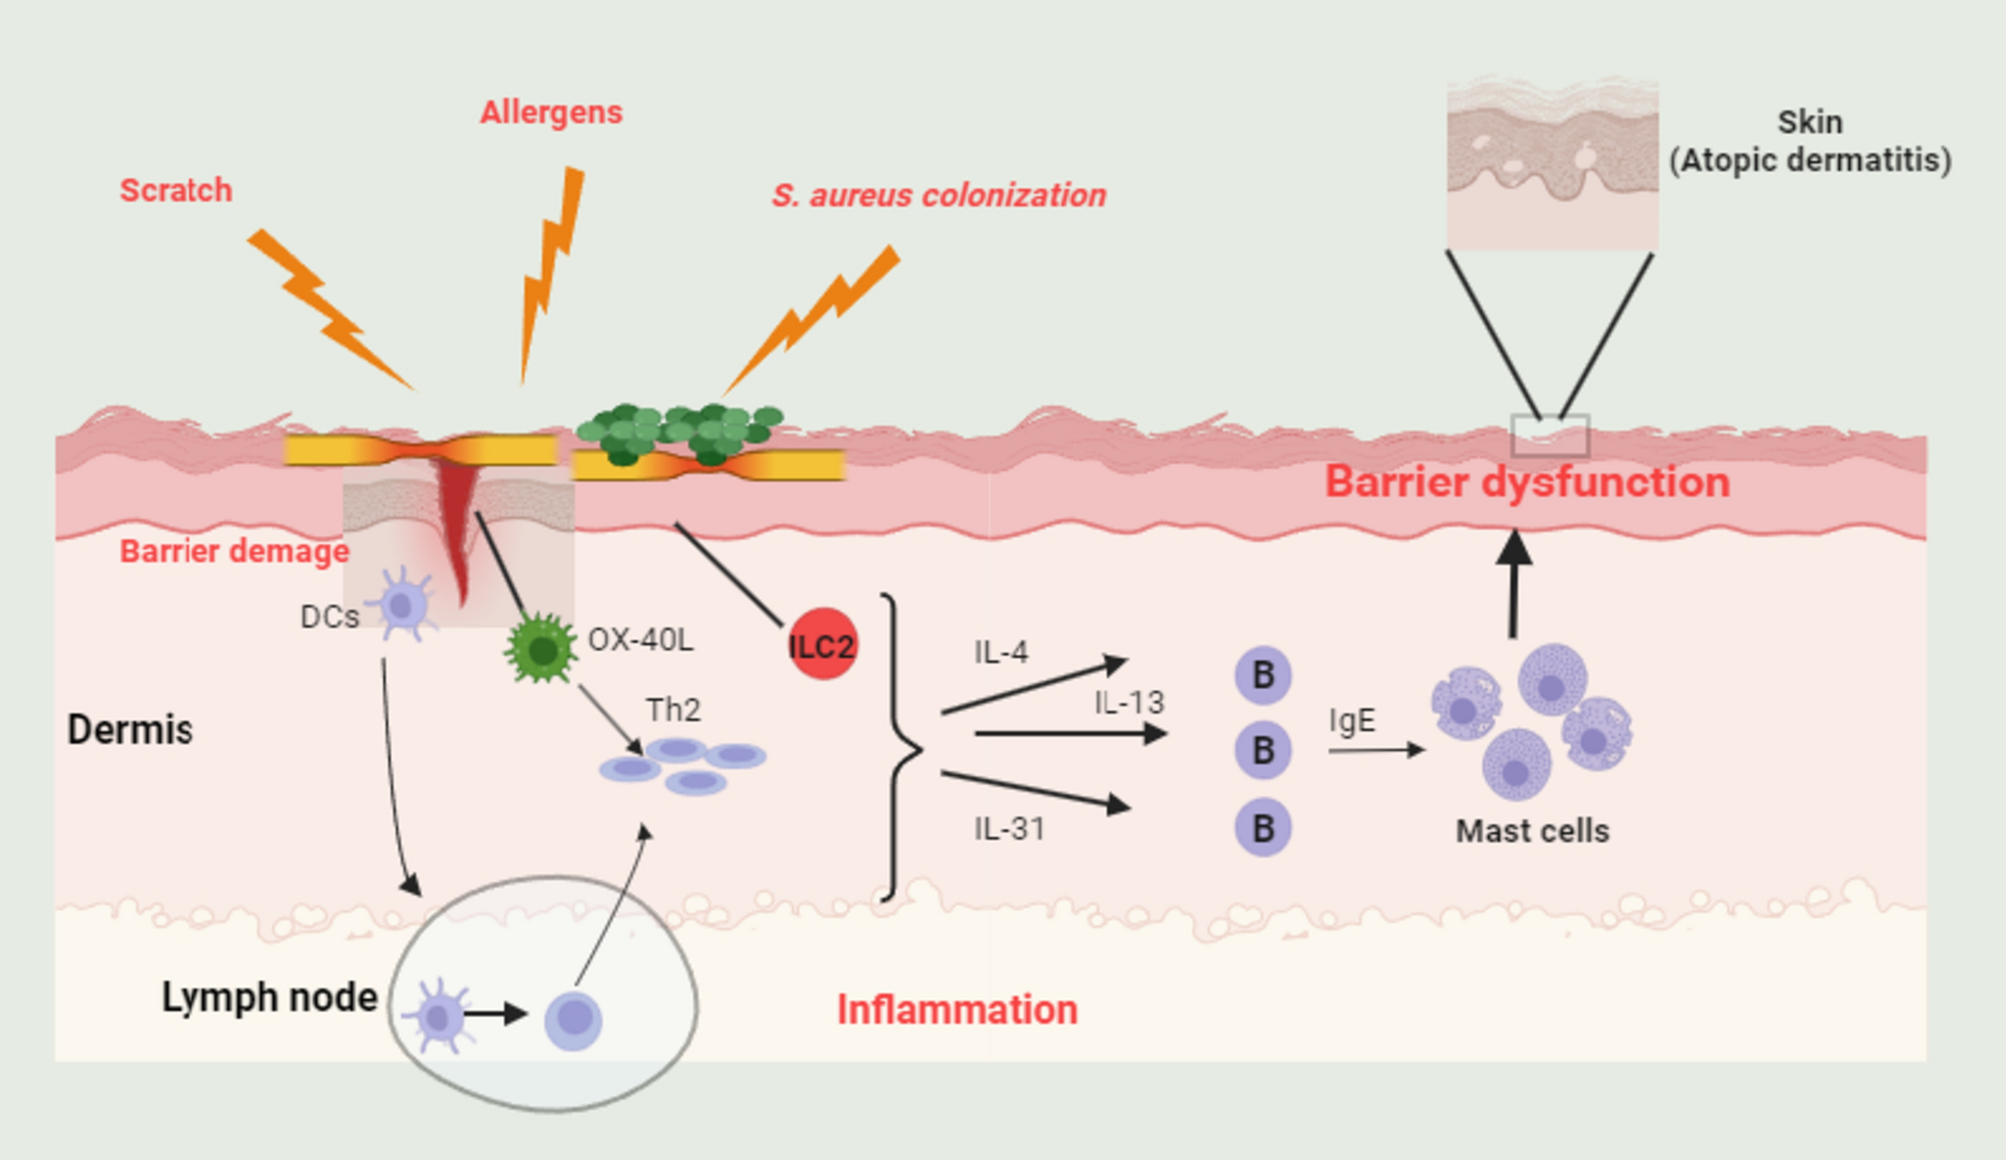
Fig. 2
BPI-PN (A) Pain Severity scores at baseline, 2, 4, 6 and 8 weeks and (B) Pain interference score at baseline, 4 and 8 weeks scores for the active treatment group and the placebo group
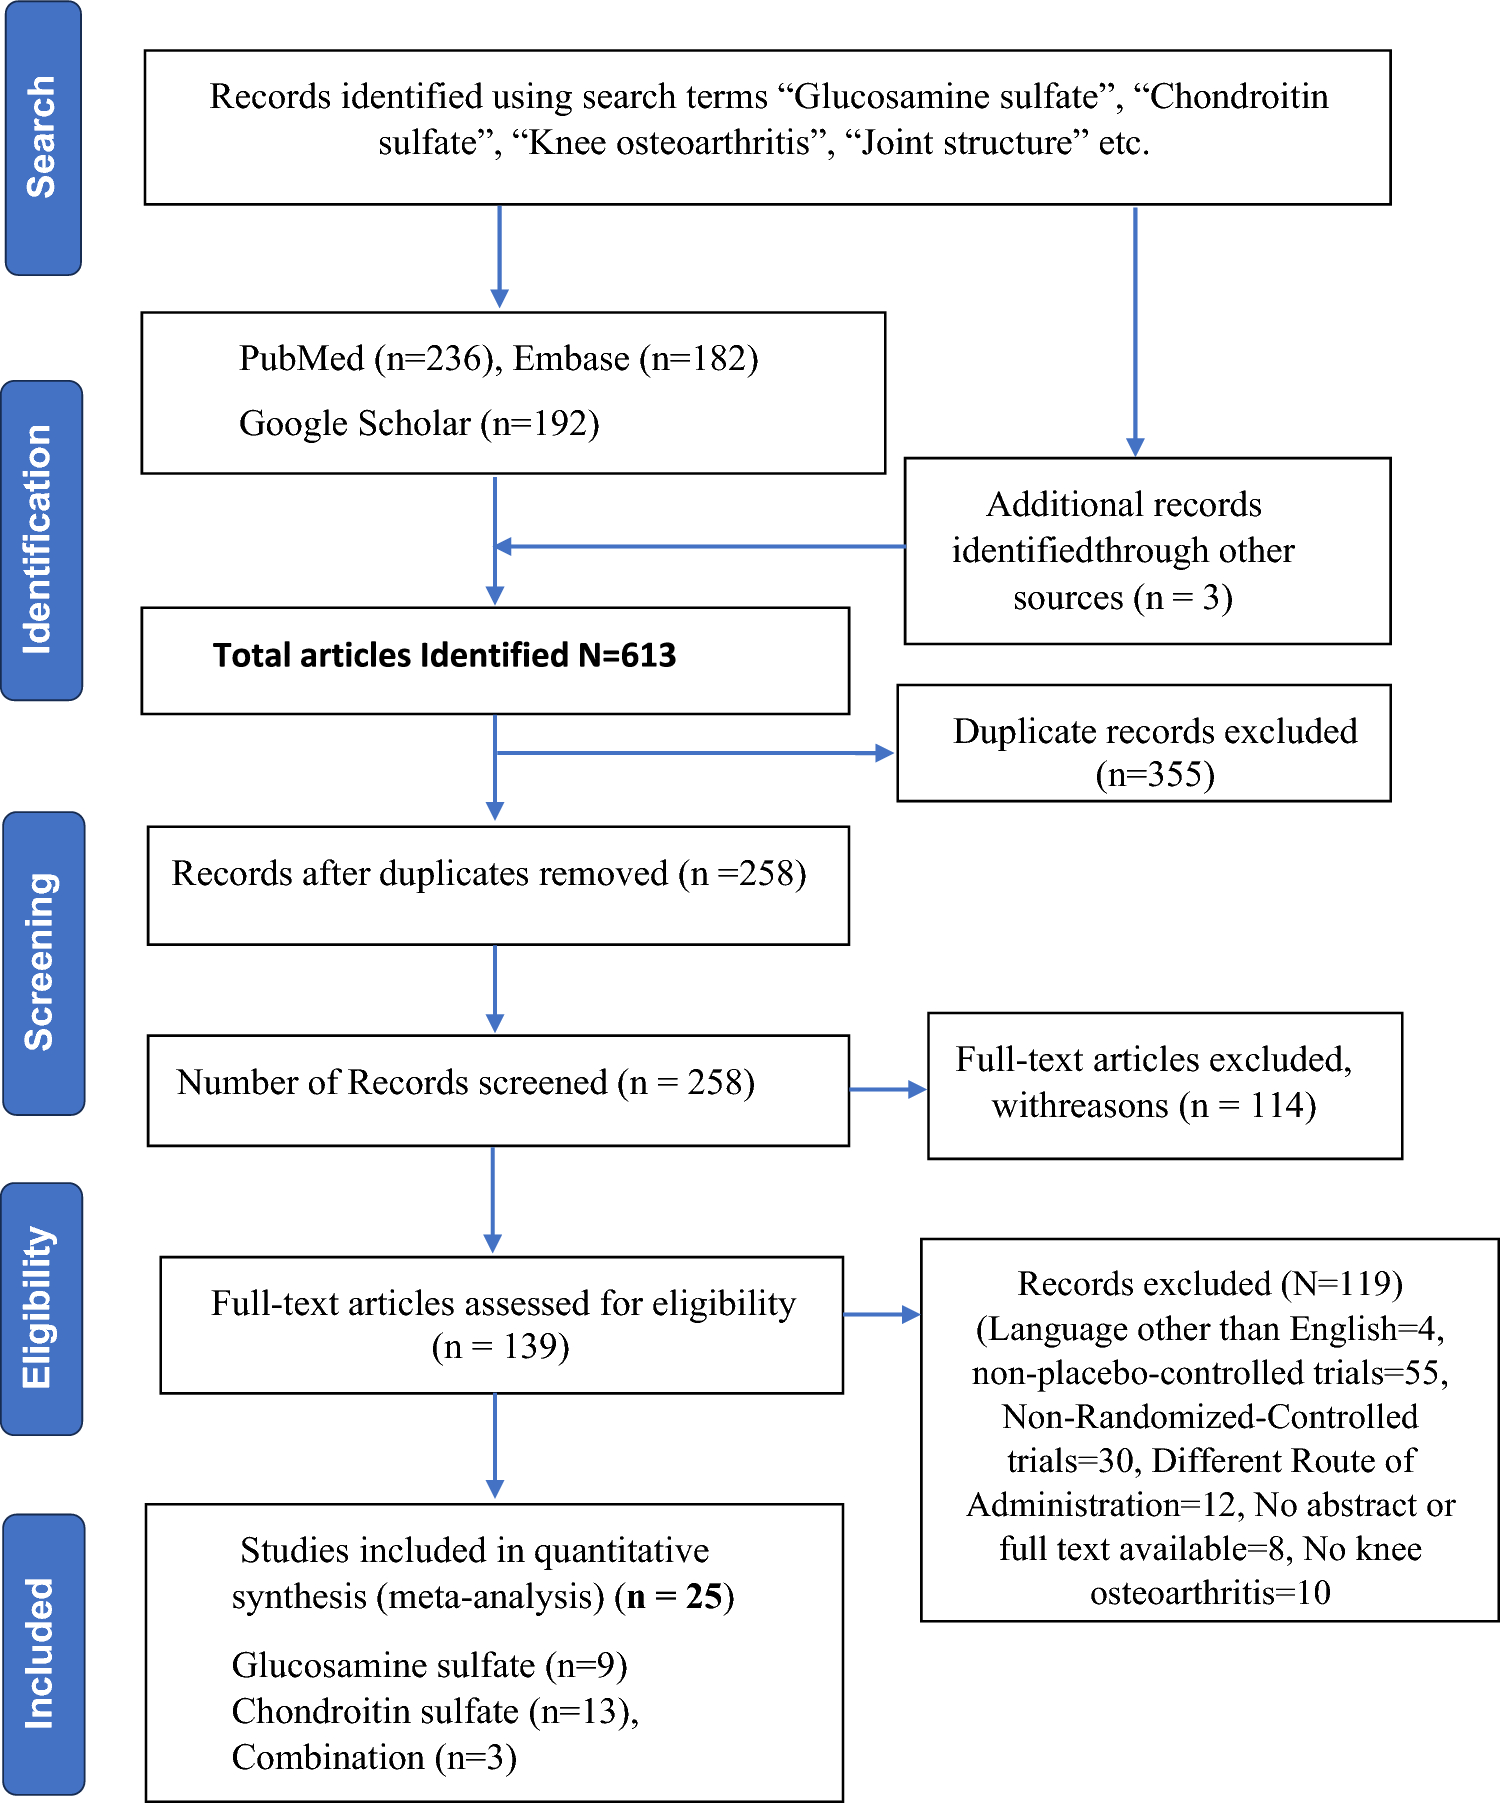
Fig. 3
Neuropathic Pain Symptom Inventory (NPSI) total and sub-scores for the active treatment group and the placebo group at 8 weeks
Effect of treatment on neuropathic pain severity and interference (BPI-DPN)Pain severityPain severity as measured by the Brief Pain Inventory Short Form for Diabetic Peripheral Neuropathy (BPI-DPN) was not statistically different between groups at baseline, (P = 0.46) with most participants in both groups exhibiting mild to moderate pain (score of 2–7), (Table 2). Repeated measures ANOVA revealed a both time [F (4,64) = 21.03, P < 0.001] and treatment [F (1,64) = 23.52, P < 0.001] effect for the investigational product over 8 weeks of the study. Further analysis indicated that there was a significant difference in pain severity between groups at week 2 (P = 0.002), which continued at weeks 4, 6 and 8 (P < 0.001) (Table 2). Interestingly, a progressive and significant improvement in treatment group over placebo group in pain scores was observed as the study progressed.
Table 2 BPI-PN pain outcome scores for active treatment group and placebo group at baseline, 2, 4, 6 and 8 weeksPain interferencePain interference as measured by the BPI-DPN was not significantly different between treatment groups at baseline (P = 0.15), (Table 2). When evaluating the effect of treatment on pain interference at week 4 and week 8, significant differences were observed between the two treatment groups [F (1,64) = 12.60, P ≤ 0.001] and the two time points [F (2,64) = 12.60, P ≤ 0.001]. At week 4, there was a significant difference between the means of the active treatment and placebo group (P = 0.001). Week 8 means also were significantly different between groups (P ≤ 0.001) with a greater change from baseline in the active group (−1.90) than the placebo group (−0.39).
Effect of treatment on neuropathic pain symptoms (NPSI)All measurements of neuropathic pain symptoms as measured by the NPSI were similar between groups at baseline (P ≥ 0.05, Table 3). By week 4, there was a significant difference between the active treatment and placebo groups for total pain score (P ≤ 0.001), superficial spontaneous pain (P ≤ 0.001), deep pain (P = 0.03), paroxysmal pain (P ≤ 0.001) and paraesthesia (P = 0.01). All these sub-scores were also found to be significantly different at week 8 for total pain (P ≤ 0.001), superficial pain (P ≤ 0.001), deep pain (P = 0.002), paroxysmal pain (P ≤ 0.001) and paraesthesia (P ≤ 0.001). The sub-score for evoked pain, however, was not significantly different between groups at week 4 (P = 0.25) yet was trending towards a significant difference by week 8 (P = 0.09).
Table 3 NPSI Pain outcome scores for active treatment group and placebo group at baseline, 4 and 8 weeksInfluence of prescribed pain medications on treatment effectThe use of pain medication was not associated with any difference in BPI-PN pain severity, NPSI total and sub-scores at completion of treatment in either group. The mean pain medication index expressed as the number of non-treatment medication found no difference between treatment groups for total medications (prescribed and rescue) or rescue medications used.
Effect of treatment on glucose metabolism and inflammatory markersThe treatment groups varied widely in glucose metabolism parameters (FBG and HbA1c) and the inflammatory markers (IL-6, fibrinogen and CRP) (Table 4). All markers were not significantly different at baseline (P > 0.05). At 8 weeks, there was no significant difference between the active treatment and placebo group for fasting blood glucose, HbA1c, fibrinogen and CRP when analysed as a whole group across all levels (P > 0.05). A sub-group analysis of participants with CRP levels of ≥ 5.0 mg/L at baseline was similar at baseline (P = 0.18); however, at 8 weeks the active treatment and placebo group demonstrated a significant difference between means (P = 0.05). For IL-6, the groups were also similar at baseline (P = 0.44); however, a significant difference was recorded at 8 weeks between the active treatment group and the placebo group (P = 0.04).
Table 4 Effect of treatment on glucose metabolism and inflammatory markers at for the active treatment group and placebo group at baseline and week 8Effect of treatment on sleepThe groups were similar at baseline for all the Medical Outcomes Study—Sleep Scale (MOS) subscale scores (P ≥ 0.05), (Table 5). At 8 weeks, there was a significant difference between the active treatment group compared with the placebo group in the sub-scores of sleep disturbance (P = 0.001), sleep adequacy (P = 0.001), daytime somnolence (P ≤ 0.001), shortness of breath or headache (P = 0.04) and the total sleep problem index (P ≤ 0.001). There was no significant change after 8 weeks for sleep quantity (P = 0.52) or snoring (P = 0.22).
Table 5 MOS sleep sub-scores for active treatment group and placebo group at baseline, 4 weeks and 8 weeksEffect of treatment on the mood parameters depression, anxiety and stressGroups were statistically different at baseline for depression (active: 2.06 ± 2.95, placebo: 3.97 ± 3.75, P = 0.02) and anxiety scores (active: 0.64 ± 1.34, placebo: 2.03 ± 2.89, P = 0.02), but not stress scores (active: 2.94 ± 3.46, placebo: 4.15 ± 3.41, P = 0.16), so analysis was performed on change scores. At 8 weeks, change scores were significantly different between the active treatment and placebo groups for depression (active: −1.27 ± 4.41 vs placebo: 0.09 ± 1.74, P = 0.02, d = −0.562, CI = −1.052 to −0.067) and were trending towards significance for stress (active: −1.36 ± 2.46 vs −0.39 ± 2.05, P = 0.09). There was no significant change in anxiety levels for either group by the end of 8 weeks (active: −0.333 ± 0.85 vs placebo: −0.545 ± 1.23, P = 0.42).
Safety and tolerability of treatmentThere were no changes observed for the independently reported laboratory markers for participant electrolytes, kidney and liver function. It is noteworthy, though, that blood glucose levels in both groups rose significantly over 8 weeks of the clinical trial period (change in fasting glucose from baseline: active + 0.88 mmol/L (+11.12%) P = 0.129, placebo + 0.95 mmol/L (+10.85%) P = 0.041, Table 4). Haematology parameters remained constant throughout the 8-week clinical trial except for a significant difference in the eosinophil count (0.04 vs −0.02, P = 0.01). There were several mild and short-duration adverse events reported by participants during the 8-week study period, which resolved over a few days without withdrawing from the study. These included intermittent mild headaches (n = 1, active treatment; n = 1, placebo), episodes of constipation (n = 1, active treatment), urticaria for 5 days (n = 1, active treatment), a severe fatigue episode (n = 1, placebo group) and respiratory infections not requiring additional medications (n = 3, placebo group) during the study. All adverse events resolved during the 8-week study period, and no participant was withdrawn from the study because of an adverse event.
留言 (0)