
記住我

After excluding duplicates, the online search retrieved 271 articles. According to the above selection criteria, 62 articles were initially selected, and 33 [16,17,18,19,20,21,22,23,24,25,26,27,28,29,30,31,32,33,34,35,36,37,38,39,40,41,42,43,44,45,46,47,48] were finally included in the systematic review (Fig. 1).
Fig. 1 Qualitative Analysis (Systematic Review)
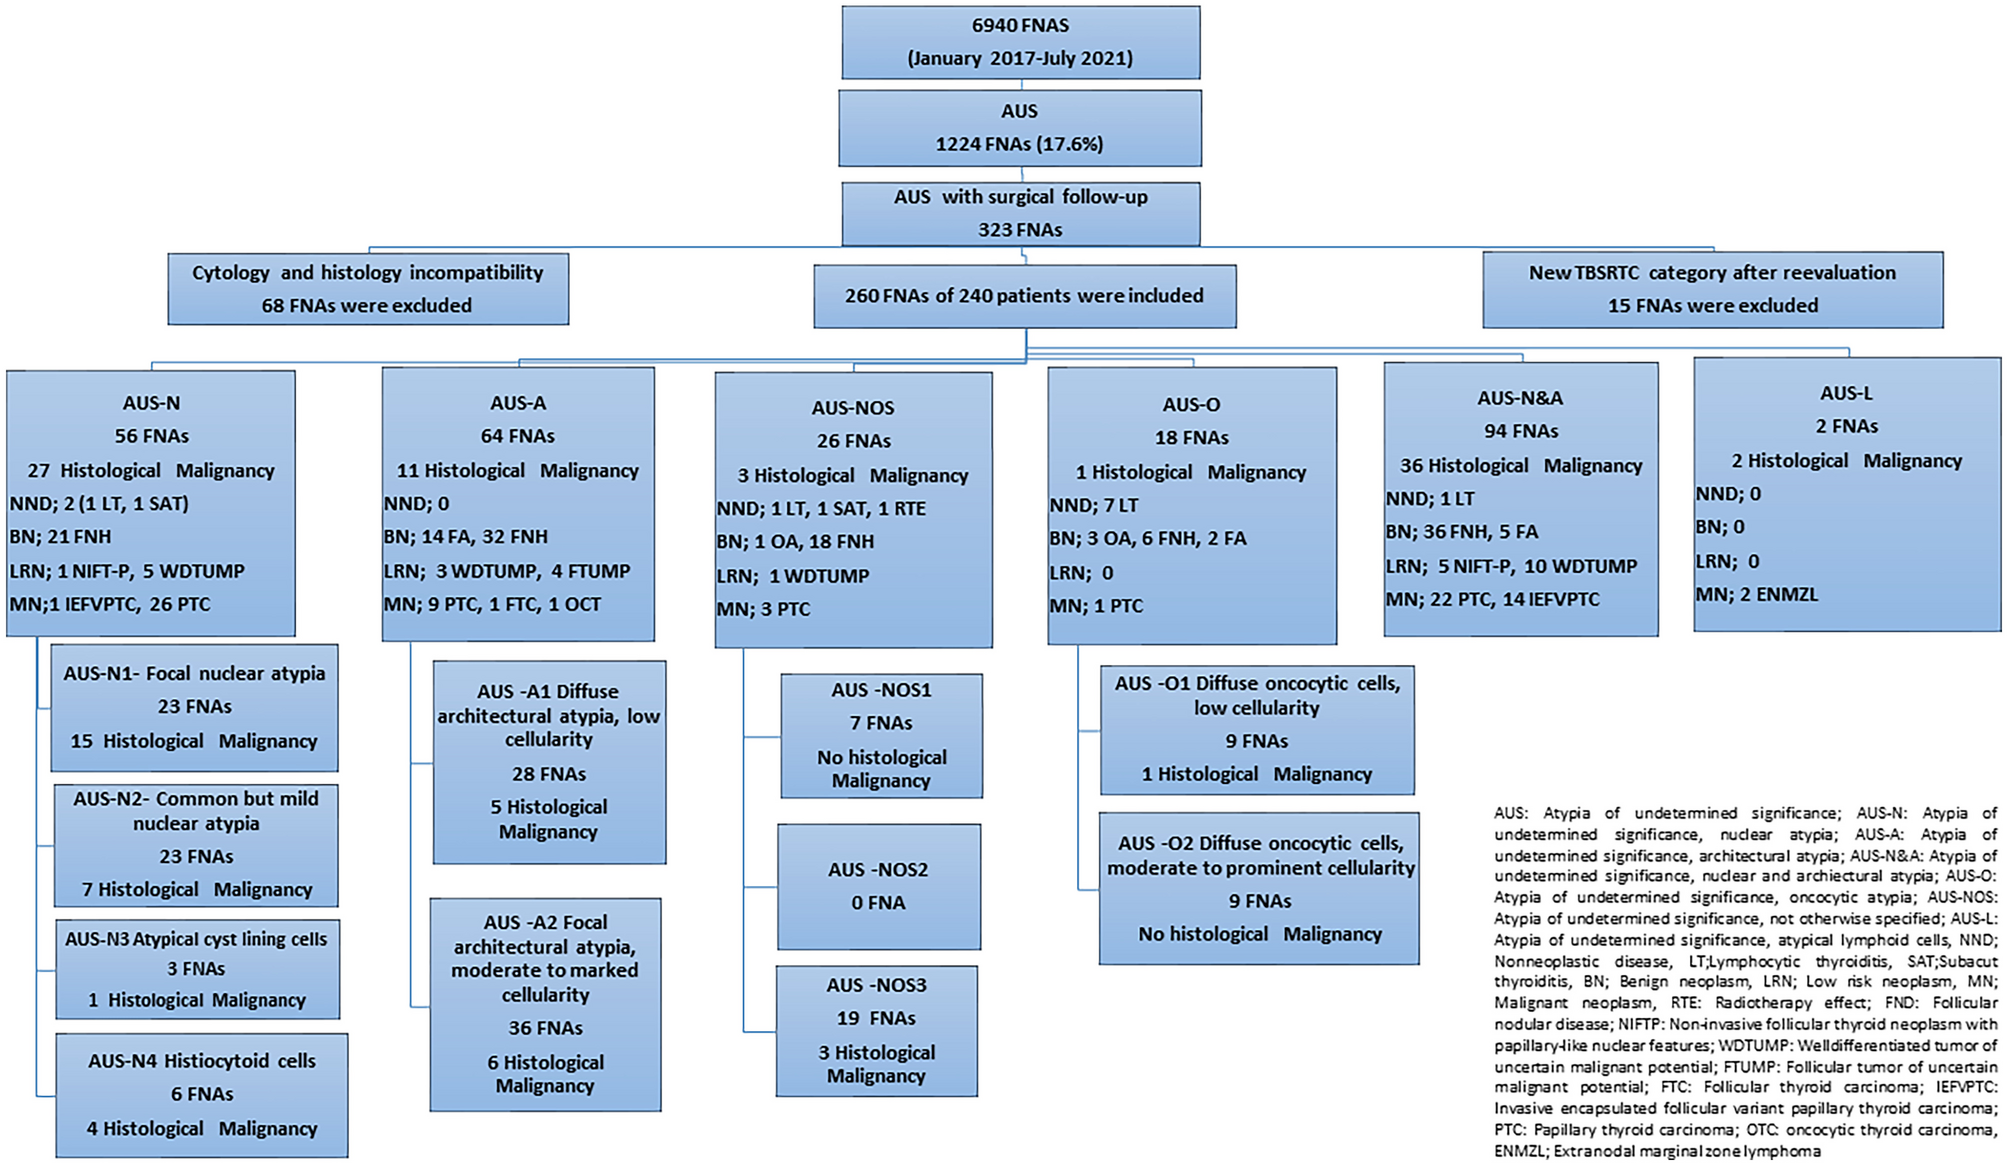
The 33 articles were published between 2014 and 2021 in scientific journals in the fields of endocrinology (n = 23), cytopathology (n = 3), medicine (n = 3), oncology (n = 2), surgery (n = 1), and radiology (n = 1). The seven oldest studies included nodules originally classified as TIR3 [49], and all cases were reclassified as TIR3A or TIR3B according to the 2014 ICCRTC [7]. Nineteen studies considered nodules first classified as TIR3A or TIR3B, and the remaining 7 papers reported both cases. The overall number of FNACs performed during the study period was available in 20 studies. The total number of ITNs operated on with histological follow-up was 4940, and there were 1516 cases of cancer. Tables 1 and 2 illustrate the main characteristics and full data of the 33 studies.
Table 1 Main characteristics and data of the included studiesTable 2 Demographic features and nodule’s size of the included studiesStudy Quality AssessmentThe assessment of the risk of bias of each study is detailed in the Supplemental data. For all articles, statement of the study question, inclusion and exclusion criteria, exposure of interest (i.e., FNAC), timeframe between exposure and outcome (i.e., histology), and outcome measures were adequate. In two studies, the population was not properly defined [16, 28]. Sample size justification was never reported. Whether the participation rate of eligible persons was at least 50%, it was unclear in 16 studies [16, 17, 19, 24, 26, 28, 30, 33, 35, 37, 41,42,43,44,45,46]. A loss to follow-up after baseline below 20% was reported in 16 studies [16,17,18,19,20, 22, 23, 27, 30, 31, 34,35,36, 40, 43, 45].
Quantitative Analysis (Meta-analysis)First, the pooled prevalence of cancer among all ITNs was evaluated, and a rate of 32.4% (95% CI 29.2–35.5) was found with high heterogeneity (I2 78%). Neither study design (i.e., studies with nodules classified as TIR3A or TIR3B during clinical practice vs. the other ones) nor sample size could explain this finding. However, when the largest study [48] was excluded, an inverse correlation was found between sample size and cancer rate (p = 0.025): the higher the sample size was, the lower the cancer rate.
Second, the pooled group of 2626 TIR3A cases was analyzed. The cancer prevalence was 12.4% (95% CI 8.8–15.9), with high heterogeneity (I2 90%). As described above, heterogeneity was explored according to the study design and sample size. Concerning the former aspect, there was no difference between the subgroup of studies reporting data of nodules reclassified as TIR3A and that of studies including nodules assessed as TIR3A during clinical practice. Regarding the sample size, the meta-regression analysis found a significant linear correlation between sample size and cancer rate (p = 0.009): the higher the sample size was, the higher the cancer rate (Fig. 2). However, this result depended on the high weight of the largest study [48], without a significant difference after excluding that series.
Fig. 2
Meta-regression analysis to explore the cancer rate of TIR3A according to study sample size. Any circle identifies one study, and its size differs according to the study weight
Third, the pooled group of 2314 TIR3B nodules was investigated. The cancer prevalence in this category was 44.4% (95% CI 40.1–48.8) with moderate heterogeneity (I2 75%). The heterogeneity was explored as described above according to study design and sample size. The study design did not explain the heterogeneity. However, the meta-regression considering the sample size showed a significant inverse correlation between sample size and cancer rate (p = 0.031): the higher the sample size was, the lower the cancer rate (Fig. 3). Since the largest study [48] influenced the results of ITN and TIR3A, this was also verified in TIR3B; when excluding that study, the significance of the correlation increased (p = 0.001).
Fig. 3
Meta-regression analysis to explore the cancer rate of TIR3B according to study sample size. Any circle identifies one study, and its size differs according to the study weight
Fourth, the prevalence of ITN, TIR3A, and TIR3B among all FNACs was analyzed. Among those 20 studies reporting the overall number of biopsies performed during the study period, after excluding papers reporting only FNACs with ITN results, there were 16 studies eligible for this analysis [21, 25, 27,28,29, 32,33,34,35, 37, 40, 42,43,44, 47]. Overall, the prevalence of ITNs among FNACs was 29.6% (95% CI 25–34.1), with high heterogeneity (I2 98%). When sample size was used as a covariate, a significant inverse correlation was found between the study sample and ITN prevalence (p = 0.002): the higher the sample size was, the lower the ITN prevalence. The pooled prevalence of TIR3A among FNACs was 12.6% (95% CI 10.1–15.2), with high heterogeneity (I2 96%), remaining unexplained by meta-regression analysis using sample size as a covariate (p = 0.14). The pooled prevalence of TIR3B among FNACs was 12.9% (95% CI 10.5–15.3), with high heterogeneity (I2 97%). When sample size was used as a covariate, a significant inverse correlation was observed between sample size and TIR3B prevalence (p = 0.04): the higher the sample size was, the lower the prevalence of TIR3B (Fig. 4).
Fig. 4
Meta-regression analysis to explore the prevalence of TIR3B among FNACs according to study sample size. Any circle identifies one study, and its size differs according to the study weight
Fifth, the operation rates of ITN, TIR3A, and TIR3B were analyzed. For this analysis, 12 studies were eligible [21, 25, 27, 29, 34, 35, 39,40,41,42, 46, 47]. The operation rate of all ITNs was 54.3% (95% CI 38.2–70.5) with high heterogeneity (I2 99%), leaving the latter unexplained when performing a meta-regression analysis using sample size as a covariate (p = 0.20). When considering the TIR3A group, the operation rate was 48.3% (95% CI 21.9–74.6), with high heterogeneity (I2 99%). The latter was explored using the sample size of TIR3A, and a significant inverse correlation was observed between sample size and TIR3A operation rate (p = 0.010): the higher the sample size was, the lower the operation rate (Fig. 5). When analyzing the TIR3B group, the operation rate was 75.2% (95% CI 65.9–84.5), with high heterogeneity (I2 98%), leaving the latter unexplained when performing a meta-regression analysis using sample size as a cov
留言 (0)