
記住我
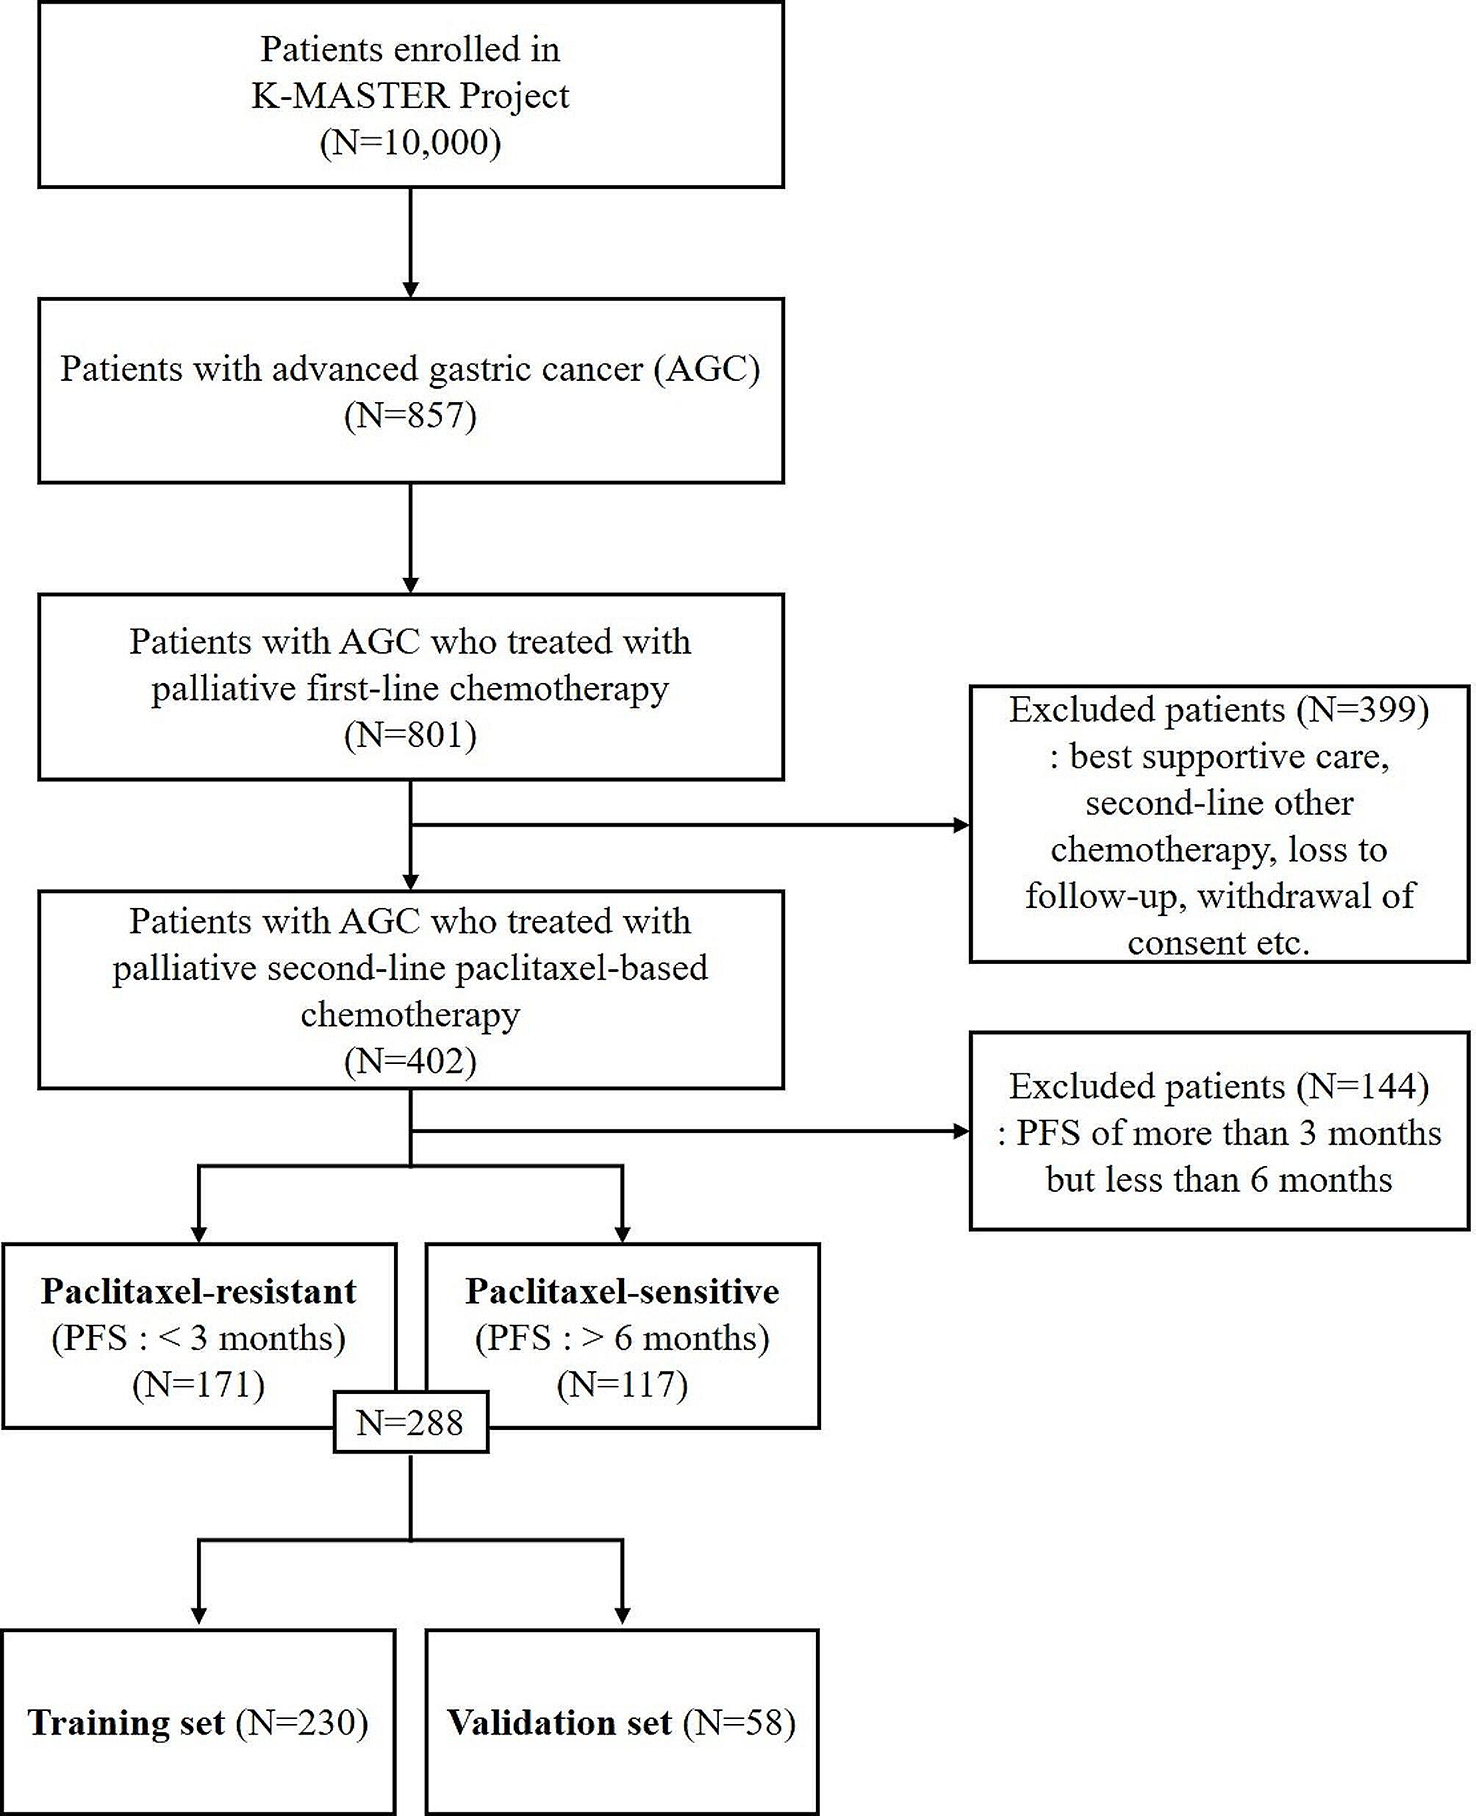

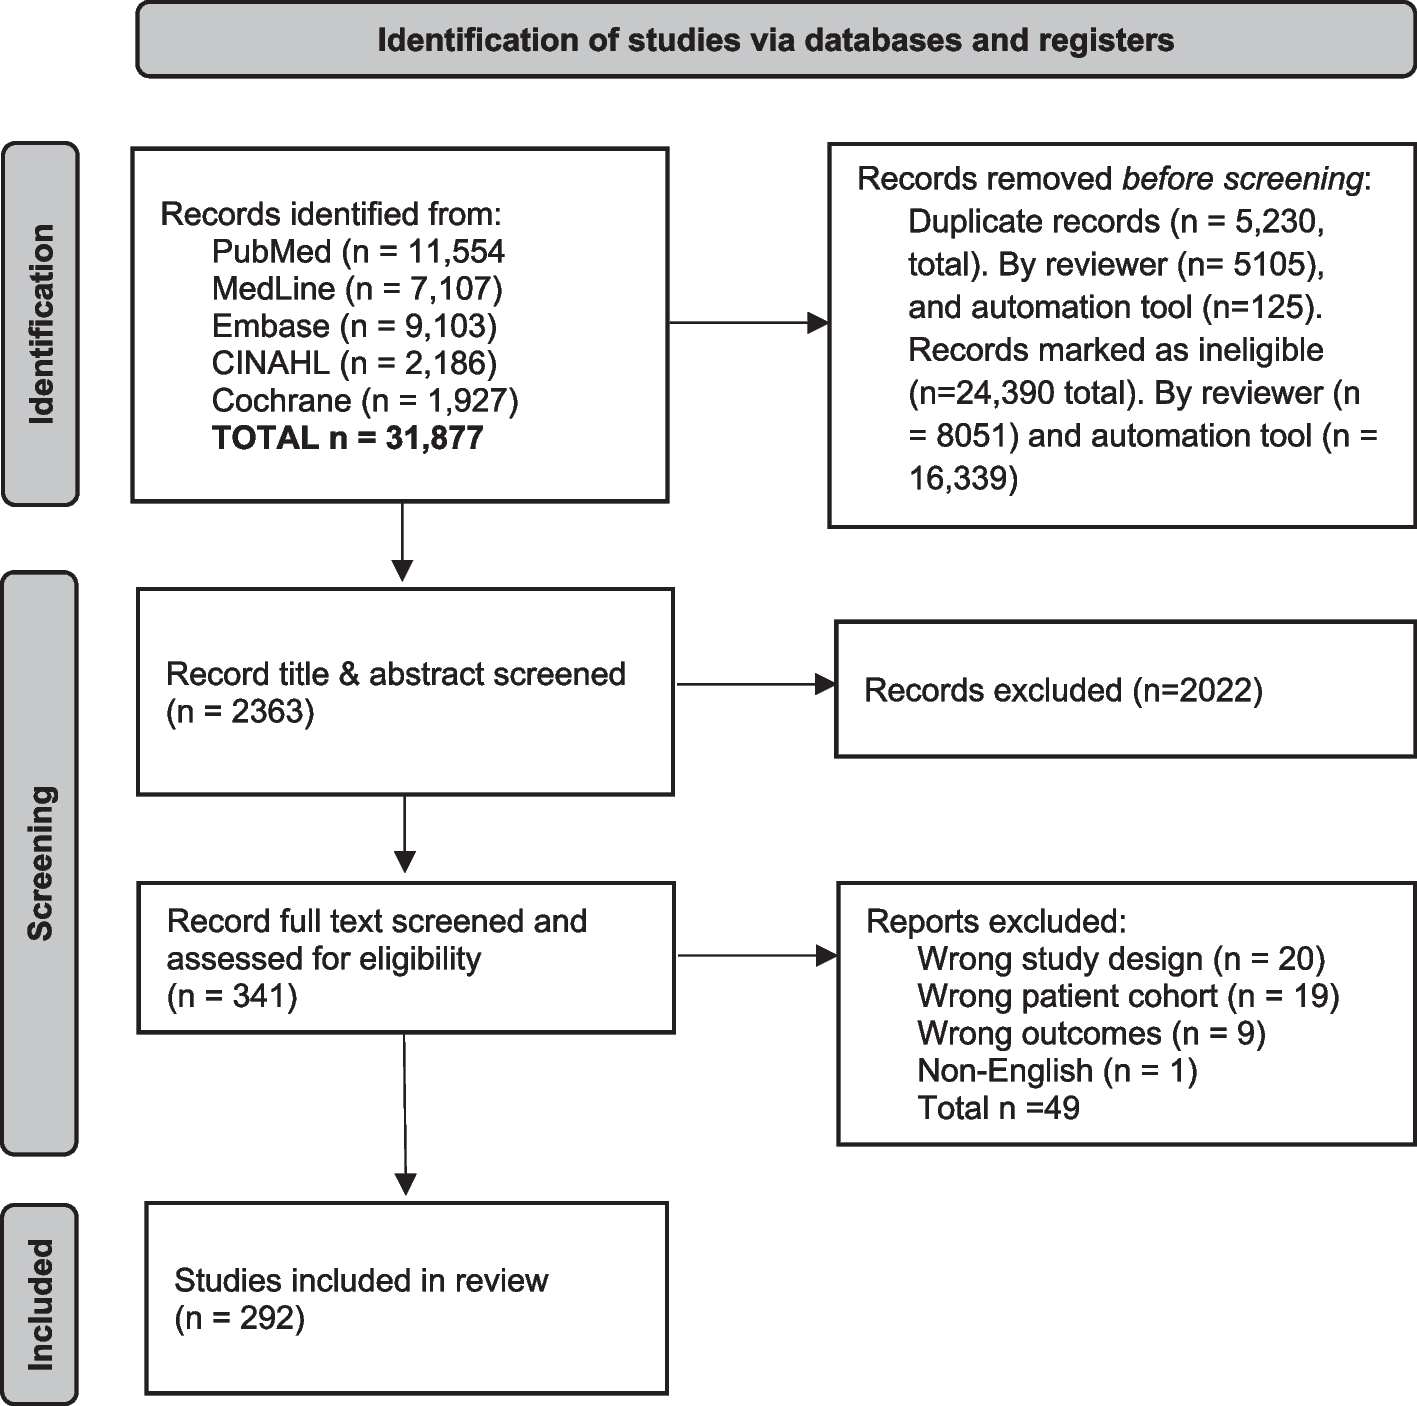
Figure 1 shows the patient inclusion flowchart. A total of 161 patients (mean age, 59.67 years ± 10.44; age range, 27–84 years), with peripheral pulmonary adenocarcinoma were included (Table 1). Sixty-two (38.50%) of the 161 patients were mean (mean age, 60. 73 years ± 10.00; age range, 33–84 years), and 99 (61.50%) were women (mean age, 59.01 years ± 10.71; age range, 27–84 years). Seventy-five patients (46.58%) of the 161 patients were diagnosed with VPI and eighty-six patients (53.42%) were diagnosed without VPI. The largest diameter of the 161 patients’ tumor was 2.32 cm ± 1.33, and the diameter ranged from 0.5-11 cm.
Fig. 1
Patient inclusion flowchart shows the number of patients, evaluation of the imaging studies and pathologic analysis
Table 1 Clinical characteristics of patients with peripheral pulmonary adenocarcinomaThree patients (1.86%) of the 161 patients were diagnosed with minimally invasive adenocarcinoma (MIA) in the pathology system, one hundred and fifty-three patients (95.03%) were diagnosed with invasive non-mucinous adenocarcinoma (INMA) and five patients (3.11%) were diagnosed with invasive mucinous adenocarcinoma (IMA). Twenty-nine patients (18.01%) of the 161 patients were diagnosed with lepidic predominant adenocarcinoma (LPA) in the histology system, seventy-eight patients (48.45%) were diagnosed with acinar predominant adenocarcinoma (APA), sixteen patients (9.94%) were diagnosed with papillary predominant adenocarcinoma (PPA), fourteen patients (8.70%) were diagnosed with micropapillary predominant adenocarcinoma (MPA) or solid predominant adenocarcinoma (SPA) and for twenty-four patients (14.90%) data were not available.
Seventy-six patients (47.21%) were diagnosed with pT1 in the pT stage system, eighty-one patients (50.31%) were diagnosed with pT2, and four patients (2.48%) were diagnosed with pT3 or pT4.
CT characteristicsFigure 2 shows the CT imaging features of the peripheral pulmonary adenocarcinoma consistently determined by a thoracic radiologist and a medical student with experience in pulmonary imaging diagnosis. The CT features were classified into four types: type 1, one or more linear pleural tag; type 2, one or more linear pleural tag with soft tissue component at the pleural end; type 3, one soft tissue cord-like pleural tag; type 4, directly abutting the visceral pleura, pulling or pushing the visceral pleura.
Fig. 2
Pleural tags on CT: Type 1 (A, F), Type 2 (B), Type 3 (C), Type 4 (D, E, G). The first image in each group had the pleural tag with VPI confirmed pathologically, and the second had not. There was only one image in group G (type 4 of pleural tags with VPI)
Twenty-four patients (14.91%; nine patients [37.50%] with pleural invasion proved by pathologic analysis) of the 161 patients had type 1 of PTs; thirty-two patients (19.88%; fifteen patients [46.88%] with pleural invasion) had type 2 of PTs; thirty-nine patients (24.22%; twenty-two patients [56.41%] with pleural invasion) had type 3 of PTs and sixty-six patients (40.99%; twenty-nine patients [43.94%] with pleural invasion) had type 4 of PTs (Table 2).
Table 2 CT Characteristics in Patients with Peripheral Pulmonary AdenocarcinomaPathologyThere were 161 patients with a definitive histopathologic diagnosis. Pathologic findings confirmed that 75 (46.58%) of the 161 patients were diagnosed with VPI, and 86 patients (53.42%) were diagnosed without VPI.
After surgery, we correlated the imaging findings with the pathologic findings. According to the characteristics of the CT images, under the × 20 magnification of hematoxylin–eosin staining, type 1 of PTs (the linear PTs) was formed by the contraction of reactive proliferative fibrous tissue in the tumor. This was done by pulling the pleura to make it parallel, concave, and close to each other or the fibrous hyperplasia, and the thickening of interlobular septa, along which carcinoma cells or inflammatory cells infiltrated. Type 2 of PTs included changes in linear PTs and terminal triangular pleural indentation. Type 3 of PTs were caused by the proliferative fibrous tissue in the tumor, which contracted and pulled pleura to form a V-shape shadow or caused compressive atelectasis to form a cord-like soft tissue shadow. Type 4 of PTs showed tumor tissue attached to normal or thickened visceral pleura (Fig. 3).
Fig. 3
Pleural tags and corresponding hematoxylin–eosin-stained or elastica van Gieson stained histologic findings. (Original magnification, × 20.) At the arrow: (a1), (c1), (d1) tumor cells infiltrated the pleura; (a2), (c2) tumor cells were localized under the subpleural; (b1) tumor cells were observed to penetrate the elastic fibrous boundary of the pleura and infiltrate into the pleura; (b2) tumor cells did not break through the elastic layer of the pleura. (d2) Although the tumor was attached to the pleura on CT, it was pathologically confirmed to be pleural thickening and no tumor cell infiltration
In patients pathologically diagnosed with VPI, tumor cells were observed to penetrate the elastic fibrous boundary of the pleura and infiltrate into the pleura under the 20 × microscopic scale of Elastica van Gieson staining. In patients diagnosed without VPI, the tumor cells did not break through the elastic layer of the pleura (Fig. 3).
PrognosisPatients in this study were followed up from 2 to 77 months after surgery. Among the 132 patients included, 50 were males and 82 were females, aged 27–84 years, with a median age of 60 years. There were 32 patients with tumor progression (19 with new malignant nodules or distant metastasis, 13 died of lung cancer). Continuous variables, including age and tumor diameter, were transformed into categorical variables.
The results of the univariate analysis affecting tumor progression are shown in Table 3. The univariate and multivariable survival analysis curves were shown in Fig. 4. Univariate analysis showed that tumor size, histological subtype and PTs (type) were significantly associated with prognosis. Cox-proportional hazards model was further used to analyze the prognostic factors. The variables with p value < 0.15, such as sex, tumor size, VPI, PTs and histological subtype, were included in the analysis to exclude the mutual influence of each factor on the prognosis in univariate analysis. The Cox regression survival curve showed that micropapillary or solid histological subtype (HR = 5.766, 95% CI: 1.435–23.159, P = 0.014) and type 3 of PTs (HR = 11.058, 95% CI: 1.349–90.623, P = 0.025) were two independent risk factors for tumor progression.
Table 3 The results of univariate analysis affecting tumor progression in 132 patientsFig. 4
Kaplan–Meier (K-M) survival curves of variables with P < 0.15 and COX curves of multivariable analysis results
留言 (0)