
記住我

Cardiopulmonary exercise testing (CPX) has been well used in subjects with heart failure (HF) for risk stratification and to screen for heart transplantation.1,2 The ramp protocol, which is characterized by a gradual increase in the work rate for CPX, is preferred to avoid abrupt or unequal increments in work, which are associated with the disruption of workload and oxygen consumption (VO2).3,4
The combination of CPX with exercise stress echocardiography (ESE) has been developed to investigate the pathophysiology of exercise intolerance in HF subjects by integrating the power from both diagnostic modalities.5–7 In the ramp-like protocol for CPX on a cycle ergometer, echocardiographic images are acquired only at particular points, such as the anerobic threshold (AT) or at specific respiratory exchange ratios (RERs).5,6 This method could standardize the individual workload and demonstrate the dose effect of workload on ESE parameters; however, technically, it could miss the hemodynamic measures at the true peak exercise level and the data collected at each stage under the same workload.
The alternative protocol is a stepwise protocol, which is against an increasing workload at a constant cadence and is used more commonly in ESE but not in CPX-ESE.8 Ideally, subjects under each protocol would reach their AT, and the exercise duration would range from 8 to 12 minutes without a major complication. We therefore conducted this study to investigate the feasibility and safety of the stepwise protocol in CPX-ESE.
2. METHODS 2.1. Study populationBetween April 2020 and September 2020, ambulatory patients with chronic HF and New York Heart Association (NYHA) functional class I to III were eligible for this study. The participants were all clinically stable and received medical therapy with steady doses for at least 4 weeks. Patients with unstable angina or myocardial infarction within a month, decompensated HF within 3 months, cardiovascular intervention, or surgery within 3 months, chronic pulmonary, infective, metabolic, or orthopedic disease, a history of exercise-induced asthma, or severe cognitive function impairment (a Montreal Cognitive Assessment score <10) were excluded.
A diagnosis of HF with reduced ejection fraction (HFrEF), HF with mid-range ejection fraction (HFmrEF), and HF with preserved ejection (HFpEF) was made according to the recognized clinical guidelines.9 The definition of HF with recovered ejection fraction (HFrecEF) included a documented decrease in left ventricular ejection fraction (LVEF) <40% at baseline, at least 10% absolute improvement in LVEF after treatment and a second measurement of LVEF above 40%.10 This study was approved by the institutional review board of Taipei Veterans General Hospital.
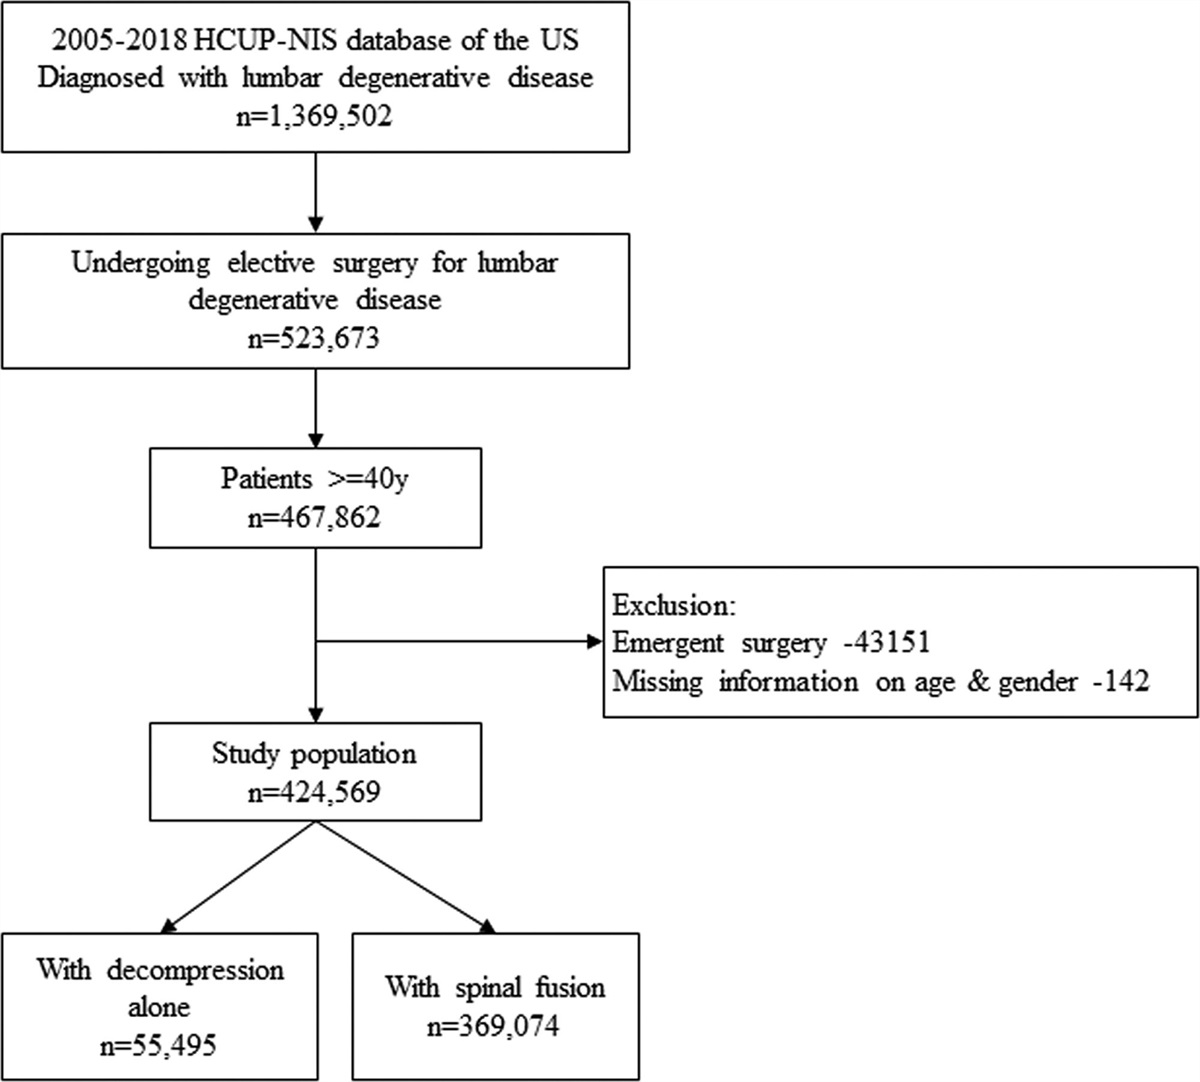
2.2. Cardiopulmonary exercise testingA symptom-limited stepwise bicycle exercise test was performed in a semi-supine position on a cycle ergometer with an adjustable slope, for optimal image acquisition (angio imaging with stress support ultrasound; MGC Ultima CPX, LODE, Germany). The initial workload was 30 W for 3 minutes, and this was increased by 15 W every 3 minutes until the test cessation criteria were reached. A 6-minute recovery period at 15 W workload was given post-maximum effort11 (Fig. 1). The test cessation criteria for the exercise test were as follows: (1) patient asks to stop, (2) heart rate or oxygen consumption no longer increases despite the increase in exercise intensity, (3) systolic blood pressure >250 mmHg and/or diastolic blood pressure >115 mmHg, (4) systolic blood pressure drops > 10 mmHg with an increased work rate, and (5) the presence of uncomfortable symptoms.12
 Fig. 1:
 Stepwise exercise echocardiography protocol and exercise variables that can be assessed at each stage, with breath-by-breath minute ventilation, carbon dioxide production (VCO2), oxygen consumption (VO2), and electrocardiography monitor.
Breath-by-breath minute ventilation, carbon dioxide production (VCO2), and VO2 were measured using commercial cardiopulmonary diagnostic software (ULTIMA CARDIO2 GAS EXCHANGE ANALYSIS SYSTEM, MGC Ultima CPX, Germany). The peak VO2 was defined as the average VO2 over 20 seconds during the last stage of exercise.13 The predicted value of peak VO2 was calculated according to age and gender.14 The V-slope method was used to determine AT.4 The oxygen uptake efficiency slope (OUES) was calculated as the logarithmic relationship between minute ventilation (VE) and VO215: the VE/VCO2 slope. The ventilation efficiency was collected during the whole exercise period and calculated using least square linear regression.16 A 12-lead electrocardiogram and arterial oxygen saturation were continuously monitored for the whole exam. Brachial blood pressure was measured by oscillometry every minute at rest and during the exercise.
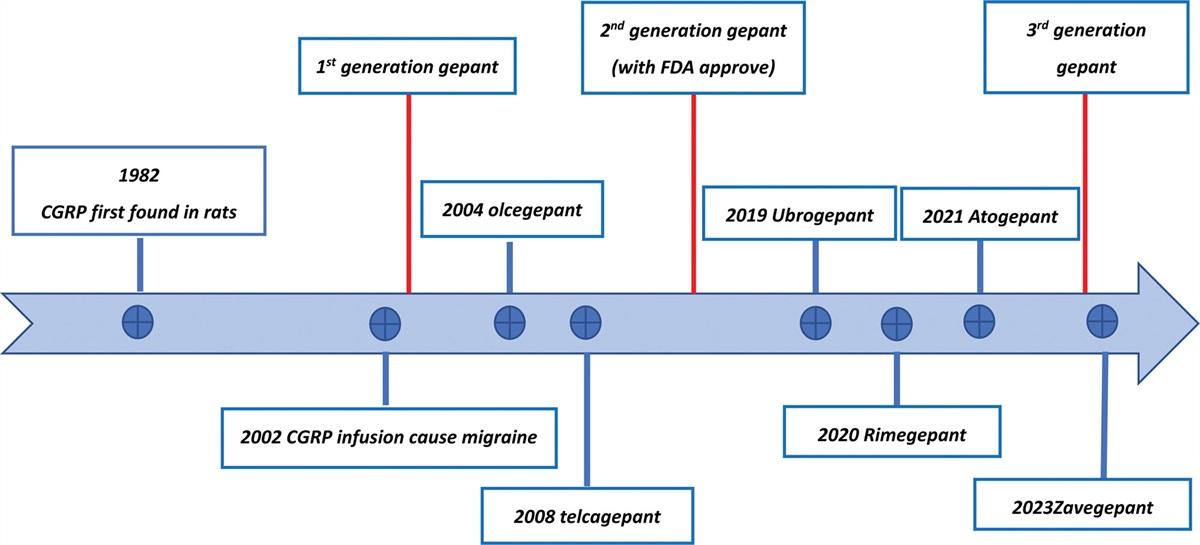
2.3. The ESE protocolA comprehensive echocardiographic examination was performed at each stage of the workload (rest, 30 W, followed by 15 W incremental exercise, post-peak exercise, and recovery) using a Vivid E95 GE machine, which was a digital ultrasound imaging system providing thorough image generation (Fig. 1). A speckle tracking analysis (GE Healthcare EchoPAC 203) was performed to measure the LV global longitudinal strain (GLS) from the apical four-, three-, and two-chamber views with a frame rate above 50 Hz (Fig. 2A, B), and the average value was reported. Trans-mitral early (E) and late (A) diastolic flow velocity (Fig. 2C, D), medial mitral annulus tissue velocity at early diastole (Fig. 2E, F), right ventricular myocardial systolic velocity, and tricuspid regurgitation velocity were also measured.17 The arterial-venous oxygen content difference was calculated using the Fick equation as VO2/CO at each stage.5
 Fig. 2:
 Exercise echocardiographic variables in a 40-year-old man with heart failure with reduced injection fraction. Left, left ventricular (LV) global longitudinal strain (A), mitral flow pattern (C), medial mitral annulus tissue velocity at early diastole (E), and three-dimensional (3D) LV volume (G) at baseline. Right, LV global longitudinal strain (B), mitral flow pattern (D), medial mitral annulus tissue velocity at early diastole (F), and 3D LV volume (H) during 60 W exercise.
Left ventricular end-diastolic volume (LVEDV), left ventricular end-systolic volume, LVEF, left atrial volume, and stroke volume were acquired by two- dimensional (2D) and three-dimensional (3D) echocardiography according to the guidelines for each activity level8,18 (Fig. 2G, H). Mitral regurgitation was assessed at rest and peak exercise using the vena contracta and proximal isovelocity surface area method.
2.4. Adverse event definitionsWe defined major rhythmic events as a life-threatening arrhythmia, including cardiac asystole, high degree atrioventricular block or sustained ventricular tachycardia, or ventricular fibrillation or supraventricular tachycardia that required emergent treatment. Minor rhythmic events were defined as a new onset of supraventricular tachycardia, ventricular premature beats, ventricular bigeminy or couplets, and nonsustained ventricular tachycardia.19 Symptomatic hypotension was defined as a drop of >40 mmHg in brachial arterial blood pressure with symptoms. Minor side effects included the development of nausea, headache, dizziness, and muscle pain.
2.5. Statistical analysisContinuous variables of descriptive results were presented as the mean ± SD. Categorical variables were expressed as absolute numbers and relative frequencies. All patients were centrally reanalyzed by two independent observers. We measured the reproducibility using the intraclass correlation coefficient. All statistical analyses were performed using SPSS v.20.0 software (SPSS, Inc., Chicago, IL, USA), and the performed tests were two-sided. A p value <0.05 was considered to indicate a statistically significant difference.
3. RESULTSA total of 36 patients (age 61.2 ± 12.4 years; 69.4% men) were enrolled in this study. Among them, 15 (41.6%) had HFrEF, four (11.1%) had HFmrEF, four (11.1%) had HFpEF, and 13 (36.1%) had HFrecEF. Table 1 details the demographic and clinical characteristics, the echocardiographic parameters, and the respiratory variables of the study population. In short, the participants had a dilated LVEDV index of 59.0 mL/m2, an enlarged LA volume index of 29.5 mL/m2, and a relatively normal E/e′, tricuspid annular plane systolic excursion, and pulmonary arterial systolic pressure, indicating a stable and well-compensated HF status.
Table 1 - Baseline characteristics of the study population Demographic and clinical characteristics Overall population, n = 36 Age (y), mean ± SD 61.2 ± 12.4 Male gender, n (%) 25 (69.4) Body mass index, mean ± SD 24.3 ± 4.3 HF phenotypes HFrEF 15 (41.6) HFmrEF 4 (11.1) HFpEF 4 (11.1) HFrecEF 13 (36.1) Comorbidity, n (%) Previous MI 7 (19.4) Diabetes mellitus 12 (33.3) Hypertension 10 (27.8) Atrial fibrillation 7 (19.4) Echocardiography, at rest, mean ± SD LVEF (%) 45.3 ± 10.8 LV-GLS (%) −11.5 ± 4.2 Medial E/e′ 13.8 ± 8.0 Mitral E/A ratio 1.01 ± 0.60 3D-EDV (ml) 117.5 ± 47.3 3D-ESV (ml) 68.4 ± 41.2 RV S′ (cm/s) 11.4 ± 2.4 Tricuspid regurgitation velocity (m/s) 175.9 ± 74.8 LVOT-VTI (cm) 16.3 ± 3.8 Echocardiography, at peak stage, mean ± SD LVEF (%) 48.2 ± 11.3 LV-GLS (%) −12.1 ± 4.3 Medial E/e′ 14.4 ± 5.8 Mitral E/A ratio 1.12 ± 0.36 3D-EDV (ml) 118.0 ± 45.3 3D-ESV (ml) 63.6 ± 40.1 RV S′ (cm/s) 15.0 ± 4.2 Tricuspid regurgitation velocity (m/s) 230.4 ± 92.6 LVOT-VTI (cm) 18.5 ± 4.5 Hemogram and biochemistry, mean ± SD Hemoglobin (g/dL) 13.1 ± 1.5 eGFR (mL/min/1.73 m2) 59.2 ± 27.0 Sodium (mEq/L) 140.7 ± 2.2 Potassium (mEq/L) 4.37 ± 0.49 NT-proBNP (pg/mL)* 544.5 ± 5.6 Cardiopulmonary exercise test, mean ± SD Time of effort (min) 10.9 ± 5.1 HR at rest (bpm) 68.9 ± 23.5 HR at peak (bpm) 118.7 ± 28.7 % Age predicted HR 72.3 ± 23.4 Chronotropic index 1.60 ± 0.74 RER at rest 0.97 ± 0.11 RER at peak 1.25 ± 0.16 VO2 at (% of peak VO2) 71.6 ± 19.2 VO2 at peak (mL/min/kg) 14.7 ± 4.2 VO2 predicted at peak (%) 44.8 ± 15.2 Peak O2 pulse (mL/beat) 8.88 ± 2.83 VE/VCO2 slope 34.3 ± 5.3 OUES 1249.6 ± 411.8 PETCO2 at rest (mmHg) 34.8 ± 4.7 PETCO2 at peak (mmHg) 35.6 ± 5.3 Breathing reserve 57.6 ± 10.5AT = aerobic threshold; E/A ratio = ratio of the early (E) to late (A) ventricular filling velocities; E/E′ = ratio of early ventricular filling velocity (E) to early diastolic tissue velocity mitral annulus; EDV = end-diastolic volume; ESV = end-systolic volume; eGFR = estimated glomerular filtration; GLS = global longitudinal strain; HFmrEF = heart failure with mid-range ejection fraction; HFpEF = heart failure with preserved ejection fraction; HFrEF = heart failure with reduced ejection fraction; HFrecEF = heart failure with recovered ejection fraction; HR = heart rate; LV = left ventricular; LVEF = left ventricular ejection fraction; LV mass = left ventricular mass; LVOT-VTI = left ventricular outflow tract velocity time integral; MI = myocardial infarction; NT-proBNP = N-terminal pro-brain natriuretic peptide; OUES = oxygen uptake efficiency slope; PETCO2 = end-tidal carbon dioxide; RER = respiratory exchange ratio; RV S′ = right ventricular myocardial systolic velocity; VE/VCO2 slope = the relationship between minute ventilation and carbon dioxide production; VO2 = oxygen consumption.
The mean duration of CPX was 10 minutes 54 seconds, and all subjects achieved AT during CPX-ESE, reaching a mean of 72.3% of the age predicted heart rate. The maximal systolic and diastolic blood pressures were 173.4 ± 28.9 and 83.6 ± 13.2 mmHg, respectively at peak exercise. The peak VO2 was 14.7 mL/kg/min, and the peak RER was 1.25. The major causes of exercise termination were dyspnea (30.5%) and muscle fatigue (44.4%).
The results of CPX-ESE–related complications are shown in Table 2, and there was no occurrence of death, myocardial infarction, or major rhythmic events. Minor rhythmic complications were observed in two patients (5.5%). Supra-ventricular tachycardia (atrial flutter) was observed in one patient (50-year-old women, HFrEF) during the recovery phase, while sinus rhythm resumed spontaneously. The other event was ventricular premature beats noted at the 60 W stage in a 64-year-old patient with HFrEF. In addition, two patients complained of muscle pain, and one had nausea.
Table 2 - Complications during and after stress tests in the study population. Results Overall population, n = 36 Major rhythmic events, n (%) 0 (0) Minor rhythmic events, n (%) 2 (5.5) Severe hypotension, n (%) 0 (0) Minor side effects, n (%) 3 (11.5)Major rhythmic events: cardiac asystole, high degree atrioventricular block, or sustained ventricular tachycardia or ventricular fibrillation or supraventricular tachycardia required emergent treatment. Minor rhythmic events: new onset of supraventricular tachycardia, ventricular premature beats, ventricular bigeminy or couplets and non-sustained ventricular tachycardia. Severe hypotension: a brachial arterial blood pressure >40 mmHg with symptoms. Minor side effects: nausea, headache, dizziness, and muscular pain.
The image quality and intraobserver variability are presented in Table 3. All in all, the 2D images were qualified for GLS analysis in 94.4% of all image sets. The measurements of mitral inflow, tissue Doppler velocity, tricuspid annulus tissue velocity at systole, and left ventricular outflow tract velocity time integral could be obtained in 96.4%, 95.6%, 95.8%, and 97.4% of the image sets, respectively. Tricuspid regurgitation flow velocity was only available in 74.2% of the image sets.
Table 3 - Image acquisition of the stress tests in all exercise stages Analyzed echocardiographic parameters Available images, % ICCs for intraobserver repeatability, % ICCs for interobserver repeatability, % LV GLS analysis 94.4 88.6 87.8 3D LV volume 91.9 84.3 82.1 Doppler mitral inflow pattern 96.4 92.1 92.5 Early diastolic medial mitral annulus velocity 95.9 94.5 93.7 Right ventricular myocardial systolic velocity 97.9 94.5 96.7 LVOT VTI 97.4 84.4 86.8 Tricuspid regurgitation velocity 74.2 82.1 81.8GLS = global longitudinal strain; LV = left ventricular; LVOT VTI = left ventricular outflow tract velocity time integral.
In general, the image quality could be jeopardized due to body motion and tachycardia. In addition, good intraobserver (all >0.8) and interobserver variations (all >0.8) were identified for all parameters (Table 3).
4. DISCUSSIONThe present study has demonstrated the feasibility and safety of the stepwise protocol, with an initial workload of 30 W followed by 15 W, increasing every 3 minutes, for supine ergometer exercise stress in subjects with HF. This protocol was well tolerated by participants without developing any severe adverse events, such as death, myocardial infarction, ventricular fibrillation, hypotension, or high conduction disturbances. There were only two minor rhythmic events. The mean exercise duration was 10.9 minutes, reaching the patient’s peak VO2 within 8–12 min. Good-quality images were successfully obtained in 92.6% of all acquisitions within the short time slots. The intraobserver and interobserver repeatability of the echocardiographic parameters were good.
There are several protocols for ergometer ESE with different initial workloads and increments.6,20–22The optimal protocol depends on the estimated exercise capacity of the target population and the purpose of the investigation. Pugliese et al5 have previously performed the symptom-limited ramp bicycle exercise test in 169 HF subjects. The exercise duration, peak VO2, and RER ranged from 11.1 to 11.3 minutes, 15.1 to 16.6 mL/min/kg, and 1.06 to 1.09, respectively in different HF phenotypes. Shimiaie et al23 conducted a similar protocol in 31 HF subjects, and half of them had reduced LVEF. The reported exercise duration, peak VO2, and RER in the study by Shimiaie et al,23 were close to the above study. The exercise duration, peak VO2, and RER using stepwise protocol in our study were 10.9 minutes, 14.7 mL/min/kg, and 1.25, respectively. These findings could indicate that the stepwise protocol provides a similar stress load for participants to the ramp protocols, which have been preferred in CPX studies. Ha et al22 applied an initial 25 W with 25 W increments for the stepwise protocol, by which time patients would experience early fatigue, whereas Borlaug et al24 used an initial 20 W with 10 W increments to determine the elevation of left ventricular end diastolic pressure (LVEDP) but prolong exercise duration. The present protocol used an initial workload of 30 W and increments of 15 W every 3 minutes to reveal a raise in LVEDP within a certain exercise duration. Nevertheless, the stepwise protocol could be incorporated with stress echocardiographic studies in each work stage in addition to the resting, post-peak exercise, and recovery phases.
With the increased workload, image acquisition became more difficult due to body movement and tachypnea. The study has shown that 95.7% of the images acquired at rest and 91.0 % of the images acquired at peak exercise were qualified for analysis. However, the tricuspid regurgitant flow velocity was clearly affected by rapid ventilation, and only 74.2% of measurements were adequate for analysis. Compared with the ramp protocol, the dose effect of workload on cardiac functions using the stepwise protocol could be demonstrated intuitively. The relationship between echocardiographic indices and workload could be further standardized by exercise parameters, for example, % of peak VO2 or AT.2,24
The stepwise stress modality is safe, and the occurrence of life-threatening complications is rare. The International Stress Echo Complication Registry reported a life-threatening event rate below 1/5000 in patients undergoing an exercise stress Echo.25 Similar results were reported by Banerjee et al26 in a meta-analysis where overall complications were determined to be ≤0.2%. In this study, we also reported no severe complications; however, there was one case of ventricular premature beats and one case of atrial flutter in patients with HFrEF. Similarly, Fennich et al19 demonstrated that 19.2% of patients would experience minor rhythmic events during exercise. In general, the stepwise stress modality was safe, and the most common adverse events were minor rhythmic events or muscle pain, which were usually innocent and well tolerated.
There were some limitations to this study. According to the inclusion criteria, subjects should be ambulatory and have the physical ability to participate in exhaustive exercise testing. Subjects with advanced HF and NYHA Fc IV symptoms were not recruited into this study due to safety concerns. Given the nature of an observational study, there could still be selection bias. The lower proportion of HFpEF patients in this study may hamper the generalization of the study results to those with functional disability and multiple comorbidities, which are common in HFpEF patients. The sample size was relatively small and not extensive enough to provide conclusive results regarding rare but major rhythmic events, such as cardiac asystole or ventricular fibrillation. In addition, we did not compare the study protocol with the ramp protocol in the study population. While the ramp protocol is preferred to avoid abrupt or unequal increments in work and is widely used in CPX, the assessments of echocardiography are technically difficult. Last, the study has a lack of long-term incident morbidities or mortalities to provide prognostic value for CPX and/or ESE variables. Although our study provided an opportunity to examine the feasibility of the stepwise protocol for CPX-ESE, a more comprehensive research project should be conducted in the future.
In conclusion, a combined approach with CPX-ESE has recently been introduced for diagnostic and prognostic evaluations of cardiovascular diseases, which formerly could only be assessed by invasive studies. For supine ergometer exercise stress in patients with HF, the stepwise protocol, with an initial workload of 30 W, followed by 15 W increments every 3 minutes, was feasible and provides an adequate stress load. Although image recording was under time constraints, good-quality images were obtained in >90% of all acquisitions with proper repeatability. The stepwise exercise stress modality was safe, and the most common adverse events included minor rhythmic disturbances and muscle pain, which were usually trivial and well tolerated.
ACKNOWLEDGMENTSThis work received grants from the Ministry of Health and Welfare, Taiwan (MOHW107-TDU-B-211-123001, S.-H. Sung); Taipei Veterans General Hospital (V109E-008-01, S.-H. Sung), and (V110B-032, W.-M. Huang).
REFERENCES 1. Guazzi M, Bandera F, Ozemek C, Systrom D, Arena R. Cardiopulmonary exercise testing: what is its value? J Am Coll Cardiol. 2017;70:1618–36. 2. Malhotra R, Bakken K, D’Elia E, Lewis GD. Cardiopulmonary exercise testing in heart failure. JACC Heart Fail. 2016;4:607–16. 3. Myers J, Bellin D. Ramp exercise protocols for clinical and cardiopulmonary exercise testing. Sports Med. 2000;30:23–9. 4. Mezzani A. Cardiopulmonary exercise testing: basics of methodology and measurements. Ann Am Thorac Soc. 2017;14(1):S3–S11. 5. Pugliese NR, Fabiani I, Santini C, Rovai I, Pedrinelli R, Natali A, et al. Value of combined cardiopulmonary and echocardiography stress test to characterize the haemodynamic and metabolic responses of patients with heart failure and mid-range ejection fraction. Eur Heart J Cardiovasc Imaging. 2019;20:828–36. 6. Dhakal BP, Malhotra R, Murphy RM, Pappagianopoulos PP, Baggish AL, Weiner RB, et al. Mechanisms of exercise intolerance in heart failure with preserved ejection fraction: the role of abnormal peripheral oxygen extraction. Circ Heart Fail. 2015;8:286–94. 7. Santoro C, Sorrentino R, Esposito R, Lembo M, Capone V, Rozza F, et al. Cardiopulmonary exercise testing and echocardiographic exam: an useful interaction. Cardiovasc Ultrasound. 2019;17:29. 8. Lancellotti P, Pellikka PA, Budts W, Chaudhry FA, Donal E, Dulgheru R, et al. The clinical use of stress echocardiography in non-ischaemic heart disease: recommendations from the European Association of Cardiovascular Imaging and the American Society of Echocardiography. J Am Soc Echocardiogr. 2017;30:101–38. 9. Ponikowski P, Voors AA, Anker SD, Bueno H, Cleland JGF, Coats AJS, et al.; ESC Scientific Document Group. 2016 ESC Guidelines for the diagnosis and treatment of acute and chronic heart failure: the task force for the diagnosis and treatment of acute and chronic heart failure of the European Society of Cardiology (ESC) developed with the special contribution of the Heart Failure Association (HFA) of the ESC. Eur Heart J. 2016;37:2129–200. 10. Wilcox JE, Fang JC, Margulies KB, Mann DL. Heart failure with recovered left ventricular ejection fraction: JACC scientific expert panel. J Am Coll Cardiol. 2020;76:719–34. 11. Albouaini K, Egred M, Alahmar A, Wright DJ. Cardiopulmonary exercise testing and its application. Heart. 2007;93:1285–92. 12. Thompson PD, Arena R, Riebe D, Pescatello LS; American College of Sports Medicine. ACSM’s new preparticipation health screening recommendations from ACSM’s guidelines for exercise testing and prescription, ninth edition. Curr Sports Med Rep. 2013;12:215–7. 13. Guazzi M, Adams V, Conraads V, Halle M, Mezzani A, Vanhees L, et al.; European Association for Cardiovascular Prevention & Rehabilitation; American Heart Association. EACPR/AHA scientific statement. Clinical recommendations for cardiopulmonary exercise testing data assessment in specific patient populations. Circulation. 2012;126:2261–74. 14. Jang WY, Kim W, Kang DO, Park Y, Lee J, Choi JY, et al. Reference values for cardiorespiratory fitness in healthy koreans. J Clin Med. 2019;8:E2191. 15. Baba R, Nagashima M, Goto M, Nagano Y, Yokota M, Tauchi N, et al. Oxygen uptake efficiency slope: a new index of cardiorespiratory functional reserve derived from the relation between oxygen uptake and minute ventilation during incremental exercise. J Am Coll Cardiol. 1996;28:1567–72. 16. Myers J, Arena R, Oliveira RB, Bensimhon D, Hsu L, Chase P, et al. The lowest VE/VCO2 ratio during exercise as a predictor of outcomes in patients with heart failure. J Card Fail. 2009;15:756–62. 17. Nagueh SF, Smiseth OA, Appleton CP, Byrd BF 3rd, Dokainish H, Edvardsen T, et al. Recommendations for the evaluation of left ventricular diastolic function by echocardiography: an update from the American Society of Echocardiography and the European Association of Cardiovascular Imaging. J Am Soc Echocardiogr. 2016;29:277–314. 18. Lang RM, Bierig M, Devereux RB, Flachskampf FA, Foster E, Pellikka PA, et al.; Chamber Quantification Writing Group; American Society of Echocardiography’s Guidelines and Standards Committee; European Association of Echocardiography. Recommendations for chamber quantification: a report from the American Society of Echocardiography’s guidelines and standards committee and the chamber quantification writing group, developed in conjunction with the European Association of Echocardiography, a branch of the European Society of Cardiology. J Am Soc Echocardiogr. 2005;18:1440–63. 19. Fennich N, Ellouali F, Abdelali S, Chaara A, Berrada A, Elhajjaji I, et al. Stress echocardiography: safety and tolerability. Cardiovasc Ultrasound. 2013;11:30. 20. Suzuki K, Hirano Y, Yamada H, Murata M, Daimon M, Takeuchi M, et al. Practical guidance for the implementation of stress echocardiography. J Echocardiogr. 2018;16:105–29. 21. Ha JW, Oh JK, Pellikka PA, Ommen SR, Stussy VL, Bailey KR, et al. Diastolic stress echocardiography: a novel noninvasive diagnostic test for diastolic dysfunction using supine bicycle exercise Doppler echocardiography. J Am Soc Echocardiogr. 2005;18:63–8. 22. Lancellotti P, Pellikka PA, Budts W, Chaudhry FA, Donal E, Dulgheru R, et al. The clinical use of stress echocardiography in non-ischaemic heart disease: recommendations from the European Association of Cardiovascular Imaging and the American Society of Echocardiography. Eur Heart J Cardiovasc Imaging. 2016;17:1191–229. 23. Shimiaie J, Sherez J, Aviram G, Megidish R, Viskin S, Halkin A, et al. Determinants of effort intolerance in patients with heart failure: combined echocardiography and cardiopulmonary stress protocol. JACC Heart Fail. 2015;3:803–14. 24. Adachi H. Cardiopulmonary exercise test. Int Heart J. 2017;58:654–65. 25. Varga A, Garcia MA, Picano E; International Stress Echo Complication Registry. Safety of stress echocardiography (from the international stress echo complication registry). Am J Cardiol. 2006;98:541–3. 26. Banerjee A, Newman DR, Van den Bruel A, Heneghan C. Diagnostic accuracy of exercise stress testing for coronary artery disease: a systematic review and meta-analysis of prospective studies. Int J Clin Pract. 2012;66:477–92.
留言 (0)