
記住我


Diabetic dyslipidemia is characterized by elevated levels of triglycerides (TGs) and small dense low-density lipoprotein cholesterol (LDL-C) and low levels of high-density lipoprotein cholesterol (HDL-C).1 The atherogenic lipid profile contributes to the excess risk of cardiovascular disease (CVD) in people with type 2 diabetes mellitus (DM).2 Current consensus for the management of diabetic dyslipidemia recommends that the primary lipid goal of treatment is LDL-C <2.6 mmol/L, and a non–HDL-C goal of <3.4 mmol/L is a secondary target for primary CVD prevention.3,4 Extensive evidence supports these recommendations and suggests to preferably use a statin (3-hydroxy-3-methylgluatryl coenzyme A reductase inhibitor), along with lifestyle intervention, to control diabetic dyslipidemia.4,5 For example, in the Collaborative Atorvastatin Diabetes Study (CARDS), lowering LDL-C by 40% to a mean level of 2.1 mmol/L and lowering non–HDL-C by 36% to a mean level of 2.9 mmol/L with atorvastatin monotherapy led to a 37% reduction in the relative CVD risk compared with the placebo.6 However, statins differ in multiple characteristics, including bioavailability, potency, liver and renal metabolism, and effects on serum lipid components.7 Head-to-head comparisons between different statins are essential for effectively managing lipid disorders, especially in specific populations with a distinct lipid profile, such as patients with DM.7
Simvastatin, a long-established statin, is now available in generic forms. The results from the Heart Protection Study clearly demonstrated the beneficial effects of simvastatin on cardiovascular outcomes in patients with DM after 5 years of daily treatment with 40 mg simvastatin.8 Rosuvastatin, a synthetic statin, has high potency for lowering LDL-C levels on a milligram-equivalent basis.9 Several studies have compared the effects of rosuvastatin with those of other statins on lipid goal attainment in patients with DM.10–13 Moreover, in a recent primary prevention study, 20 mg of rosuvastatin significantly reduced the incidence of major cardiovascular events in individuals with elevated C-reactive protein levels.14 However, the potency of rosuvastatin and simvastatin for lowering atherogenic lipid levels has not been comprehensively investigated. The present study compared the effects of simvastatin and rosuvastatin on the attainment of the combined goal of LDL-C <2.6 mmol/L and non–HDL-C <3.4 mmol/L in patients with type 2 DM and dyslipidemia. The primary end-point was the percentage of patients who achieved the combined treatment goal of LDL-C and non–HDL-C at week 12 with rosuvastatin treatment (10 mg daily titrated to 20 mg) in comparison with simvastatin treatment (20 mg daily titrated to 40 mg).
2. METHODS 2.1. SubjectsOnly patients with type 2 DM having fasting TG levels between 1.7 and 5.7 mmol/L or non–HDL-C levels between 3.4 and 5.2 mmol/L were included in this study. Other inclusion criteria were an age of 20 to 75 years and receipt of stable oral antidiabetic treatment for 8 weeks before the study. Insulin-treated patients, patients with hypothyroidism or thyroid-stimulating hormone >5 mU/L, patients with estimated creatinine (Cr) clearance ≤30 mL/min or with overt proteinuria (repeated spot urine protein >300 mg/dL by the dipstick method), and patients with any conditions related to acute or chronic pancreatitis were excluded. Patients with a history of rhabdomyolysis, myocardial infarction, stroke, chronic active hepatitis, alcohol and drug abuse, homozygous familial hypercholesterolemia, and hypersensitivity to statins were also excluded. Women who were pregnant, nursing, or intending to conceive during the study period were not included in the study. At screening, participants with serum alanine aminotransferase (ALT) or aspartate aminotransferase (AST) values of <3-fold of the upper limit of normal (ULN), total bilirubin <1.5-fold ULN, and creatine kinase (CK) <3-fold ULN were considered eligible for the study. Concomitant medications including statins, fibrates, fish oils, ezetimibe, cyclosporine, and warfarin were all prohibited. The study protocol was approved by the Taiwan Joint Institutional Review Board. Each participant provided written informed consent before participating in the study.
2.2. Study designThe study had a two-center, randomized, parallel, open-label design. The eligibility of all potential patients was determined in a screening visit. Patients who met the inclusion/exclusion criteria were entered into a 5-week lead-in period for a therapeutic lifestyle plan targeting dyslipidemia. Participants who were taking hypolipidemic agents had to stop the treatment before entering into the lead-in period. Chen et al15 reported that short-term discontinuation of statin treatment causes rebound of the atherogenic lipid profile within 1 week. The patients were put on a balance energy intake for weight and glucose control. The participants were also instructed to use food exchanges to meet the National Cholesterol Education Program Step 1 Diet recommendations, with a reduced daily intake of saturated fat and cholesterol.16 Each patient received an individualized exercise prescription, including walking for 30 minutes at least three times a week. At the end of the lead-in period (week −1), the patients were scheduled for randomization eligibility check. Patients exhibiting 1.7 ≤ fasting TG ≤ 5.7 mmol/L or 3.4 ≤ non–HDL-C ≤ 5.2 mmol/L after the implementation of the lifestyle plan were randomly assigned to two groups to receive statin drug treatments. Group S received simvastatin 20 mg daily (Merck & Co., Whitehouse Station, NJ, USA) for 4 weeks, followed by 40 mg daily for another 8 weeks. Group R received rosuvastatin 10 mg daily (AstraZeneca, Cheshire, United Kingdom) for 4 weeks, followed by 20 mg daily for 8 weeks. Efficacy parameters of the study included the lipid profile and percentage of patients achieving the combined lipid goal. A safety profile, which included an assessment of adverse events and changes in blood chemistry, was also determined. During the 12-week treatment period, the patients were followed up at 4-week intervals. After 10 to 12 hours of overnight fast, blood pressure and weight of the participants were measured in the morning, and fasting blood samples were collected. Blood chemistry studies were conducted every 4 weeks; the fasting glucose levels and lipid profile were measured at week 0, 4, and 12; and urinalysis, hematological tests, and the glycated hemoglobin (HbA1c) test were performed at week 0 and 12 of the treatment period. All laboratory tests were conducted in a central lab (The Union Clinical Laboratory, Taipei, Taiwan). Preexisting medical conditions and adverse events were recorded every 4 weeks in the study.
2.3. AssaysPlasma glucose levels, blood biochemical levels, and lipid profile were measured through enzymatic methods by using commercial assay kits and an automatic biochemistry analyzer (ADVIA 1800, Chemistry System, Siemens Healthcare Diagnostic, Deerfiled, IL, USA). Apolipoprotein B (Apo-B) and AI (Apo-AI) levels were measured using immunochemical methods (IMMAGE Immunochemistry System, Beckman Coulter, Brea, CA, USA). Hematological tests were performed using a hematology analyzer (Sysmex XE-2100, Sysmex Corporation, Kobe, Japan). HbA1c levels were measured using an automated analyzer (Tosoh HLC-723, Tosoh Bioscience, King of Prussia, PA, USA).
2.4. Statistical analysisAll data are expressed as mean (SD) or n (%). Two-sample t tests or χ2 tests were used to compare clinical characteristics between the two groups at randomization. An intent-to-treat approach was used for the primary analysis. The primary time point for the efficacy analysis was week 12. A last-observation-carried-forward approach was used for analyzing efficacy data. Repeated-measures analysis of variance was used to assess differences in the lipid profile between the two groups with or without adjustments of covariates, including age, sex, body mass index, study site, DM duration, baseline HbA1c levels, and lipid levels. The between-group differences in the achievement rates of lipid goals were assessed using χ2 tests with continuity correction. Safety was evaluated in all patients who received the study medication. The proportion of patients reporting adverse events was summarized as frequency counts and percentages. χ2 tests were used to compare the differences in adverse events between the two groups. The analyses were performed using the SPSS program (Version 15.0, SPSS Inc., Chicago, IL, USA). The significance level was set at p < 0.05.
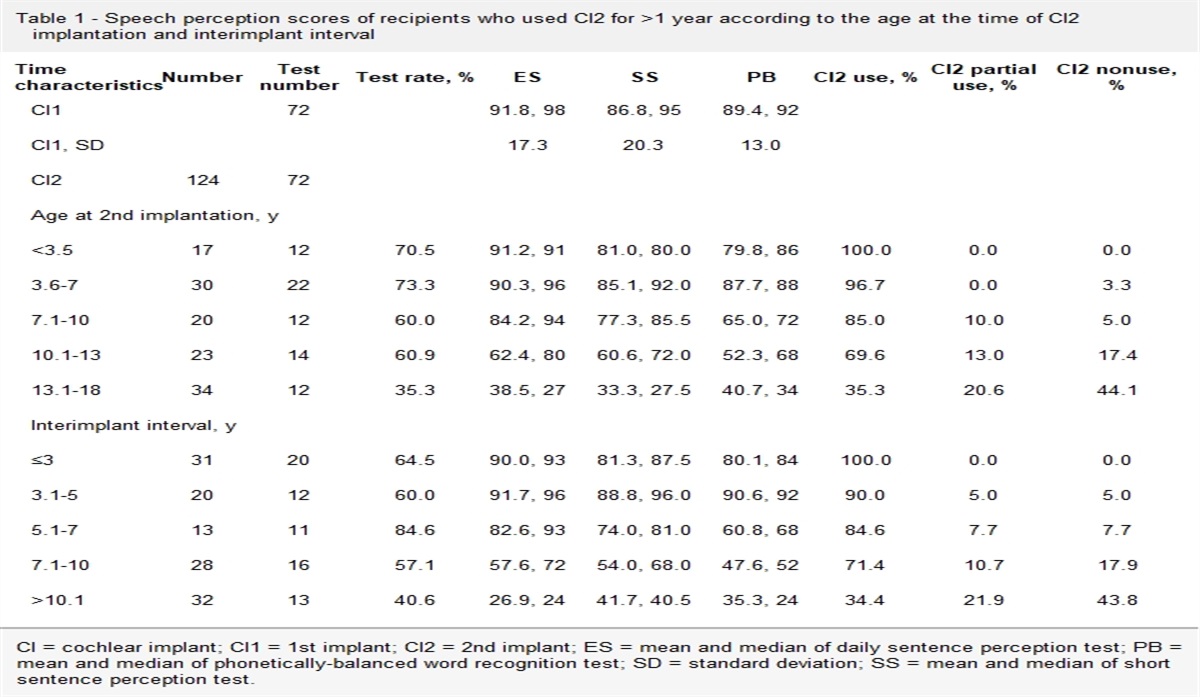
3. RESULTS 3.1. Patient disposition and baseline characteristicsA total of 161 patients with type 2 DM were screened, and 108 were enrolled in the lifestyle plan. During the lead-in period, a participant was hospitalized for urinary tract infection and excluded from the study. Eight participants withdrew consent and another 10 did not meet the randomization criteria. Eighty-nine patients were randomized to receive the statin treatments. The results of patient disposition are presented in Fig. 1. Three patients (1 from Group S and 2 from Group R) were prematurely excluded from the trial. Two of them withdrew consent during the study, and one patient was excluded because of an adverse event (pain over the breast area). The clinical characteristics of the participants at randomization are presented in Table 1. No differences were noted in baseline demographic and clinical characteristics between the two groups.
Table 1 - Clinical characteristics of participants at randomization Group S Group R p (Simvastatin treatment) (Rosuvastatin treatment) n 43 46 Sex (male/female) 22/21 27/19 0.62 Age (y) 58.1 (11.9) 60.5 (9.9) 0.31 Height (cm) 159.5 (7.2) 160.0 (8.0) 0.73 Weight (kg) 69.3 (10.1) 67.7 (11.1) 0.47 BMI (kg/m2) 27.2 (3.4) 26.4 (3.9) 0.28 Systolic BP (mmHg) 126 (12) 126 (11) 0.81 Diastolic BP (mmHg) 73 (9) 74 (9) 0.70 Cr (μmol/L) 77.8 (21.2) 72.5 (19.4) 0.18 Log ALT 1.43 (0.19) 1.47 (0.20) 0.32 Log AST 1.41 (0.14) 1.41 (0.15) 0.99 Fasting PG (mmol/L) 8.4 (2.3) 8.5 (2.5) 0.93 HbA1c (%) 7.9 (1.4) 8.2 (1.3) 0.33 DM duration (y) 5.7 (4.4) 6.3 (4.9) 0.54Data are expressed as mean (SD). Two-sample t tests or χ2 tests were used to compare the differences between the two groups.
ALT = alanine aminotransferase; AST = aspartate aminotransferase; BMI = body mass index; BP = blood pressure; Cr = creatinine; DM = diabetes mellitus; HbA1c = glycated hemoglobin; Log ALT = logarithmic transformation of ALT (in U/L); Log AST = logarithmic transformation of AST (in U/L); PG = plasma glucose.
 Fig. 1:
 Disposition of patients in the study. SAE, severe adverse events.
3.2. Efficacy assessmentThe two groups had comparable serum lipid profiles at the end of the lead-in period. The mean (SD) baseline LDL-C concentration was 3.5 (0.9) and 3.8 (0.8) mmol/L, and the mean baseline non–HDL-C concentration was 4.5 (1.1) and 4.7 (0.8) mmol/L in Group S and Group R, respectively. Effects of the statin treatments on serum LDL-C and non–HDL-C levels are outlined in Fig. 2A and 2B. Initially, the rosuvastatin and simvastatin treatments exhibited similar lowering effects on LDL-C levels. After adjustments for baseline LDL-C values and clinical parameters, Group R had lower LDL-C levels than Group S (p < 0.0001). Moreover, the rosuvastatin treatment surpassed the simvastatin treatment in lowering non–HDL-C levels, before and after adjustments. No between-group differences were noted in changes in HDL-C and TG levels with the two statin treatments (Fig. 2C and 2D). The mean (SD) baseline Apo-B level was 1.0 (0.2) and 1.0 (0.2) g/L, and the mean baseline Apo-AI level was 1.4 (0.2) and 1.4 (0.3) g/L in Group S and Group R, respectively. The effects of the statin treatments on serum Apo-B and Apo-AI levels are delineated in Fig. 3A and 3B. Apo-B levels were reduced by 47% after the rosuvastatin treatment and by 37% after the simvastatin treatment (p = 0.003). No between-group differences were noted in changes in Apo-AI levels, both before and after the adjustments.
 Fig. 2:
 Changes in the lipid profile during the study. After adjustments for baseline LDL-C and clinical parameters, Group R had lower LDL-C levels than Group S during the study (A). The rosuvastatin treatment surpassed the simvastatin treatment in lowering non–HDL-C in the study, before and after adjustments (B). No between-group differences were noted in changes in HDL-C (C) and TG (D) levels in the study with the two statin treatments. Group S received simvastatin 20 mg daily for 4 weeks, followed by 40 mg daily for another 8 weeks, and Group R received rosuvastatin 10 mg for 4 weeks, followed by 20 mg for 8 weeks. Non–HDL-C denotes the value of total cholesterol minus that of HDL-C. BMI = body mass index; HbA1c = glycated hemoglobin; HDL-C = high-density lipoprotein cholesterol; LDL-C = low-density lipoprotein cholesterol; TG = triglyceride.
 Fig. 3:
 Effects of statin treatment on serum Apo-B and Apo-AI levels in the study. The rosuvastatin treatment significantly reduced Apo-B levels compared with the simvastatin treatment before and after adjustments in the study (A). No between-group differences were noted in changes in Apo-AI values in the study, both before and after the adjustments (B). Apo-AI = apolipoprotein AI; Apo-B = apolipoprotein B; BMI = body mass index; DM = diabetes mellitus; HbA1c = glycated hemoglobin.
Although significant between-group differences were observed in changes in LDL-C and non–HDL-C levels, the percentages of patients achieving the combined goal were similar between the two groups at the end of the study (Fig. 4, right panel). Approximately 84% and 89% of participants in Group S and Group R achieved both LDL-C <2.6 mmol/L and non–HDL-C <3.4 mmol/L at week 12 (p = 0.66). The combined goal-achieving rate was higher in Group R (83%) than in Group S (58%) at the end of week 4 (p = 0.021). The percentages of patients who achieved the LDL-C goal of <2.6 mmol/L at week 12 in Group R (89%) and Group S (86%) were comparable (p = 0.91; Fig. 4, left panel), whereas the LDL-C control rates at week 4 were 65% in Group S and 85% in Group R (p = 0.057). The distribution of individual values for Apo-B in patients who achieved the combined goal is presented in Fig. 5. Notably, all patients who attained the combined lipid goal also met the Apo-B target of <0.9 g/L (4) with either treatment.
 Fig. 4:
 The percentages of patients achieving the combined lipid goal (right panel) and the LDL-C <2.6 mmol/L goal (left panel) were similar between the two groups at week 12 of the study. Non–HDL-C denotes the value of total cholesterol minus that of HDL-C. HDL-C = high-density lipoprotein cholesterol; LDL-C = low-density lipoprotein cholesterol.
 Fig. 5:
 The distribution of individual values for Apo-B concentrations in patients who achieved the combined lipid goal of LDL-C <2.6 mmol/L and non–HDL-C <3.4 mmol/L during the study. Non–HDL-C denotes the value of total cholesterol minus that of HDL-C. Apo-B = apolipoprotein B; HDL-C = high-density lipoprotein cholesterol; LDL-C = low-density lipoprotein cholesterol.
3.3. Safety assessmentThe two groups had comparable frequencies of patients with at least one adverse event (Table 2). The majority of the adverse events were mild to moderate in severity, and most were not considered related to the study drugs. The only serious adverse event (described in the aforementioned section) occurred in the lead-in period but was not considered related to study medication. The three most common adverse events encountered were common cold, neuro/psychiatric events, and musculoskeletal events (Table 2). No clinically significant differences in weight, blood pressure, and hematological variables were observed between the groups over the study course. Moreover, no within-subject and between-group differences were noted in fasting glucose and HbA1c levels. Regarding biochemical variables, no significant differences were observed between the two groups in mean ALT, AST, Cr, and CK levels. No clinically notable elevations in ALT and AST levels (≥3× the ULN) were observed in either treatment group. Throughout the study, only one patient in Group S had a clinically meaningful increase in CK levels (≥5× the ULN) at week 12. No episode of rhabdomyolysis was observed in either study group.
Table 2 - Most commonly reported adverse events in the study Week 0–week 4 Week 5–week 12 Group S (simvastatin 20 mg) Group R (rosuvastatin 10 mg) p Group S (simvastatin 40 mg) Group R (rosuvastatin 20 mg) p Total events numbers, n 22 18 31 25 Upper respiratory tract symptoms, n (%) 11 (50.0) 7 (38.9) 0.70 8 (25.8) 9 (36.0) 0.59 Neuro/psychological/psychiatric AE, n (%) 2 (9.1) 5 (27.8) 0.26 9 (29.0) 5 (20.0) 0.64 Musculoskeletal AE, n (%) 3 (13.6) 2 (11.1) 1.00 5 (16.1) 6 (24.0) 0.69 Gastrointestinal AE, n (%) 2 (9.1) 1 (5.6) 1.00 3 (9.7) 2 (8.0) 1.00 Cardiovascular AE, n (%) 1 (4.5) 1 (5.6) 1.00 3 (9.7) 1 (4.0) 0.77 Dermatological AE, n (%) 1 (4.5) 1 (5.6) 1.00 1 (3.2) 2 (8.0) 0.85 Other AE, n (%) 2 (9.1) 1 (5.6) 1.00 2 (6.5) 0 (0) 0.57 Patients with at least one AE, subjects (%) 16 (37.2) 13 (28.3) 0.50 19 (44.2) 14 (30.4) 0.26χ2 tests were used to compare the differences between the two groups.
AE = adverse events.
Although the importance of controlling dyslipidemia is known, many patients with DM do not achieve the defined lipid goals. Cheung et al17 reported that >50% of patients with DM fail to achieve the LDL-C and non–HDL-C targets in the United States. In Taiwan, only 35% of patients with DM could attain the lipid goal of LDL-C <2.6 mmol/L or total cholesterol <4.1 mmol/L.18 Yan et al. revealed that the majority of patients with DM who failed to achieve the recommended lipid levels were prescribed submaximal statin doses or not treated with a statin at all, especially in the primary prevention setting.19 Intensifying statin therapy by increasing the dose may facilitate a more effective attainment of the lipid goals.20 However, this is not necessarily the case. In the present study, the 20 mg simvastatin treatment appeared to be a suboptimal choice considering only 58% combined goal attainment (Fig. 4). Increasing the simvastatin dose to 40 mg daily to treat more patients and achieve the target is reasonable. However, only 6 % higher lipid goal achievement was noted after doubling the rosuvastatin dose in the study cohort (Fig. 4). The choice of using high-dose statins seems to depend on not only the judgment of the treating physician but also the baseline LDL-C levels and the potency of statins used.21
In the UK Prospective Diabetes Study (UKPDS), plasma lipid levels were measured in a cohort of over 3700 patients with newly diagnosed DM with a mean LDL-C level of 3.6 mmol/L in men and 3.9 mmol/L in women.22 In our study, the mean LDL-C levels at randomization were 3.6 mmol/L, which are consistent with the levels reported in the UKPDS. Our data revealed that 85% of the study patients with initial LDL-C levels of ≈3.6 mmol/L could achieve the primary preventive lipid goals with rosuvastatin or simvastatin therapy. Two earlier studies claimed that rosuvastatin can enable more patients with type 2 DM to attain the treatment lipid goals than other statin treatments.10,11 The initial LDL-C levels in these patients were apparently higher than the average LDL-C concentrations in the UKPDS, ranging from 4.2 to 4.6 mmol/L. We believe that the baseline LDL-C level is a crucial determinant of success of statin treatments. Several investigators have suggested a statin dosing strategy in accordance with baseline LDL-C levels for achieving cholesterol targets.23,24 Some evidence supports this concept of tailoring the statin dose by the baseline and targeting LDL-C levels to allow more patients with type 2 DM to achieve lipid control.24 Larger studies are required to consolidate the treatment strategy.
Apo-B–containing lipoproteins, including chylomicrons and its remnants, very-low-density lipoprotein, intermediate-density lipoprotein, low-density lipoproteins, and lipoprotein(a), represent the total burden of most atherogenic particles.4 An expert panel from the American Diabetes Association and the American College of Cardiology suggested guiding antilipid therapy with Apo-B measurements and treatment to achieve Apo-B goals in addition to LDL-C and non–HDL-C assessments.4 In our study, every patient who had achieved the combined lipid goal also met the Apo-B target of <0.9 g/L (Fig. 5). Reaching the combined goal of LDL-C <2.6 mmol/L and non–HDL-C <3.4 mmol/L appears to be a good predictor of achieving the Apo-B target of <0.9 g/L during statin treatments. However, in the CARDS, the non–HDL-C goal of 3.4 mmol/L was equivalent to an LDL-C level of 2.6 mmol/L, but the serum Apo-B concentration was equivalent to 0.96 g/L, exceeding the 0.9 g/L value recommended by the expert panel.25 The disparity may be related to differences between the present study and the CARDS in sample size, lipid criteria at recruitment, treatment duration, and use of different statins. Nevertheless, in view of an additional expense of measuring Apo-B, evaluating the diagnostic power of the combined lipid goal of LDL-C <2.6 mmol/L and non–HDL-C <3.4 mmol/L for predicting Apo-B of <0.9 g/L in a large cohort of DM recruited from real clinical practice is worthwhile.
Our results demonstrated that the two statin monotherapies could sufficiently control diabetic dyslipidemia. In clinical practice, the addition of a fibrate, a cholesterol absorption inhibitor, or niacin to primary statin therapy has been proposed for diabetic dyslipidemia management.21 Nevertheless, no outcome study has investigated combination lipid-lowering therapies for DM until recently. In the Action to Control Cardiovascular Risk in Diabetes lipid trial,26 patients with DM were randomly assigned to receive simvastatin plus fenofibrate or simvastatin alone. Adding fenofibrate to simvastatin led to no significant improvement in cardiovascular outcomes. For those with a residual cardiovascular risk, in addition to statin therapy, lifestyle risk factors such as diet, smoking, and physical inactivity may need to be targeted more effectively.27
In our study, the open-label design represents the possibility of bias. However, the impact of unblinding on medications was minimized using a randomized protocol. In conclusion, our data showed that 85% of patients with type 2 DM and dyslipidemia could achieve a combined lipid goal of LDL-C <2.6 mmol/L and non–HDL-C <3.4 mmol/L for primary CVD prevention with statin monotherapy. Both study treatments were sufficiently intensive for a 40% to 55% LDL-C reduction. Our data support the use of statin monotherapy as a primary lipid-modifying regimen for patients with diabetic dyslipidemia.
ACKNOWLEDGMENTSThe study was supported by grants from AstraZeneca Taiwan Inc.
The investigators were responsible for the study design, study protocol, statistical analysis, and reporting the results. The funding agency had no authority over the decision to publish the findings. The decision to submit the manuscript for publication was made by the investigators. Dr Chii-Min Hwu acknowledges the support from the National Science Council ROC (NSC98-2314-B-075-001-MY3, MOST110-2314-B-075-027-MY3) and the Taipei Veterans General Hospital (V99C1-153, V111-188).
REFERENCES 1. Krauss RM. Lipids and lipoproteins in patients with type 2 diabetes. Diabetes Care. 2004;27:1496–504. 2. Turner RC, Millns H, Neil HA, Stratton IM, Manley SE, Matthews DR, et al. Risk factors for coronary artery disease in non-insulin dependent diabetes mellitus: United Kingdom Prospective Diabetes Study (UKPDS: 23). BMJ. 1998;316:823–8. 3. Grundy SM, Cleeman JI, Merz CN, Brewer HB Jr, Clark LT, Hunninghake DB, et al.; National Heart, Lung, and Blood Institute; American College of Cardiology Foundation; American Heart Association. Implications of recent clinical trials for the National Cholesterol Education Program Adult Treatment Panel III guidelines. Circulation. 2004;110:227–39. 4. Brunzell JD, Davidson M, Furberg CD, Goldberg RB, Howard BV, Stein JH, et al.; American Diabetes Association; American College of Cardiology Foundation. Lipoprotein management in patients with cardiometabolic risk: consensus statement from the American Diabetes Association and the American College of Cardiology Foundation. Diabetes Care. 2008;31:811–22. 5. Dunn FL. Management of dyslipidemia in people with type 2 diabetes mellitus. Rev Endocr Metab Disord. 2010;11:41–51. 6. Colhoun HM, Betteridge DJ, Durrington PN, Hitman GA, Neil HA, Livingstone SJ, et al.; CARDS investigators. Primary prevention of cardiovascular disease with atorvastatin in type 2 diabetes in the Collaborative Atorvastatin Diabetes Study (CARDS): multicentre randomised placebo-controlled trial. Lancet. 2004;364:685–96. 7. Fisman EZ, Adler Y, Tenenbaum A. Statins research unfinished saga: desirability versus feasibility. Cardiovasc Diabetol. 2005;4:8. 8. Heart Protection Study Collaborative Group. MRC/BHF Heart Protection Study of cholesterol-lowering with simvastatin in 5963 people with diabetes: a randomised placebo-controlled trial. Lancet. 2003;361:2005–16. 9. Jones PH, Davidson MH, Stein EA, Bays HE, McKenney JM, Miller E, et al.; STELLAR Study Group. Comparison of the efficacy and safety of rosuvastatin versus atorvastatin, simvastatin, and pravastatin across doses (STELLAR* Trial). Am J Cardiol. 2003;92:152–60. 10. Wolffenbuttel BH, Franken AA, Vincent HH; Dutch Corall Study Group. Cholesterol-lowering effects of rosuvastatin compared with atorvastatin in patients with type 2 diabetes – CORALL study. J Intern Med 2005;257:531–9. 11. Berne C, Siewert-Delle A; URANUS study investigators. Comparison of rosuvastatin and atorvastatin for lipid lowering in patients with type 2 diabetes mellitus: results from the URANUS study. Cardiovasc Diabetol. 2005;4:7. 12. Betteridge DJ, Gibson JM. Effects of rosuvastatin on lipids, lipoproteins and apolipoproteins in the dyslipidaemia of diabetes. Diabet Med. 2007;24:541–9. 13. Fox KM, Gandhi SK, Ohsfeldt RL, Blasetto JW, Bays HE. Effectiveness of rosuvastatin in low-density lipoprotein cholesterol lowering and National Cholesterol Education Program Adult Treatment Panel guideline III LDL-C goal attainment compared to other statins among diabetes mellitus patients: a retrospective study using an electronic medical records dataset in the United States. Curr Med Res Opin. 2007;23:2125–33. 14. Ridker PM, Danielson E, Fonseca FA, Genest J, Gotto AM Jr, Kastelein JJ, et al.; JUPITER Study Group. Rosuvastatin to prevent vascular events in men and women with elevated C-reactive protein. N Engl J Med. 2008;359:2195–207. 15. Chen H, Ren JY, Xing Y, Zhang WL, Liu X, Wu P, et al. Short-term withdrawal of simvastatin induces endothelial dysfunction in patients with coronary artery disease: a dose-response effect dependent on endothelial nitric oxide synthase. Int J Cardiol. 2009;131:313–20. 16. Expert Panel on Detection, Evaluation, and Treatment of High Blood Cholesterol in Adults. Executive summary of the Third Report of the National Cholesterol Education Program (NCEP) Expert Panel on Detection, Evaluation, and Treatment of High Blood Cholesterol in Adults (Adult Treatment Panel III). JAMA. 2001;285:2486–97. 17. Cheung BM, Ong KL, Cherny SS, Sham PC, Tso AW, Lam KS. Diabetes prevalence and therapeutic target achievement in the United States, 1999 to 2006. Am J Med. 2009;122:443–53. 18. Yu NC, Su HY, Tsai ST, Lin BJ, Shiu RS, Hsieh YC, et al. ABC control of diabetes: survey data from National Diabetes Health Promotion Centers in Taiwan. Diabetes Res Clin Pract. 2009;84:194–200. 19. Yan AT, Yan RT, Tan M, Hackam DG, Leblanc KL, Kertland H, et al.; Vascular Protection (VP) and Guidelines Oriented Approach to Lipid Lowering (GOALL) Registries Investigators. Contemporary management of dyslipidemia in high-risk patients: targets still not met. Am J Med. 2006;119:676–83. 20. Kennedy AG, MacLean CD, Littenberg B, Ades PA, Pinckney RG. The challenge of achieving national cholesterol goals in patients with diabetes. Diabetes Care. 2005;28:1029–34. 21. American Diabetes Association. Dyslipidemia management in adults with diabetes. Diabetes Care. 2004;27(Suppl 1):S68–71. 22. UK Prospective Diabetes Study Group. U.K. Prospective Diabetes Study 27. Plasma lipids and lipoproteins at diagnosis of NIDDM by age and sex. Diabetes Care. 1997;20:1683–7. 23. Ducobu J, Claeys M, Commers K, Van Mieghem W, Nachtergaele H, Vandenbroucke M, et al. Efficacy of atorvastatin after LDL-cholesterol-based dose selection in high risk dyslipidaemic patients: results of the target dose study. Curr Med Res Opin. 2007;23:1821–7. 24. Ferrer-García JC, Sanchez-Ballester E, Albalat-Galera R, Berzosa-Sanchez M, Herrera-Ballester A. Efficacy of atorvastatin for achieving cholesterol targets after LDL-cholesterol based dose selection in patients with type 2 diabetes. J Cardiovasc Pharmacol Ther. 2008;13:183–8. 25. Charlton-Menys V, Betteridge DJ, Colhoun H, Fuller J, France M, Hitman GA, et al. Targets of statin therapy: LDL cholesterol, non-HDL cholesterol, and apolipoprotein B in type 2 diabetes in the Collaborative Atorvastatin Diabetes Study (CARDS). Clin Chem. 2009;55:473–80. 26. The ACCORD Study Group. Effects of combination lipid therapy in type 2 diabetes mellitus. N Engl J Med. 2010;362:1563–74. 27. Gotto AM Jr. Improving lipid goal attainment: is it enough? Circulation. 2009;120:3–5.
留言 (0)