
記住我
Hepatocellular carcinoma (HCC) is the third most common cause of cancer-related death worldwide, leading to approximately 830,000 deaths in 2020.1 Despite recent advancements in targeted molecular therapy, surgical resection of the primary tumor remains the gold standard treatment for resectable HCC.2 However, liver resection carries a risk of postoperative complications for patients with reduced liver functional reserve, with a reported rate of up to 47.7%.3 Notably, postoperative complications may increase the risk of long-term mortality and recurrence following liver resection for HCC.4
Host immunity is important for cancer patients to protect against surgical stress and related complications. Preoperative immune dysfunction is known to increase the risk of mortality and morbidity after major surgery.5 Surgical trauma suppresses immune function and triggers systemic inflammation, which may adversely impact the prognosis of cancer patients.6 In addition, malnutrition is associated with impaired immune function and wound healing, predisposing patients to adverse postoperative outcomes.7 Mounting evidence indicates that inflammation and immune-nutritional markers may predict complications after surgical resection of miscellaneous cancers, including lung cancer,8 colorectal cancer,9 gastric cancer,10 and bladder cancer.11 However, few studies have investigated the prognostic role of inflammation and immune-nutritional markers for postoperative complications in HCC.12–15 Importantly, there have been several research flaws in previous studies, including small sample sizes (<1000 patients),12–14 insufficient adjustment for confounders,12 and no comparison of the different markers.12–15 Furthermore, the results of previous studies were not validated,12–15 and to the best of our knowledge, there is still no predictive model based on inflammation or immune-nutritional indices for postoperative complications pertinent to HCC in the current literature.
We conducted a single-center cohort study to evaluate the prognostic role of inflammation and immune-nutritional markers for high-grade postoperative complications after liver resection for HCC. There were two objectives in this study. First, we sought to compare various representative preoperative noninvasive serum markers and their potential predictive ability for postoperative complications, including the neutrophil-to-lymphocyte ratio (NLR), the platelet-to-lymphocyte ratio (PLR), the prognostic nutritional index (PNI), the Model for End-Stage Liver Disease (MELD) score, the Albumin-Bilirubin score, the Fibrosis-4 score, and the Aspartate Aminotransferase to Platelet Ratio Index (APRI) score. Second, we aimed to integrate these markers with other clinical factors to build a predictive model for severe complications following resection of HCC.
2. METHODS 2.1. Patient selection and clinical settingThe present study was approved by the Institutional Review Board of Taipei Veterans General Hospital (IRB-TPEVGH No. 2021-07-035BC). The need for written informed consent was waived by the Institutional Review Board due to the study’s retrospective nature, and the study was conducted in accordance with all current guidelines and regulations.
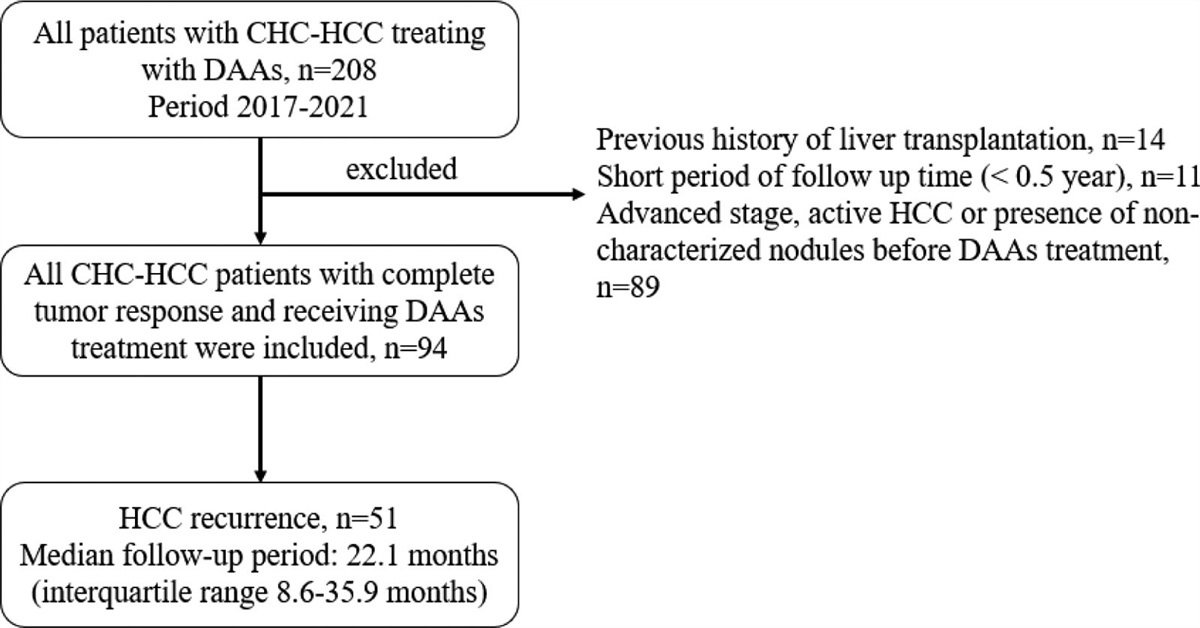
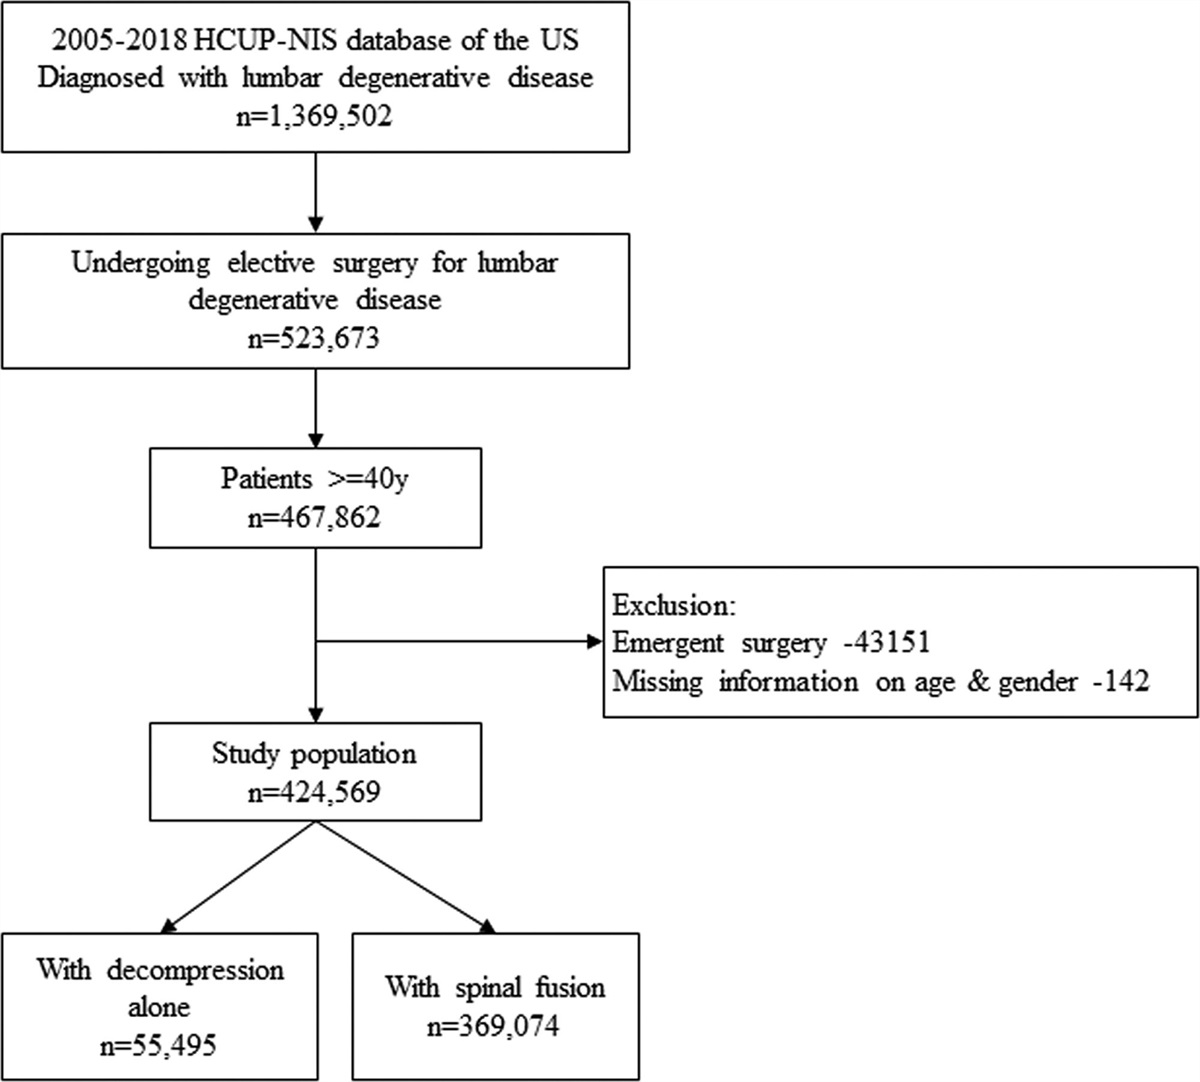
We included a total of 2215 consecutive patients who underwent liver resection at the medical center from January 2005 to December 2016. Patients were excluded for the following reasons: repeat operation, liver transplantation, pathology-proven benign tumors, metastatic liver cancer, non-HCC cancer, HCC with lymph node or distant metastasis, Child-Pugh class C, Barcelona Clinic Liver Cancer (BCLC) stage C or D, and critical missing data. A total of 1431 patients were selected for analysis (Fig. 1).
 Fig. 1:
 Flow diagram for patient selection.
2.2. Noninvasive serum markers for assessmentThe NLR was calculated by neutrophil count/ lymphocyte count. In the same way, the PLR was equal to the platelet count/ lymphocyte count. PNI was equal to 10 × serum albumin (g·dL−1) + 0.005 × lymphocyte count (103·μL−1).16 The MELD score was equal to 3.78 × ln (total bilirubin [mg·dL−1]) + 11.2 × ln (international normalized ratio) + 9.57 × ln (serum creatinine [mg·dL−1]) + 6.43.17 The Albumin-Bilirubin score was equal to log10 (total bilirubin [µmol·L−1] × 0.66) + [serum albumin [g·L−1] × -0.0852].18 The Fibrosis-4 score was equal to age (years) × aspartate aminotransferase (AST) (U·L−1)/(platelet count [103·μL−1] × alanine aminotransferase [ALT]1/2 [U·L−1]).19 The APRI score was equal to [AST level/AST (upper limit of normal range)] × 100/platelet count (103·μL−1).20 The concentrations of serum albumin, creatinine, total bilirubin, AST, ALT, neutrophils, lymphocytes, and platelets in the peripheral blood 1 day before the surgery, were retrospectively collected.
2.3. Liver resectionAt the medical center, all liver resections were performed by an experienced general surgeon who performed at least 50 cases annually. The liver parenchyma was transected using a clamp-crush technique. Intermittent Pringle’s maneuver and argon beam coagulator were routinely used to control hemorrhage. For selected patients, minimally invasive surgery using a laparoscopic or robotic technique was performed from July 2011.
2.4. Postoperative complicationsThe primary outcome of the current study was high-grade postoperative complications which occurred within 30 days after the surgery. A high-grade complication was defined as grade III or higher using the Clavien-Dindo (CD) classification system, a representative ranking system for postoperative complications used worldwide.21 We evaluated CD grades III to V (III: requiring surgical, endoscopic, or radiological intervention; IV: requiring intensive care management; V: death of a patient) because such complications require invasive treatment.21,22
2.5. Variables considered for analysisFor prediction modeling, we selected preoperative and intraoperative factors potentially associated with postoperative complications based on the available data, physiological plausibility and the existing literature. In addition to demographics and coexisting diseases, clinical characteristics were reviewed, including Child-Pugh class, clinically significant portal hypertension (hepatic venous pressure gradient ≥10 mm Hg), presence of esophageal varices, hepatitis viral serology, prior receipts of antiviral therapy for hepatitis B or C, preoperative serum levels of AST, ALT, total bilirubin, gamma-glutamyl transferase, and alpha-fetoprotein.23–26 Patients were classified according to the BCLC staging system.27 Pathology features comprised tumor size and number, differentiation, microvascular invasion, extracapsular penetration, severity of inflammation, steatosis, and fibrosis.28,29 Preoperative locoregional therapy consisted of trans-arterial chemoembolization, radiofrequency ablation, and percutaneous ethanol injection. Surgical and anesthetic covariates were extent of hepatectomy (>2 Couinaud liver segments or not), R0 resection, laparoscopic or robotic surgery, epidural anesthesia, intraoperative blood loss and transfusion, and anesthesia time.22,30–35
2.6. Statistical analysisThe Shapiro-Wilk test and Kolmogorov-Smirnov test were used to examine the normality of the included variables. Logarithmic transformation was applied to decrease the skewness of non-normal variables. The dataset was randomly partitioned into development and validation datasets in an approximately 60:40 ratio using the RAND function of Statistics Analysis System (SAS), version 9.4 (SAS Institute Inc., Cary, NC). Univariate logistic regression analysis was performed to evaluate the association of noninvasive serum markers and other covariates with high-grade complications in the development dataset. Significant factors in the univariate model were incorporated into the stepwise backward variable elimination procedure to determine independent predictors and to obtain the risk score for postoperative complications, based on minimization of the Akaike’s Information Criterion with a p-value threshold of 0.05. The validation dataset was used to assess the diagnostic utility of three models, including the initial model (preoperative noninvasive serum markers), more inclusive model (all preoperative predictors), and final model (all preoperative and intraoperative predictors).36 Model discrimination was estimated using area under the receiver operating characteristic curve (AUC). The optimal cutoff value for risk scores was determined using the joint maximum sensitivity and specificity of the receiver operating characteristic curves associated with complications (Youden’s index).37 We considered p < 0.05 to indicate a statistically significant difference for a two-sided test. All the statistical analyses were performed using SAS software.
3. RESULTS 3.1. Patient characteristicsA total of 1431 patients were included in the study and randomly split into the development cohort (n = 835) and the validation cohort (n = 596). Table 1 shows the demographic, clinical and pathological characteristics of the included patients. The distribution of baseline patient characteristics was generally balanced between the two cohorts, except for the American Society of Anesthesiologists class, diabetes mellitus, and level of total bilirubin.
Table 1 - Patient demographics, clinical and pathological characteristics Development cohort (n = 835) Validation cohort (n = 596) p Age, year 61.6 ± 13.0 60.8 ± 12.5 0.2504 Sex, male 635 (76.1%) 460 (77.2%) 0.6181 Body mass index, kg·m−1 24.4 ± 3.8 24.6 ± 3.6 0.4698 ASA class ≥3 272 (32.6%) 152 (25.5%) 0.0039 Etiology of hepatocellular carcinoma Hepatitis B surface antigen positive 567 (67.9%) 389 (65.3%) 0.2966 Hepatitis C antibody positive 180 (21.6%) 135 (22.7%) 0.6224 Alcoholism 63 (7.5%) 40 (6.7%) 0.5476 Child-Pugh class B 24 (2.9%) 23 (3.9%) 0.3028 Clinically significant portal hypertension 81 (9.7%) 61 (10.2%) 0.7389 Esophageal varices 50 (6.0%) 35 (5.9%) 0.9274 Diabetes mellitus 222 (26.6%) 128 (21.5%) 0.0266 Ischemic heart disease 75 (9.0%) 40 (6.7%) 0.1193 Chronic kidney disease 86 (10.3%) 48 (8.1%) 0.1506 Serum markers Prognostic nutritional index 48.9 (45.1 to 52.1) 48.9 (45.3 to 52.5) 0.8528 Neutrophil-to-lymphocyte ratio 1.9 (1.4 to 2.8) 1.9 (1.4 to 2.8) 0.5474 Platelet-to-lymphocyte ratio 102.0 (74.4 to 143.6) 100.0 (75.5 to 138.1) 0.4741 MELD score 4.8 (2.5 to 6.8) 4.6 (2.5 to 6.3) 0.0812 Albumin-Bilirubin score -5.0 (-5.3 to -4.8) -5.0 (-5.3 to -4.8) 0.7865 Fibrosis-4 score 2.3 (1.5 to 3.6) 2.3 (1.4 to 3.7) 0.7537 APRI score 0.6 (0.4 to 1.0) 0.6 (0.4 to 1.1) 0.5486 Preoperative laboratory tests Hemoglobin, g·dL−1 13.3 ± 1.7 13.4 ± 1.7 0.8183 Platelet, 103·μL−1 181.5 ± 81.7 178.3 ± 81.2 0.4555 Thrombocytopenia 318 (38.1%) 254 (42.6%) 0.0844 Serum glucose, mg·dL−1 106 ± 39 105 ± 37 0.7987 Serum creatinine, mg·dL−1 1.1 ± 0.8 1.1 ± 0.9 0.9943 International normalized ratio 1.05 ± 0.26 1.04 ± 0.07 0.3604 Total bilirubin ≥ 1.0 mg·dL−1 206 (24.7%) 116 (19.5%) 0.0209 Aspartate aminotransferase > 40 IU·L−1 388 (46.6%) 273 (46.0%) 0.8010 Alanine aminotransferase > 40 IU·L−1 399 (47.8%) 282 (47.3%) 0.8610 Gamma-glutamyl transferase > 50 IU·L−1 352 (44.1%) 238 (42.4%) 0.5317 Alpha-fetoprotein > 20 ng·mL−1 398 (49.0%) 306 (52.7%) 0.1787 Albumin < 3.5 g·dL−1 64 (7.7%) 45 (7.6%) 0.9359 BCLC stage 0.9396 Stage 0 109 (13.1%) 80 (13.4%) Stage A 364 (43.6%) 263 (44.1%) Stage B 362 (43.4%) 253 (42.5%) Pathologic characteristics Tumor diameter >5 cm 313 (37.5%) 205 (34.4%) 0.2306 Multifocal cancer 175 (21.0%) 135 (22.7%) 0.4435 Tumor differentiation 0.6983 Good 96 (11.5%) 77 (12.9%) Moderate 452 (54.1%) 314 (52.7%) Poor or undifferentiated 287 (34.4%) 205 (34.4%) Microvascular invasion 564 (67.5%) 416 (69.8%) 0.3656 Extracapsular penetration 359 (43.0%) 243 (40.8%) 0.4012 Inflammation 0.3321 Absent or mild 724 (86.7%) 506 (84.9%) Moderate or severe 111 (13.3%) 90 (15.1%) Steatosis 0.2969 Absent or mild 790 (94.6%) 556 (93.3%) Moderate or severe 45 (5.4%) 40 (6.7%) Fibrosis 0.7110 Absent or mild 299 (35.8%) 203 (34.1%) Moderate or severe 322 (38.6%) 242 (40.6%) Cirrhosis 214 (25.6%) 151 (25.3%) Preoperative locoregional therapy 80 (9.6%) 47 (7.9%) 0.2664 Preoperative antiviral therapy 141 (16.9%) 91 (15.3%) 0.4130 Surgical and anesthetic management Hepatectomy > 2 segments 311 (37.3%) 213 (35.7%) 0.5596 R0 resection 782 (93.7%) 563 (94.5%) 0.5249 Laparoscopic or robotic surgery 54 (6.5%) 36 (6.0%) 0.7430 Epidural anesthesia 321 (38.4%) 227 (38.1%) 0.8914 Intraoperative blood loss (mL) 650 (300 to 1200) 600 (300 to 1250) 0.6920 Blood transfusion 525 (62.9%) 364 (61.1%) 0.4888 Anesthesia time (min) 345 (285 to 435) 335 (270 to 420) 0.0634 Operation period (2011-2016) 432 (51.7%) 320 (53.7%) 0.4654Values were mean ± SD, count (percent), or median (interquartile range).
APRI = Aspartate Aminotransferase to Platelet Ratio Index; ASA = American Society of Anesthesiologists; BCLC = Barcelona Clinic Liver Cancer; MELD = Model for End-Stage Liver Disease.
A total of 106 (7.4%) patients developed high-grade complications within 30 days after liver resection, 67 in the development cohort and 39 in the validation cohort. Among them, 72 (5.0%), 21 (1.5%), and 13 (0.9%) had CD grade III, IV, and V complications, respectively. The most common complications were bile leakage (n = 30, 2.1%) in those with CD grade III, and respiratory failure (n = 15, 1.0%) in those with CD grade IV complications (Table 2).
Table 2 - High-grade postoperative complications in the development and validation cohorts Complication Development cohort (n = 835) Validation cohort (n = 596) Clavien-Dindo grade IIIa Bile leakage 15 (1.8%) 15 (2.5%) Pleural effusion 9 (1.1%) 8 (1.3%) Wound complication 8 (1.0%) 3 (0.5%) Intra-abdominal abscess 5 (0.6%) 4 (0.7%) Massive ascites 3 (0.4%) 0 (0) Hepatic hemorrhage 2 (0.2%) 2 (0.3%) Obstructive jaundice 1 (0.1%) 1 (0.2%) Liver abscess 1 (0.1%) 0 (0) Pneumothorax 1 (0.1%) 0 (0) Occlusion of common hepatic duct 1 (0.1%) 0 (0) Edematous change of bile duct wall 1 (0.1%) 0 (0) Peritonitis 1 (0.1%) 0 (0) Duodenal ulcer bleeding 1 (0.1%) 0 (0) Intestinal obstruction 0 (0) 1 (0.2%) Acute kidney injury 1 (0.1%) 0 (0) Clavien-Dindo grade IV Respiratory failure 12 (1.4%) 3 (0.5%) Cerebral infarction 1 (0.1%) 1 (0.2%) Sepsis 1 (0.1%) 1 (0.2%) Multiorgan failure 1 (0.1%) 0 (0) Hepatic failure 0 (0) 0 (0) Myocardial infarction 1 (0.1%) 0 (0) Clavien-Dindo grade V Death of a patient 8 (1.3%) 5 (0.8%)aSeven and five patients in the development and validation cohorts had two complications.
In the univariate analysis, there were three noninvasive serum markers significantly associated with high-grade complications, including NLR (crude odds ratio [OR]: 1.09, 95% confidence interval [CI], 1.02-1.17), PNI (OR: 0.91, 95% CI, 0.87-0.95), and Albumin-Bilirubin score (OR: 3.01, 95% CI, 1.67-5.43). Other significant factors were American Society of Anesthesiologists class, diabetes mellitus, serum levels of glucose, AST, ALT, gamma-glutamyl transferase, and albumin, multifocal cancer, extent of hepatectomy, intraoperative blood loss, blood transfusion, anesthesia time, extracapsular penetration, and operation period (Table 3).
Table 3 - Associations of preoperative and intraoperative factors with high-grade postoperative complications in the development cohort Univariate Multivariable OR (95% CI) p OR (95% CI) p Neutrophil-to-lymphocyte ratio 1.09 (1.02-1.17) 0.0147 1.10 (1.02–1.19) 0.0124 Platelet-to-lymphocyte ratio 1.00 (1.00-1.00) 0.1234 . . Prognostic nutritional index 0.91 (0.87-0.95) <0.0001 . . MELD score 1.00 (0.94-1.06) 0.8678 . . Albumin-Bilirubin score 3.01 (1.67-5.43) 0.0003 . . Fibrosis-4 score 1.06 (0.98-1.15) 0.1307 . . APRI score 1.12 (0.95-1.32) 0.1720 . . Age, year 1.01 (0.99-1.03) 0.2082 . . Sex, male 0.85 (0.48-1.49) 0.5605 . . Body mass index, kg·m−1 1.03 (0.96-1.10) 0.4482 . . ASA class ≥ 3 1.88 (1.14-3.12) 0.0138 . . HBsAg positive 0.96 (0.57-1.64) 0.8918 . . Anti-HCV Ab positive 0.70 (0.36-1.36) 0.2884 . . Alcoholism 2.05 (0.97-4.36) 0.0620 . . Child-Pugh class B 1.04 (0.24-4.54) 0.9541 . . CSPH 1.09 (0.48-2.48) 0.8295 . . Esophageal varices 1.30 (0.50-3.38) 0.5963 . . Diabetes mellitus 2.97 (1.79-4.93) <0.0001 3.08 (1.65-5.78) 0.0004 Ischemic heart disease 1.65 (0.78-3.48) 0.1881 . . Chronic kidney disease 1.20 (0.55-2.60) 0.6453 . . Hemoglobin, g·dL−1 0.91 (0.79-1.04) 0.1704 . . Platelet, 103·μL−1 1.00 (1.00-1.00) 0.5702 . . Thrombocytopenia 1.03 (0.62-1.73) 0.8987 . . Serum glucose, mg·dL−1 1.01 (1.00-1.01) 0.0498 . . Serum creatinine, mg·dL−1 0.97 (0.70-1.35) 0.8586 . . International normalized ratio 1.20 (0.62-2.30) 0.5905 . . Total bilirubin ≥ 1.0 mg·dL−1 1.55 (0.91-2.65) 0.1082 . . AST > 40 IU·L−1 1.90 (1.14-3.17) 0.0140 .
留言 (0)