
記住我


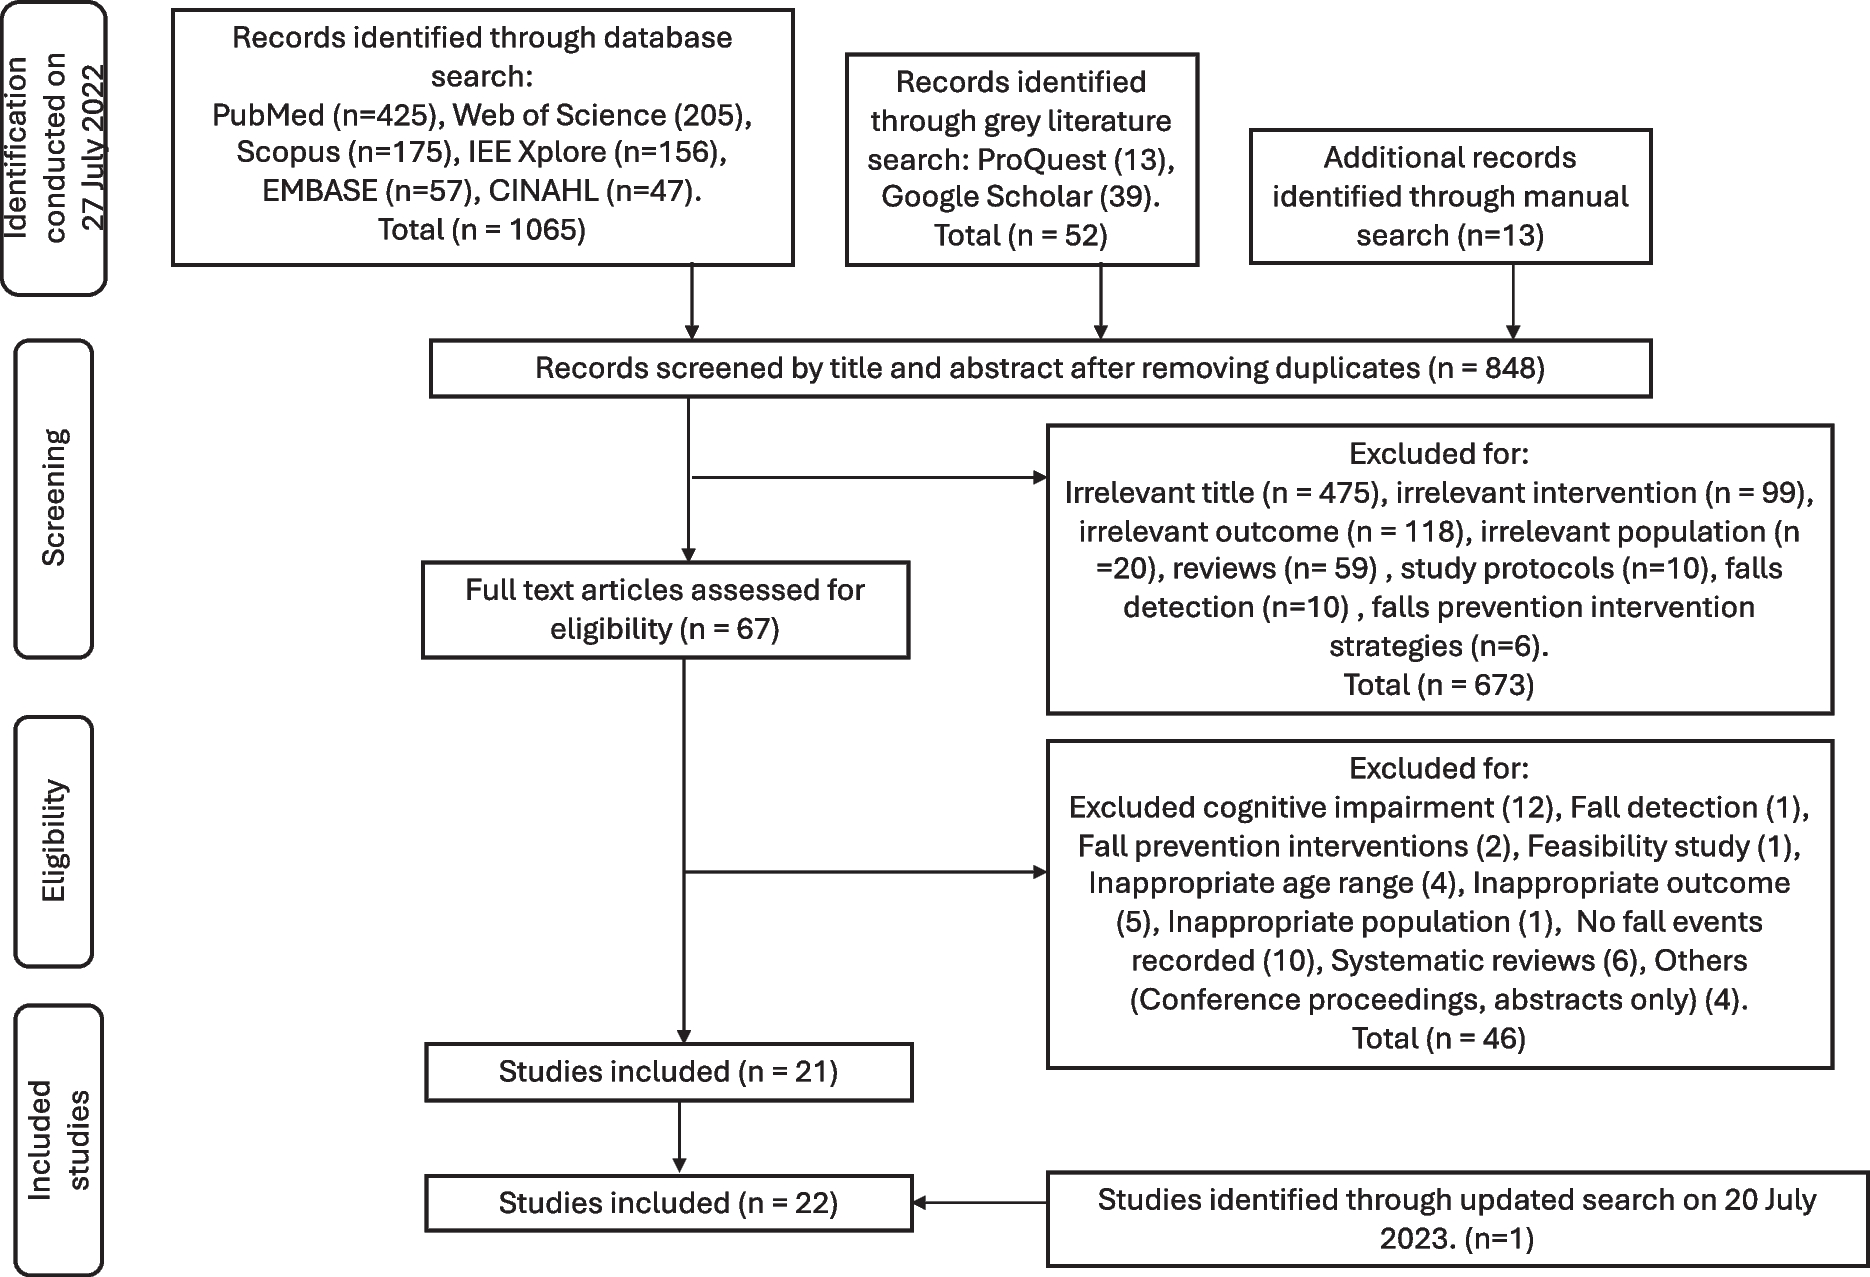


Please refer to Fig. 1 for a flow diagram that outlines the research plan.
Fig. 1
Flow diagram of the analysis plan for the investigation of polygenic risk for exceptional longevity with metabolic syndrome
ParticipantsFor each study, participants with both genetic and phenotypic data were utilised, thus reducing the initial sample size.
Primary cohort: UK Biobank (UKBB)This study is comprised of 502 631 individuals (age range 40–69, mean age 56.5 years, 46% male, Application Number 53850) enrolled at 22 assessment sites in England, Scotland and Wales between 2006 and 2010 [39]. Individuals were recruited via the National Health Register (NHS) and written informed consent was obtained. Extensive phenotypic data were collected at baseline including information from questionnaires, physical measurements, sample assays, imaging as well as mortality records. The North West Multi-centre Research Ethics Committee approved the UKBB study. Blood samples were collected for DNA and blood biochemistry analysis.
Replication cohorts Hunter Community Study (HCS)HCS is a cohort of 3253 individuals (age range 55–85, mean age 66.3 years, 46% male) recruited from the Hunter region of NSW using the compulsory electoral roll and Medicare lists from New South Wales (NSW), Australia [40]. The University of Newcastle and Hunter New England Human Research Ethics Committees (HREC 03/12/10/3.26) approved the HCS.
Older Australian Twins Study (OATS)OATS recruited mono and dizygotic twins 65 years and older via the Australian Twin Registry (ATR), a national registry of twins willing to participate in health research. OATS is a cohort of 623 individuals (age range 65–90, mean age 70.7 years, 40% male) [41]. Ethics approval was obtained from the following ethics committees: Australian Twin Registry, University of New South Wales, University of Melbourne, Queensland Institute of Medical Research and the South Eastern Sydney & Illawarra Area Health Service.
Sydney Memory and Ageing Study (Sydney MAS)Sydney MAS recruited participants using the compulsory electoral roll and Medicare lists from New South Wales (NSW), Australia [42]. Sydney MAS is a cohort of 1037 individuals (age range 70–90 years, mean age 78.8 years, 45% male). The Human Research Ethics Committees of UNSW Sydney and the South Eastern Sydney and Illawarra Area Health Service (HC05037, HC09382, HC14327 and HC190962) granted ethics approval for Sydney MAS.
Written informed consent was obtained from all participants. Fasting blood samples were collected for DNA and blood biochemistry analysis. More information on the Australian studies are found in McEvoy et al. and Sachdev et al. [40,41,42].
The Gothenburg H70 Birth Cohort StudiesThese studies recruit participants based on specific birth dates obtained from the Swedish Tax Agency’s population register and registered as residents in Gothenburg [43]. Included in this specific study sample were 2273 individuals (age range 70–93 years, mean age 73.3, 38% male) who were born in 1908, 1914, 1922 and 1930 and had an examination in 2000–2002, 2005–2007, 2009–2011 or 2015–2017, and individuals who were born 1944 and examined in 2014–2016, with both genetic data and information on all metabolic variables. Consent forms were obtained before undergoing extensive examinations at the Neuropsychiatric outpatient department at the Sahlgrenska University Hospital, or at the residence of the participant for those who had difficulties to come to the clinic, including interviews and physical examinations. The interviews included questions on present and past medical history and social factors with the participant and with a close informant. The physical examinations included blood sampling, anthropometric measures (e.g., height and weight) and blood pressure. The Regional Ethical Review Board in Gothenburg approved the Gothenburg H70 Birth Cohort Studies.
MetS calculationBlood biochemical measures used for calculation of MetS were serum glucose, lipids—cholesterol, triglycerides, high-density lipoproteins. For the UKBB, a Beckman Coulter AU5800 measured serum glucose, HDL-cholesterol and triglycerides, by standard methods. Since blood samples were collected at different times of fasting in the UKBB, glucose and triglyceride levels were modified as per Lind [44]. Specifically, glucose levels were adjusted down by 1.5 mmol/L if reported fasting time was 0 h, 3.0 mmol/L if fasting was 1 h, 1.0 mmol/L if fasting was 2 h, 0.3 mmol/L if fasting was 3 h and no correction if fasting time was > 3 h. For triglycerides, the levels were adjusted down by 0.1 mmol/L if reported fasting time was 1 h. Similarly, reductions were 0.2, 0.4, 0.6, 0.65, 0.4 and 0.1 mmol/L for fasting times 2–7 h. [44]. The H70 study cohort and the Australian studies collected fasting blood samples and hence measurements were not adjusted for glucose and lipids. Blood pressure was measured twice in the sitting position with the automated Omron device and the average was used. For the H70 study cohort, blood pressure was measured in the same manner but only once. In all cohorts, a trained researcher or a research nurse measured waist circumference. Medication was self-reported.
The harmonized National Cholesterol Education Program (NCEP) criteria for MetS based on Lind were used [44]. A participant had MetS if three or more of the following five criteria (based on 8 components) were met: systolic blood pressure ≥ 130 and/or diastolic blood pressure ≥ 85 mmHg and/or currently using antihypertensive medication/s, serum glucose ≥ 6.1 mmol/L or using antidiabetic treatment, serum triglycerides ≥ 1.7 mmol/L, HDL-cholesterol < 1.0 mmol/L in men and < 1.3 mmol/L in women and waist circumference > 102 cm in men and > 88 cm in women. If three or more of the five criteria had missing values for a given participant, MetS status was set as missing.
GenotypingIn the UKBB cohort, DNA was extracted using standard protocols. Genotyping was performed using the Affymetrix UK BiLEVE Axiom® array on an initial 50 000 participants according to the manufacturer’s instructions. The remaining 450 000 participants were genotyped using the Affymetrix UK Biobank Axiom® array, that genotyped ~ 850 000 variants. The two arrays have over 95% common content. Genotyped SNPs were removed if as follows: (i) quality control failed in more than one batch (ii) overall missing rate was ≥ 5% and (iii) minor allele frequency was < 0.01. Samples identified as outliers for heterozygosity and missing rate were excluded. The quality controlled genotype data was phased and imputation was carried out with the IMPUTE4 program (https://jmarchini.org/software/) [45] using the Haplotype Reference Consortium reference panel [46] and UK10K haplotype resources [47] by a collaborative group headed by the Wellcome Trust Centre for Human Genetics. The result of the imputation process is a dataset with ~ 96 million SNPs in 487 442 individuals.
The data filtering steps utilised for the current analysis are as follows: (i) selected Caucasians (n = 409 615), (ii) removal of participants with poor heterozygosity or missing data (n = 480), (iii) exclusion of participant self-declared as having a mixed ancestral background (n = 692) and high heterozygosity rate (after correcting for ancestry) or high missing rate (n = 840), (iv) participant excluded from kinship inference process, meaning having ten or more third degree relatives identified (n = 188) and (v) lastly, removal of outliers for heterozygosity or missing rate (n = 968). The final filtered sample size for this analysis is 407 807 from the total sample size of 502 505 participants.
In all of the Australian cohorts, DNA was extracted using standard methods. HCS were genotyped using the Affymetrix Axiom Kaiser array, OATS using the Illumina Omni Express array and Sydney MAS samples using the Affymetrix Genome-wide Human SNP Array 6.0 all according to the manufacturers’ instructions. Genotyped SNPs were excluded if the following criteria were observed: (i) the call rate was < 95%, (ii) p-value for HWE was < 10–6 and (iii) minor allele frequency was < 0.01 (iv) strand ambiguous (A/T and C/G). If first or second-degree relatives were identified, only one family member was retained for analysis. EIGENSTRAT analysis allowed for the detection and removal of any ethnic outliers. Any samples with deviations from heterozygosity were also omitted (FHET outside + / − 0.2).
After QC checks, there was data on 739,276 SNPs for HCS. OATS and Sydney MAS had genotyping data on 636,749 and 734,550 SNPs respectively. The quality controlled genotype data was imputed in the Michigan imputation server (https://imputationserver.sph.umich.edu) [48] using the Haplotype Reference Consortium reference panel (v3.20101123), and SNPs with high quality (imputation quality score > 0.6) were used in the calculation of the ELPRS. The genotypes for the APOE single nucleotide polymorphisms (SNPs) rs7412 and rs429358 were extracted from the imputed dosage using PLINK. Both SNPs were imputed with high accuracy in both of the cohorts (R2 > 0.80) and APOE ε2/3/4 haplotypes were inferred [49]. The final filtered sample size for this analysis is 2122, 539 and 925 participants for HCS, OATS and MAS respectively.
In the Gothenburg H70 Birth Cohort Studies, extraction of DNA from whole blood was performed according to standard procedures at LGC Genomics in Berlin (Germany). All the DNA samples have been genotyped at University College London (UK), using the Neuro Consortium Array (neurochip) from Illumina [43]. QC included the removal of individuals due to any of the following: per-individual call rate < 98%, sex mismatch and deviation from heterozygosity (FHET outside + / − 0.2). Furthermore, individuals were defined as non-European ancestral outliers, and removed, if their first two PCs exceeded 6 standard deviations from the mean values of the European samples in the 1000 Genome global reference population. Closely related individuals were removed based on pairwise PI_HAT (i.e. proportion of the genome that is in identity-by-descent; calculated using genome option in PLINK) > = 0.2. Genetic variants were excluded due to per-SNP call rate < 98%, minor allele frequency (MAF) < 0.01, and Hardy–Weinberg disequilibrium (p < 1 × 10⁻⁶). The Sanger imputation service was used to impute post-QC, using the reference panel of Haplotype Reference Consortium data (HRC1.1) [50]. The single nucleotide polymorphisms (SNPs) rs7412 and rs429358, defining the APOE alleles ε2, ε3 and ε4, were also genotyped, using the KASPar PCR SNP genotyping system (LGC Genomics, Hoddesdon, Herts, UK). The final filtered sample size available for this specific study (i.e. individuals with both genetic and metabolic data) was 2273 participants.
Exceptional longevity polygenic risk score (ELPRS)ELPRS were generated by using a Python package for polygenic risk score with continuous shrinkage (PRS-CS) available on the github repository (https://github.com/getian107/PRScs). PRS-CS infers posterior SNP effect sizes under continuous shrinkage priors using summary statistics obtained from a GWAS. In contrast to using GWAS p-value thresholds, PRS-CS uses the results from all SNPs in the summary statistics rather than a subset. This allows for considerable computational improvements owing to marker-specific adaptive shrinkage, which is robust to varying genetic architectures, and it enables multivariate modelling of local LD patterns [51]. PRS-CS was run with default parameters (gamma-gamma priors PARAM_A = 1, PARAM_B = 0.5, shrinkage parameter phi = 0.2, MCMC iterations = 1000, number of MCMC burn-in iterations = 500 and the MCMC thinning factor = 5). For the primary analyses of this study, the summary statistics were from an EL GWAS study, based on cases who had lived to an age above the 90th percentile for survival and controls were those who had died at or before the 60th percentile [38]. Due to the strong associations between exceptional longevity and the APOE locus [8], the ELPRS were also calculated after removing this locus (chromosome 19, base pair 45,116,911 – 46,318,605, Genome Reference Consortium Human Reference Build 37).
Secondary analyses also examined additional PRSs using the UKBB and the Australian cohorts. Firstly, a PRS was calculated using the summary statistics from the same EL GWAS as above but using cases who had lived to an age above the 99th percentile for survival. Secondly, a PRS was calculated based on 330 variants associated with longevity [52], based on data from the PGS Catalog (http://www.pgscatalog.org/publication/PGP000237/). PRS scores were calculated using the PLINK (v1.9) software [53] based on the posterior effect sizes of the summary statistics generated by the PRS-CS software and reported effect sizes of the PGS catalog SNPs.
Statistical analysesAll analyses were performed using R version 4.0.0 [54]. Descriptive statistics were used to summarise and compare data across the cohorts. To achieve normality of the lipid variables, inverse normal transformations were performed using the rntransform function in the R package version 1.8–0 GenABEL (https://CRAN.R-project.org/package=GenABEL). Regressions (logistic for binary dependent variables, linear for continuous), controlling for age, sex and 10 genetic principal components (PCs) were performed to assess if the ELPRS (+ / − APOE locus) was associated with (i) the presence/absence of MetS and/or (ii) the individual components of MetS. Sex-stratified analyses were also performed in the UKBB but not in other cohorts due to smaller sample sizes.
Fixed and random effect models based on the inverse variance method were used for meta-analysis as implemented in the R package metafor [55]. The significance of the pooled odds ratio (OR) was determined by the Z-test. The I2 statistic was used to estimate the percentage of variation across the results due to study heterogeneity, rather than sampling error. No significant heterogeneity was defined as an I2 value of less than 50% and/or a p-value < 0.05.
留言 (0)