
記住我

The coronavirus disease 2019 (COVID-19), caused by the severe acute respiratory syndrome coronavirus 2, is rapidly spreading around the world.1 The number of critically ill COVID-19 patients is also increasing, leading to a serious shortage of intensive care unit (ICU) beds and ventilators.2–4 The COVID-19 pandemic has raised issues about ICU capacity and robustness and collateral damage. Many ICUs have had to seek ad hoc solutions to surge capacity problems, for example, taking care of ventilated patients outside the ICU.
The limited ICU resource has always been an ongoing problem, and for this reason, there have been many studies on ICU triage criteria.5–8 The number of patients in need of treatment in an ICU has been steadily increasing worldwide.9 Many of these patients require mechanical ventilation (MV) and are treated only in the ICU in most countries.10 A ventilator is one of the most helpful treatments for maintaining oxygenation while recovering from respiratory failure. In most countries, the number of ICU beds is insufficient, so MV is sometimes started in the general ward (GW).11–15
Previous studies reported that mortality related to MV in the GW is higher than that in the ICU.11–15 Iwashita et al12 found a higher hospital mortality (41.4% versus 38.8%, P < 0.001) and a longer duration of ventilation (11.7 versus 9.5, P < 0.001) in mechanically ventilated patients in the non-ICU setting. Hersch et al11 showed that the group who initiated MV in the medical ward had lower survival rates (20% versus 38%, P < 0.05) and higher endotracheal tube–related inadvertent events (62% versus 20%, P < 0.05). However, there was a study that showed no differences in adverse events related to ventilator use in the GW.13
There are only a few articles on ventilation conducted in the GW, and the differences in prognosis and complications of MV initiated in the GW versus the ICU are not well known. In this study, we compared the prognosis and complications between patients starting MV in the GW versus the ICU to assist clinicians in their decision making about intubation.
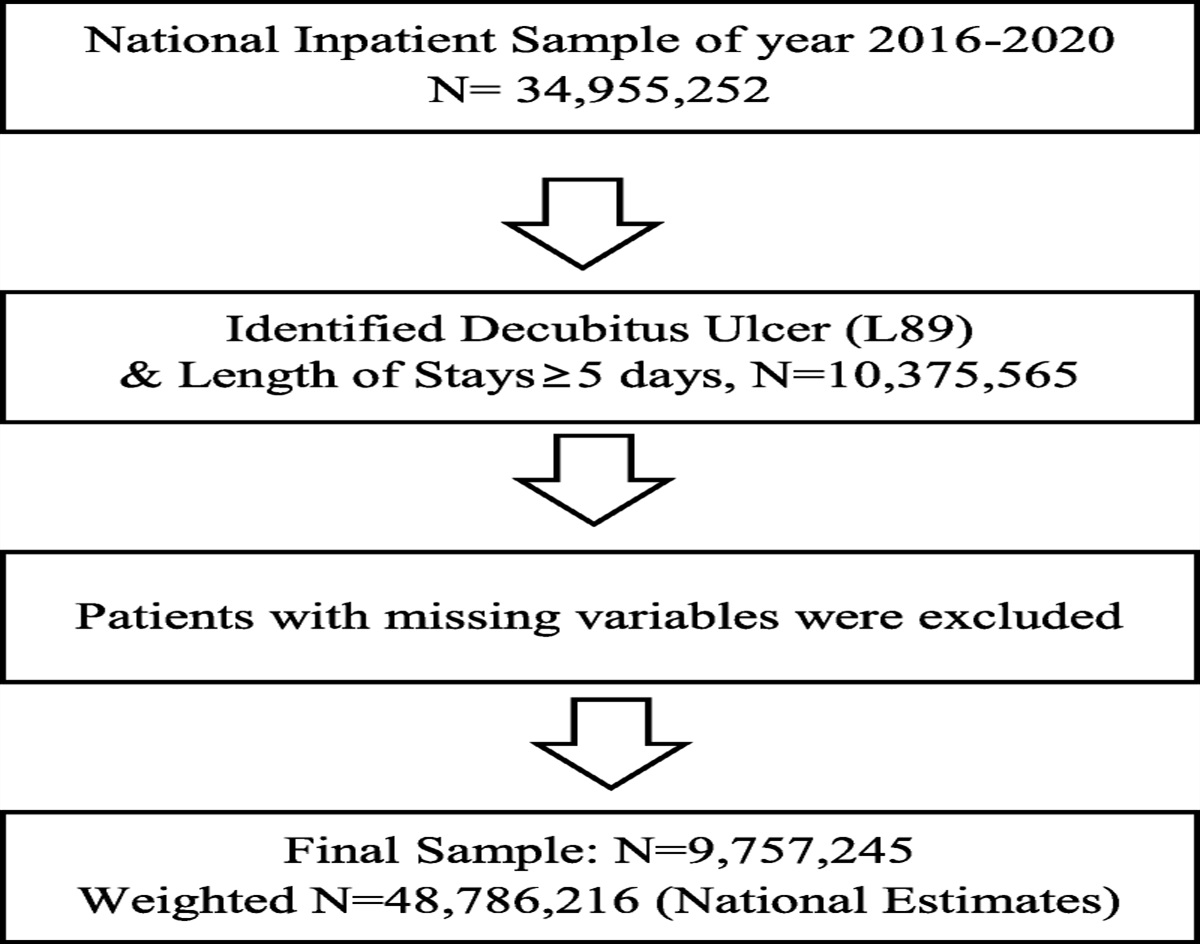
METHODS Study Design and PatientsThis retrospective single-center cohort study was conducted in a tertiary care hospital in Seoul, Korea. Patients who were screened by the rapid response team (RRT) and started MV in the GW and those who started MV in the ICU were included in this study. A total of 2223 patients were screened from January 1, 2016, to December 31, 2018. Among them, 673 patients were included, excluding patients who did not undergo MV (n = 517), patients who were started on a ventilator in the emergency department (n = 605), patients who received a ventilator 24 hours after admittance to the ICU (n = 115), and patients with a hematologic malignancy (n = 313).
There was a difference in the rate of hematologic malignancy (29.3% in the GW group versus 22.9% in the ICU group, P = 0.029) in the initial baseline characteristics, so patients with a hematologic malignancy were excluded to equalize the underlying diseases between the groups. Because the condition of the underlying disease, rather than MV itself, usually determines the prognosis, it was excluded from the analysis.16–18
Staffs on GW are composed of residents, fellows, and professors and manage only patients in the ward that belongs to their department. In the GW, oxygen therapy such as high flow nasal cannula and noninvasive ventilation and monitoring are available. The GW patient group was defined as the group of patients who started MV in the GW due to a lack of ICU beds, although they met the criteria for admission to the ICU. The ICU patient group was defined as the patients who started MV within 24 hours of admission to the ICU to compare them with the GW group, because it is thought that the GW group would have been admitted to the ICU and started MV there if the number of ICU beds was sufficient.
This study was approved by the institutional review board of Asan Medical Center (IRB no. 2019-0297), and informed consent was waived due to the retrospective nature of the study.
Rapid Response TeamWe operate an RRT named the medical emergency team (MET) at our hospital and have full-time coverage of the entire ward. The MET consists of 9 dedicated trained nurses with experience working in the critical care unit, 2 ICU residents (internal medicine second or third grade), 1 ICU fellow, and 1 ICU intensivist. These medical staffs dedicate to RRT and work in 2 shifts or 3 shifts for 24 hours a day, 7 days a week. In addition, 2 ICU staff and 3 ICU fellows working in the ICU cover some portion of night duty. The physician’ schedules change every month.19 In the GW, the MET team manages the critically ill patients with the same protocol, similar to ICU setting.
Data Collection and OutcomesAll study data were retrieved from the Electronic Medical Records (Asan Medical Information System 2.0, Seoul, Korea). Basic demographic characteristics, including sex, age, type of admission (medical, surgical) and ICU admission diagnosis, need for invasive support (MV and renal replacement therapy) and vasopressors on ICU admission and during the ICU stay, and the Acute Physiology and Chronic Health Evaluation II (APACHE II) scores were analyzed. The 28-day mortality rate was the primary outcome. Intensive care unit mortality, length of hospital stay, length of ICU stay, ventilator-free days at 28 days,20 and complications related to the ventilator (ventilator-associated pneumonia, barotrauma, unplanned extubation, airway/breathing circuit damage, gas supply issues) were collected as secondary outcomes. In the GW group, in-hospital mortality was additionally analyzed as a secondary outcome.
APACHE II scores for mortality predictions were also assessed during the first 24 hours on MV.
Statistical AnalysisAll values are expressed as the mean ± standard deviation for continuous variables or as percentages for the categorical variables. Student t test or the Mann-Whitney U test was used for continuous data, and Pearson χ2 test or Fisher exact test was used for categorical data. Survival was evaluated by Kaplan-Meier survival analysis and the log-rank test. Risk factors for mortality were analyzed using a Cox proportional hazards model with backward, stepwise elimination, and variables with P < 0.1 in the univariate analysis were entered into the multivariate models. All P values were 2-tailed, with statistical significance set at P < 0.05. All statistical analyses were performed using SPSS software (version 22.0; IBM Corporation, Somers, NY).
RESULTS Patient CharacteristicsA total of 673 patients were included in this study. Among these, 268 patients (39.8%) started MV in the GW and 405 patients (60.2%) were intubated within 24 hours after the patient was admitted to the ICU (Fig. 1). In the GW group, 35 patients (13.1%) underwent MV only in the ward. The GW group underwent MV for an average of 9.7 ± 11.2 hours in the ward. Because of clinical improvement, 11 patients underwent extubation within 48 hours of application of the ventilator, and 24 patients died within 48 hours after application of the ventilator. The ICU group underwent MV for an average of 11.9 ± 15.7 hours in the ICU. In the ICU group, 14 patients underwent ventilator weaning within 48 hours of application of the ventilator and 15 patients died within 48 hours of application of the ventilator.
 FIGURE 1:
 Patient flow chart. ER, emergency room.
There were no statistically significant differences in age, sex, APACHE II score, or underlying disease between the 2 groups (Table 1). There were no statistically significant differences in vital signs or laboratory findings before initiating the ventilator between the 2 groups (Table 1).
TABLE 1 - Baseline Characteristics of the Patients Between the GW Group and the ICU Group Total (N = 673) GW Group (n = 268) ICU Group (n = 405) P Age, y 64.2 ± 13.7 65.3 ± 13.1 63.5 ± 14.1 0.10 Male 460 (68.4) 181 (67.5) 279 (68.9) 0.712 APACHE II score 27.8 ± 9.5 27.9 ± 9.3 27.7 ± 9.6 0.85 Underlying disease Solid tumor 312 (46.4) 133 (49.6) 179 (44.2) 0.167 Chronic lung disease 152 (22.6) 63 (23.5) 89 (22.0) 0.642 Chronic heart disease 150 (22.3) 63 (23.5) 87 (21.5) 0.536 HTN 242 (36.0) 94 (35.1) 148 (36.5) 0.698 DM 195 (29.0) 88 (32.8) 107 (26.4) 0.072 Chronic liver disease 92 (13.7) 35 (13.1) 57 (14.1) 0.708 CVA 49 (7.3) 17 (6.3) 32 (7.9) 0.446 CKD 63 (9.4) 29 (10.8) 34 (8.4) 0.290 CKD on HD 43 (6.4) 19 (7.1) 24 (5.9) 0.546 Transplantation 19 (2.8) 6 (2.2) 13 (3.2) 0.457 Vital sign MBP, mm Hg 85 ± 27 86 ± 27 85 ± 27 0.708 HR, /min 108 ± 32 110 ± 30 107 ± 33 0.208 RR, /min 28 ± 11 28 ± 9 29 ± 12 0.242 BT, °C 36.0 ± 6.4 36.2 ± 6.0 35.9 ± 6.7 0.554 Spo 2, % 91 ± 10 91 ± 9 91 ± 12 0.743 Laboratory findings WBC, /mm3 13,818 ± 16,182 14,255 ± 13,514 13,521 ± 17,776 0.568 Hemoglobin, g/dL 10.1 ± 2.4 9.9 ± 2.2 10.1 ± 2.5 0.257 Platelet, 1000/mm3 181 ± 121 187 ± 123 176 ± 121 0.261 CRP, mg/dL 10.3 ± 8.9 10.6 ± 9.0 10.2 ± 8.9 0.585 ABGA pH 7.37 ± 0.14 7.36 ± 0.15 7.37 ± 0.13 0.095 pco 2, mm Hg 40.2 ± 21.0 41.7 ± 23.7 39.2 ± 18.9 0.135 P/F ratio, mm Hg 273.9 ± 186.0 262.7 ± 185.5 281.3 ± 186.2 0.206Data are presented as mean ± SD or number (%), unless otherwise indicated.
ABGA, arterial blood gas analysis; BT, body temperature; CRP, C-reactive protein; CVA, cerebral vascular accident; DM, diabetes mellitus; HD, hemodialysis; HTN, hypertension; HR, heart rate; MBP, mean blood pressure; pco2, partial pressure of carbon dioxide; P/F ratio, Pao2/Fo2 ratio; pH, power of hydrogen; RR, respiratory rate; Spo2, saturation pulse oxygen; WBC, white blood cell.
The rate of unplanned extubation (4.1% versus 1.7%, P = 0.061) showed the increased tendency in the GW patient group, but none of the complications related to the application of MV did not show any statistically significant differences (Table 2).
TABLE 2 - Complication Rates of Mechanical Ventilators and Outcomes Total (N = 673) GW Group (n = 268) ICU Group (n = 405) P Ventilator-associated complication Ventilator-associated pneumonia 2 (0.3) 0 (0) 2 (0.5) 0.249 Barotrauma 10 (1.5) 4 (1.5) 6 (1.5) 0.991 Unplanned extubation 18 (2.7) 11 (4.1) 7 (1.7) 0.061 Outcomes 28-Day mortality 183 (27.2) 73 (27.2) 110 (27.2) 0.997 ICU mortality 304 (45.2) 126 (47.0) 178 (44.0) 0.434 ICU LOS, d 13.9 ± 18.2 15.3 ± 20.4 13.1 ± 16.6 0.129 Hospital LOS, d 48.5 ± 65.9 47.3 ± 55.5 49.2 ± 72.1 0.706 Ventilator-free days 17.8 ± 8.8 17.6 ± 8.8 17.9 ± 8.8 0.660Data are presented as mean ± standard deviation or number (%), unless otherwise indicated.
In the GW group, 28-day mortality was not significantly different from the ICU group (27.2% versus 27.2%, P = 0.997; Fig. 2). There was no difference in ICU mortality between the 2 groups (47.0% versus 44.0%, P = 0.434), and the ICU length of stay (LOS), hospital LOS, and ventilator-free days did not show any statistically significant differences (Table 2).
 FIGURE 2:
 Kaplan-Meier curves of 28-day mortality in patients.
Risk Factors for 28-Day MortalityThe results of a Cox proportional hazards analysis of factors associated with the 28-day mortality are shown in Table 3. After adjusting for confounders, independent predictors of 28-day mortality included the APACHE II score (odds ratio [OR], 1.058; 95% confidence interval [CI], 1.039–1.076; P < 0.001); solid tumor (OR, 1.876; 95% CI, 1.342–2.624; P < 0.001); chronic kidney disease (CKD; OR, 0.418; 95% CI, 0.193–0.906; P = 0.027) and platelet count (OR, 0.998; 95% CI, 0.996–1.000; P = 0.009). Ventilator initiation in the GW was not a statistically significant risk factor.
TABLE 3 - Risk Factors for 28-Day Mortality Assessed Using a Cox Proportional Hazards Model Univariate Analysis Multivariate Analysis OR 95% CI P OR 95% CI P Age 1.003 0.992–1.014 0.597 Male 1.105 0.813–1.502 0.525 APACHE II score 1.062 1.045–1.079 <0.001 1.058 1.039–1.076 <0.001 Underlying disease Solid tumor 1.899 1.413–2.551 <0.001 1.876 1.342–2.624 <0.001 Chronic lung disease 0.532 0.351–0.806 0.003 0.915 0.575–1.456 0.707 Chronic heart disease 0.698 0.477–1.022 0.065 0.894 0.570–1.404 0.627 Chronic liver disease 1.375 0.935–2.024 0.106 DM 0.986 0.715–1.359 0.930 CKD 0.455 0.233–0.889 0.021 0.418 0.193–0.906 0.027 CVA 0.541 0.266–1.099 0.090 0.520 0.243–1.114 0.093 Transplantation 0.342 0.085–1.380 0.132 Laboratory findings WBC 1.000 1.000–1.000 0.004 1.000 1.000–1.000 0.021 Platelet 0.997 0.996–0.998 <0.001 0.998 0.996–1.000 0.009 CRP 1.014 0.998–1.031 0.095 1.009 0.992–1.026 0.327 P/F ratio 1.000 0.999–1.001 0.619 Vital sign MBP 0.992 0.987–0.997 0.003 0.997 0.991–1.003 0.346 HR 1.004 0.999–1.009 0.117 RR 1.008 0.994–1.022 0.245 Ventilator start in GW 1.001 0.744–1.345 0.997 Ventilator-associated complication 0.682 0.302–1.538 0.356CRP, C-reactive protein; CVA, cerebrovascular accident; DM, diabetes mellitus; HR, heart rate; MBP, mean blood pressure; RR, respiratory rate; WBC, white blood cell; P/F ratio, Pao2/Fio2 ratio.
The results of a Cox proportional hazards analysis of factors associated with the in-hospital mortality are shown in Table 4. After adjusting for confounders, independent predictors of in-hospital mortality included the APACHE II score (OR, 1.040; 95% CI, 1.017–1.063; P < 0.001); solid tumor (OR, 1.930; 95% CI, 1.345–2.769; P < 0.001), cerebral vascular accident (OR, 0.299; 95% CI, 0.109–0.823; P = 0.019); mean blood pressure (OR, 0.990; 95% CI, 0.981–0.998; P = 0.019), and heart rate (OR, 1.009; 95% CI, 1.002–1.016; P = 0.014). Transfer to the ICU was not a statistically significant risk factor.
TABLE 4 - Risk Factors for In-Hospital Mortality in GW Group Patients Assessed Using a Cox Proportional Hazards Model Univariate Analysis Multivariate Analysis OR 95% CI P OR 95% CI P Age 0.996 0.984–1.008 0.496 Male 1.344 0.955–1.892 0.090 1.395 0.967–2.011 0.075 APACHE II score 1.026 1.006–1.047 0.012 1.040 1.017–1.063 <0.001 Underlying disease Solid tumor 1.930 1.373–2.714 <0.001 1.930 1.345–2.769 <0.001 Chronic lung disease 0.641 0.423–0.971 0.036 1.019 0.638–1.627 0.937 Chronic heart disease 0.533 0.345–0.823 0.005 0.728 0.451–1.174 0.193 Chronic liver disease 0.732 0.428–1.251 0.254 DM 0.786 0.547–1.129 0.192 CKD 0.782 0.449–1.361 0.384 CVA 0.326 0.120–0.882 0.027 0.299 0.109–0.823 0.019 Transplantation 0.236 0.033–1.689 0.150 Laboratory findings WBC 1.000 1.000–1.000 0.088 1.000 1.000–1.000 0.153 Platelet 0.999 0.997–1.000 0.050 1.000 0.998–1.001 0.577 CRP 0.998 0.978–1.019 0.844 P/F ratio 1.001 1.000–1.002 0.127 Vital sign MBP 0.994 0.988–1.001 0.083 0.990 0.981–0.998 0.019 HR 1.005 0.999–1.012 0.087 1.009 1.002–1.016 0.014 RR 0.996 0.978–1.014 0.684 Ventilator-associated complication 1.160 0.589–2.285 0.667 Transfer to ICU 0.582 0.372–0.911 0.018 0.695 0.399–1.208 0.197CRP, C-reactive protein; CVA, cerebrovascular accident; DM, diabetes mellitus; HR, heart rate; MBP, mean blood pressure; RR, respiratory rate; WBC, white blood cell; P/F ratio, Pao2/Fio2 ratio.
In this study, 39.8% of the patients requiring intubation and MV started in the ward, and monitoring was performed in the GW for an average of 9.7 ± 11.2 hours before admittance to the ICU, but there was no difference in 28-day mortality (27.2% versus 27.2%, P = 0.997) or ICU mortality (47.0% versus 44.0%, P = 0.434). Unplanned extubation was slightly higher in the GW group, but it was not statistically significant. High APACHE II score, presence of solid tumor, absence of CKD, and low platelet count were associated with an increase in 28-day mortality, but ventilator initiation in the GW did not show statistically significant values for 28-day mortality.
In this study, patient age, sex, underlying disease, laboratory data, and vital signs did not show any differences at baseline. However, Iwashita et al12 reported that the percentage of men was lower (60.2% versus 61.3%, P = 0.025) and the age was older (72.8 versus 70.1 y, P < 0.001) in the non-ICU group. In the study by Iwashita et al,12 quasi-ICU and GW were analyzed in a non-ICU setting. In this study, only GW was included without quasi-ICU, so this might explain why the patient characteristics are different. In addition, Hersch et al11 showed that age (75 ± 13 versus 67 ± 20 y; P < 0.05) was older, and the APACHE II score was higher (27 ± 7 versus 24 ± 7, P < 0.05) in the wards group than in the ICU group. In the study by Hersch et al,11 MV was divided into the ward-only group and the ICU group, but in our study, the ward-started group and the ICU-started group were divided, so this difference in study design would affect the results. Most of the studies on MV and its application in the ward were conducted in a ward alone group or in quasi-ICU, or a group not admitted to the ICU was compared with a group admitted to the ICU. In the study by Iwashita et al,12 patients with a current history of cancer were excluded. In the study by Wongsurakiat et al,15 an attending physician who was not skilled in critical care took care of the patients in the general medical ward without the assistance of specialized personnel, such as a respiratory therapist. In the study by Hersch et al,11 the underlying disease was not analyzed, and the ventilators in the ward were applied by the attending physician with minimal critical care training without assistance from a respiratory therapist or RRT due to a lack of manpower. The study by Tang et al14 included only patients who were managed by the medical respiratory team in the general medical wards. However, in our study, RRT screens and manages all patients in the GW. The RRT consists of 9 trained nurses with experience working in the critical care unit, 2 ICU residents (internal medicine second or third grade), 1 ICU fellow, and 1 ICU intensivist. These medical staffs dedicate to RRT and work in 2 or 3 shifts for 24 hours a day, 7 days a week. The RRT manages the ventilated patients in the GW independently, similar to ICU setting. In addition, there have been no prior cases of classification based on the place where the ventilator was started, as in this study.
In this study, safety complications related to MV indicated a slightly higher rate of unplanned extubation in the ward group, but it was not statistically significant. Tang et al
留言 (0)