
記住我

Physicians’ work hours are a topic of a growing debate, culminating in national guidelines and legislation on duty hour restrictions.1 Specifically, the long hours required during residency years are an issue of public discussion because of their harmful potential consequences in the form of medical error (ME). Medical error causes tens of thousands deaths a year2–4 as the third leading cause of death in the United States.5 A recent meta-analysis revealed that 5% of patients are exposed to preventable harm in medical care.6 In Europe, the numbers reveal that ME occurs in 8% to 12% of hospitalizations. Patient harm during health care is a globally leading cause of morbidity and mortality7,8; thus, implementing strategies aimed to reduce the rate of ME would save approximately 100,000 lives annually.5 Unfortunately, although ME should be a problem worthy of greater resources allocation, there is still scarcity of research on resident’s work schedules and preventable adverse events.9–11 Moreover, MEs go unreported12 because many physicians are wary to report it13 and experience a professional and personal disruption after an error.14
During residency years, there is a potential for fatigue impairment, with work schedule as a significant factor.15 According to Landrigan et al,16 intensive care unit (ICU) residents made more serious ME that caused harm or has the potential to cause harm, under extended shifts schedule compared with reduced work hours/week. It was found that residents working extended shifts had more polysomnographic-recorded attentional failures during work hours17; nevertheless, the trial was not large enough to determine whether shift duration affects attention in a way that increases the risk for adverse event occurrence. In a larger study of U.S. residents, Barger et al18 reported a positive association between extended shifts and attentional failures, ME, and adverse events. However, data relied on self-reports not independently validated.
Cognitive function may be the linking factor between schedule-related fatigue and potential ME. Evidence suggests that fatigue, sleep duration, and low alertness has a role in modifying cognitive function (e.g., working memory, attention, and behavioral performance).6,19–21 Specifically, vigilant attention is impaired by sleep deprivation and restored after rest breaks and more so after sleep.22 Moreover, sleep disorders are manifested in the performance on the Test of Variables of Attention (TOVA), suitable for evaluating speed and accuracy23 of sustained attention based on processing speed,24 vigilance, and impulsivity.25 For example, TOVA scores are in the abnormal range in 63%26 of patients with sleep apnea syndrome; also, children with both sleep apnea and attention-deficit/hyperactivity disorder (ADHD) were found to suffer from worse27 performance on the TOVA preadenotonsillectomy. The TOVA response time (RT) was significantly worse in patients with both ADHD and sleep disorders than those without them.28 Furthermore, a delayed circadian rhythm disorder is prevalent in more than 70%29,30 of both children and adults with attention disorder. In view of that, fatigue and sleep deprivation are exhibited as attention impairment and vice versa.
We aim to further investigate the adverse effects of workload fatigue on physicians’ attention functioning by the valid traditionally used TOVA. Assuming that ME occurs on the account of attention failures, we aim to provide an objective attention evaluation in a large sample of hospital residents from different residencies following sleep deprivation due to work overload. Interestingly, a recent study intended to provide a national database of the prevalence burnout among physicians surveyed more than a thousand physicians from different residency programs to find that burnout was high across all fields, with gynecology and internal medicine at the top and psychiatry at the bottom.31 Nevertheless, only the administrators of the programs were evaluated, and the inventory lacked validity for the study population. Accordingly, we aim (1) to test if induced fatigue (24-hour shift) is manifested in attention performance and (2) to compare attention performance according to the field of residency. Thus, we hypothesize that a sleep deprivation due to workload will impair the physicians’ attention in association with their residency field.
METHODS SubjectsThe study was conducted in the Emek Medical Center (Afula, Israel) and approved by the local institutional review board. Data were collected anonymously and to fulfill the institutional review board’s requirements. The study included 109 residents sampled randomly and equally among males and females. Participants belonged to the following medical residency fields: internal medicine, gynecology, anesthesia, surgery, ICU, or psychiatry. Note that the ICU residents were in a full-time ICU residency.
Exclusion criteria were as follows: diagnosed ADHD or sleep disorder, active psychiatric or neurological disease, pregnancy, time spent within 1 month in a destination with more than 2 hours of time zone difference, and regular use of sedative, stimulant, anxiolytic, and/or antidepressant medications. Diagnoses were based on self-reports.
ProcedureResidents were tested twice using the TOVA right before they started a 24-hour shift (8:00 am) and right at the end of their shift (8:00 am on the next day). The shift content differed across the residency fields, as follows: the internal medicine residents treat 10 to 12 patients in the ward, mostly for infections, pneumonia, urinary infection, heart failure, myocardial infection, and acute renal failure. Anamnesis and physical check take ~1 hour per patient (including documentation). The gynecology residents treat about 13 patients in women’s emergency department in addition to the patients they have in the delivery rooms and in the ward. They are responsible for the emergency checks (~20 minutes each), vacuum extractions, and surgical procedures (cesarean delivery, exams under full anesthesia, and internal bleeding), which take ~1 hour each. The anesthesia residents treat an extremely high number of patients and work mostly in operating rooms with no rest periods at all. There are 1 attending physician and 2 on-call residents with a variety of responsibilities such as epidural injections, insertion of complex zondas, shock room care, and even chaperoning head trauma patients to get treatment in different hospitals as well as help with other emergency cases that occur on their way back. The surgery residents are working 3 per shift, one in the emergency department that treats 50 to 100 cases including trauma and abdominal pain, another one in the ward that treats 20 to 40 cases including patients before and after operation, and one more who performs about 5 surgical procedures of bowel obstruction, exploratory laparotomy, abscess, and appendectomy, which take 1 to 3 hours each. The ICU residents treat about 20 patients (who are mostly hospitalized) while spending ~3 hours for severe cases (trauma, car accidents, sepsis, cardiac events, snake bites) versus 2 hours for mild cases (abdominal pain, urinary infection, minor bruises). They juggle between patients while waiting to receive their laboratory and imaging results. Finally, the psychiatry residents treat 8 to 10 patients, ~1 hour per patient, including 2 cases of involuntary/voluntary hospitalizations, 2 cases of suicide attempts, and 1 to 2 cases of psychosis and addictions. They also give counseling in the pediatric ward for children with anxiety attacks, suicidal alerts, and behavioral disorders.
Caffeine and nicotine were not allowed at least 1 hour before testing. All subjects reported normal sleep duration the night before the study and a normal shift workload. Consumption of caffeine (cups) and nicotine (cigarettes) was monitored to address possible confounding effects.32 Residents were asked to record any significant resting periods (sitting/lying down).
Test of Variables of AttentionWe used V8.0 TOVA normalized by age and sex. In a 20-minute session, a flashing large square is presented for 100 milliseconds with a 2-second intertrial interval. Target and nontarget stimuli are defined as the appearance of a small box on the top or bottom of the large square, respectively. Subjects were instructed to press a microswitch every time the target appears and to avoid pressing every time a nontarget appears. Accordingly, the following variables were evaluated:
RT: time required pressing the microswitch after presented with the target, that is, the processing time taken to respond correctly. Persons with ADHD may respond slower.23 RT variability: consistency level of RTs, that is, the standard deviation of correct response times. Individuals with ADHD tend to have inconsistent RT and thus have a wider RT variability. This is considered the most sensitive measure for attention deficit.23,33 D-prime: ability of perceptual sensitivity to discriminate between target and nontarget stimuli (i.e., the ratio of hit rate to false alarm rate). Most individuals tend to experience fatigue over time; yet, with ADHD, the performance tends to deteriorate faster.23 Omissions: a measure of focus and vigilance and occur when the subject omits clicking the microswitch in response to a target stimulus presented; this may be due to inattention, distractibility, or hyperactivity. Omission errors are rare in adults.23 Commissions: a hallmark of ADHD that measures impulsivity and occur when the subject incorrectly clicks the microswitch in response to the nontarget stimulus presented. Generally, at the individual level, excessive commission errors decrease omission errors, shorten RTs, and increase variability; therefore, it is an important measure of test validity.23 Attention comparison score: It measures overall attention performance, which compares the performance with individuals who have been independently diagnosed with ADHD.23Scores are presented as standard scores (SSs) and categorized as follows: SSs >110 are above average, SSs of 85 to 110 are average, SSs of 80–85 are considered borderline; and SSs <80 are not within normal limits. For attention comparison score, score <0 was considered below the normal range.
Statistical AnalysisVariables were first tested for normal distribution using skewness and kurtosis statistics. A 2-way analysis of variance for mixed design with residency fields as between-subject factor and test time as within-subject factor was performed. One-way analysis of variance followed by post hoc Tukey tests was used to compare differences between residencies. A paired-sample t test was used to compare performance at baseline and after a 24-hour shift. Associations between variables were calculated using Pearson correlation coefficient. The statistical tests were conducted using Bonferroni-adjusted α levels, and results were considered significant if P value <0.05. Results are displayed as mean ± SEM, unless otherwise specified.
RESULTS Demographics, Sleep Duration, and Nicotine and Caffeine IntakeAs expected, age was negatively correlated with attention performance. The variables found to be moderately correlated with age were as follows: omissions at baseline and after 24 hours (r63 = −0.495, −0.499; P < 0.000); commissions at baseline and after 24 hours (r63 = −0.399, P < 0.001; r63 = −0.523, P < 0.000); D-prime at baseline (r63 = −0.438, P < 0.000); and attention comparison score at baseline (r63 = −0.402, P < 0.001). The variables found to be weakly correlated with age were as follows: RT at baseline and after 24 hours (r63 = −0.365, P < 0.003; r63 = −0.362, P < 0.004); D-prime after 24 hours (r63 = −0.302, P > 0.016); and attention comparison score after 24 hours (r63 = −0.248, P < 0.050). Merely RT variability, the variable most sensitive to attention deficit, did not correlate with age.
All residents had rested for no more than 45 minutes; rest time did not correlate with any of the examined attention variables. The anesthesia residents rested for significantly longer time compared with all other residents (F5,108 = 7.216, P < 0.001; η2 = 0.259).
Caffeine was tested for covariance and was found to have no effect over the attention variables. Internal medicine residents consumed most cups, whereas psychiatry residents consumed the least number of cups (F5,108 = 7.439, P < 0.001; η2 = 0.265).
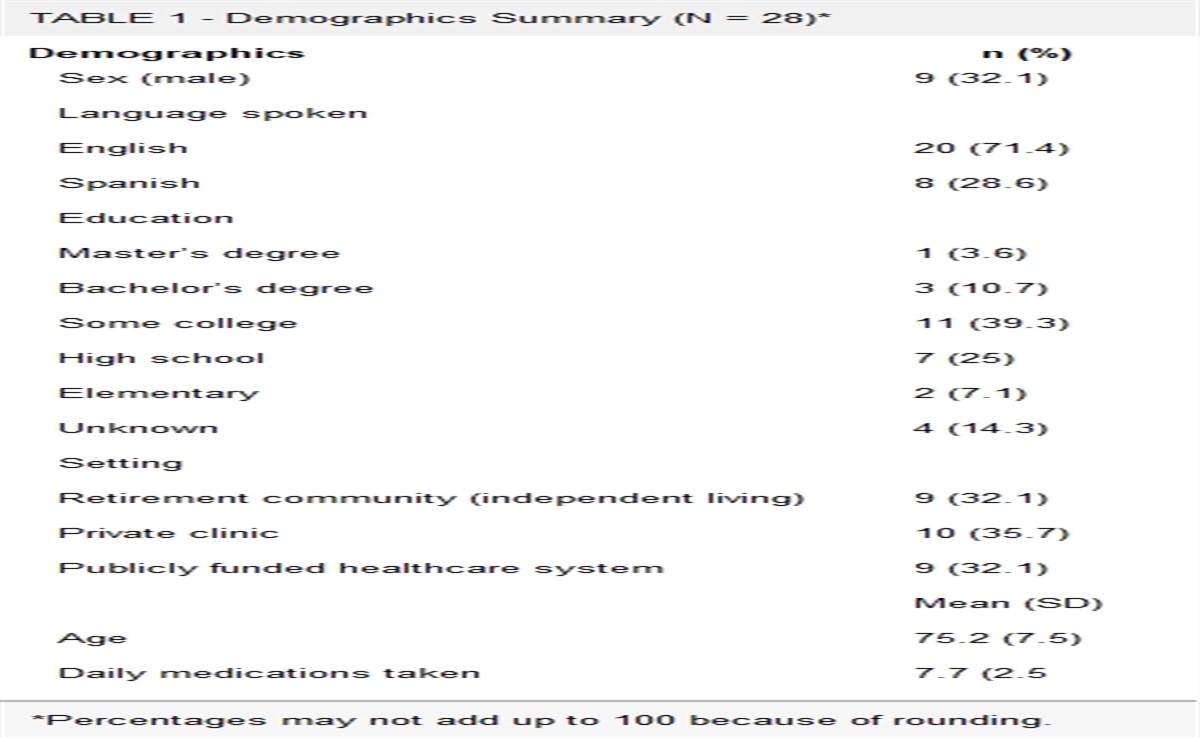
Cigarette smoking was not normally distributed and thus described by median and range (Table 1).
TABLE 1 - Demographics, Rest Duration, and Nicotine and Caffeine Intake Residency Fields Internal (n = 31) Gynecology (n = 16) Anesthesia (n = 16) Surgery (n = 16) ICU (n = 16) Psychiatry (n = 14) Total (N = 109) Age, y 32.54 ± 6.44 33.85 ± 3.23 39.71 ± 7.54 35.25 ± 4.78 41.4 ± 9.71 33.66 ± 6.20 34.52 ± 6.91 Relative percentage, % 28.44 14.67 14.67 14.67 14.67 12.84 100 Rest duration (min) 9.67 ± 14.17 6.25 ± 9.74 21.25* ± 8.42 10.5 ± 10.00 0 9.28 ± 8.51 9.52 ± 11.70 Nicotine consumption, no. cigarettes 0.64 ± 1.56 1.06 ± 2.23 1.43 ± 2.09 0 0.62 ± 1.25 0 0.64 ± 1.56 Caffeine consumption, no. cups 5.93* ± 4.01 4.56 ± 2.50 3.12 ± 1.99 2.93 ± 1.34 5.81 ± 4.23 0.78 ± 1.25 4.2 ± 3.46Data are presented as average ± SD. Nicotine and caffeine consumptions are presented as median (range).
* P < 0.05.
To quantify the extent of impairment, we calculated the frequency of subjects with borderline-impaired scores, based on SS <80. At baseline, although 37% of physicians had SS not within the normal range in omissions, 14% in attention comparison score, 13% in D-prime, and 6% in RT variability; all of them had normal baseline SS in commissions and RT. After 24 hours, the impaired performance percent increased in all the variables but commissions and RT, which remained within the normal range among all physicians. The impairment percent change was most pronounced in attention comparison score (+20%) and RT variability (+16%) after 24 hours (Table 2).
TABLE 2 - TOVA Variable Impairment Before and After a Shift Across Residency Fields Residency Fields Internal (n = 31) Gynecology (n = 16) Anesthesia (n = 16) Surgery (n = 16) ICU (n = 16) Psychiatry (n = 14) Total (N = 109) % Omission rate Baseline 7 4 7 9 13 0 40 36.7 Post 24 h 12 7 8 13 6 0 46 42.2 Commission rate Baseline 0 0 0 0 0 0 0 0.0 Post 24 h 0 0 0 0 0 0 0 0.0 RT Baseline 0 0 0 0 0 0 0 0.0 Post 24 h 0 0 0 0 0 0 0 0.0 RT variability Baseline 6 0 0 0 0 0 6 5.5 Post 24 h 12 5 6 0 0 0 23 21.1 D-prime Baseline 4 1 0 1 8 0 14 12.8 Post 24 h 10 1 0 6 5 0 22 20.2 Attention comparison score Baseline 7 3 0 1 4 0 15 13.8 Post 24 h 14 6 6 6 5 0 37 33.9The number of physicians who performed not within the normal range before and after a 24-hour shift across the TOVA variables. All variables, but RT and CO, increased after 24 hours, with the RT variability and attention comparison score being most affected. Impairment was considered as any SS <80 (<0 for attention comparison score). Data are presented using frequency and percent.
Results revealed a significant deterioration after the shift across all variables (P < 0.001), as demonstrated by the aforementioned increasing percentage of subjects with impaired performance. Notably in most variables, the decline in performance was not merely statistical but clinical as it reached the verge of borderline-abnormal spectrum (RT variability and D-prime, attention comparison score, and omissions, respectively; Table 3). Surprisingly, 8 of all physicians were found to have abnormal baseline performance in at least 3 variables. Because ADHD diagnosis cannot be made solely based on TOVA, henceforth, these subjects are referred to as the “ADHD-like group.”
TABLE 3 - TOVA Variables Before and After a Shift Variables (SS) Baseline Post 24 h P Omission rate 85.53 ± 20.30 78.88 ± 20.06 0.0001 Commission rate 113.96 ± 5.61 108.81 ± 7.14 0.0001 RT 115.62 ± 6.06 113.53 ± 7.09 0.0001 RT variability 101.44 ± 4.01 89.59 ± 13.48 0.0001 D-prime 99.25 ± 15.26 89.19 ± 15.51 0.0001 Attention comparison score 0.82 ± 2.96 −1.35 ± 2.74 0.0001The scores of all the TOVA variables significantly decreased after 24 hours. Impairment was considered as any variable with SS <85 (<0 for attention comparison score) and accentuated in bold. Data are presented as average ± SD.
The ICU had the worst baseline SS (internal medicine and psychiatry, P < 0.0001; gynecology, P < 0.001; anesthesia, P < 0.013; surgery, P < 0.042). Psychiatry remained with significantly better SS than surgery (P < 0.006) and ICU (P < 0.017) after 24 hours. Post hoc analysis revealed impairment among internal medicine (P < 0.0001), gynecology (P < 0.001), anesthesia (P < 0.0001), surgery (P < 0.016), and psychiatry (P < 0.0001), but no effect for the ICU, which showed a tendency of improvement within the abnormal range (Fig. 1A).
 FIGURE 1:
 Variables of TOVA before and after a shift across residency fields. A–F, Valued in SSs. B and D, CO-SS and RTV-SS significantly decreased in all residencies. A, E, and F, OM-SS, D-prime–SS, and ACS significantly decreased in all residencies but the ICU. C, RT-SS significantly decreased in all residencies but the ICU and psychiatry. The decrease in RTV-SS, OM-SS, D-prime–SS, and ACS exceeded the normal range for some residencies. Data are presented as average ± SD; SSs of 80–85 are considered borderline, and SSs <80 are not within normal limits (<0 for ACS). *P < 0.05, **P < 0.01, ***P < 0.001. ACS, attention comparison score; CO, commissions; OM, omissions; RTV, RT variability.
CommissionPsychiatry had the best baseline SS (internal medicine, P < 0.01; gynecology, anesthesia, and ICU, P < 0.0001; surgery, P < 0.008) and the lowest decline rate after 24 hours, and had significantly better SS than gynecology (P < 0.002) and ICU (P < 0.001). Furthermore, anesthesia had the greatest SS decline and significantly lower SS than internal medicine (P < 0.001), surgery (P < 0.011), and psychiatry (P < 0.0001). Post hoc analysis revealed impairment among all residencies (P < 0.0001), including the ICU (P < 0.01; Fig. 1B).
Response TimePsychiatry exhibited the best baseline SS (i.e., shorter RT) compared with ICU (P < 0.019) as well as after 24 hours compared with all residencies (internal medicine, surgery, and ICU, P < 0.0001; gynecology, P < 0.035; anesthesia, P < 0.016). Post hoc analysis revealed impairment among internal medicine (P < 0.002), gynecology (P < 0.0001), anesthesia (P < 0.0001), and surgery (P < 0.001), but not psychiatry and ICU (Fig. 1C).
RT VariabilitySurgery and psychiatry baseline SSs were higher compared with internal medicine (P < 0.0001, P < 0.003), gynecology (P < 0.001, P < 0.035), anesthesia (P < 0.0001, P < 0.008), and ICU (P < 0.001, P < 0.043). Post hoc analysis revealed a significant impairment among all residencies (internal medicine, P < 0.0001; gynecology, P < 0.0001; anesthesia, P < 0.0001; surgery, P < 0.0001; psychiatry, P < 0.008; and ICU, P < 0.0001). However, after 24 hours, surgery, ICU, and psychiatry scored within the normal range compared with internal medicine (P < 0.011) and anesthesia (P < 0.015) whose performances were below the normal range. Psychiatry had significantly better SS than internal medicine, gynecology, anesthesia (P < 0.0001), and ICU (P < 0.022; Fig. 1D).
D-PrimeThe ICU had the lowest baseline SS compared with internal medicine (P < 0.004), anesthesia (P < 0.008), and psychiatry (P < 0.0001). After 24 hours, Psychiatry values were higher than internal medicine (P < 0.001), surgery (P < 0.014), and ICU (P < 0.014). Post hoc analysis discovered impairment among internal medicine (P < 0.0001), gynecology (P < 0.0001), anesthesia (P < 0.0001), surgery (P < 0.002), and psychiatry (P < 0.0001), but not ICU (P > 0.714; Fig. 1E).
Attention Comparison ScoreThe ICU had the lowest baseline score compared with surgery (P < 0.008) and psychiatry (P < 0.0001) whose scores were below the normal range, and psychiatry had the highest score compared with ICU (P < 0.0001) and internal medicine (P < 0.046). After 24 hours, psychiatry remained with the highest score compared with all other residencies (P < 0.001) and was the only residency that remained within the normal range. Post hoc analysis exposed a significant impairment among internal medicine (P < 0.0001), gynecology (P < 0.0001), anesthesia (P < 0.0001), surgery (P < 0.0001), and psychiatry (P < 0.003), but not ICU (P > 0.443; Fig. 1F).
In summary, excluding the ICU, a significant decrease was observed in omissions (F1,103 = 18.300, P < 0.001), D-prime (F1,103 = 50.5, P < 0.001), and attention comparison score (F1,103 = 127.803, P < 0.001). Excluding the ICU and psychiatry, a significant reduction was detected in RT (F1,103 = 18.429, P < 0.001). All residencies decreased their commissions (F1,103 = 211.363, P < 0.001) and RT variability (F1,103 = 208.528, P < 0.001), with merely surgery, ICU, and psychiatry residents scored within the normal range. Notably, the ICU had an abnormal baseline to begin with (Fig. 1).
ADHD-Like GroupA small group of 8 physicians (7.34%) shared impaired baseline performance, defined as SS <85 in at least 3 variables, compared with the rest who performed in the normal range across all variables. The group had abnormal values in omissions-SS, D-prime–SS, and attention comparison score and included 2 ICU, 1 surgery, and 5 internal medicine residents. Interestingly, this group was less affected by lack of sleep compared with residents within the normal range, and significantly deteriorated only in RT variability (P < 0.001), which is considered the most sensitive for attention deficit.33 The normal baseline group significantly deteriorated in all SSs (P < 0.0001; Table 4).
TABLE 4 - ADHD-Like Group Versus the Normal Performance Group Across TOVA Parameters Variables (SS) Baseline Post 24 h P Normal baseline Omission rate 88.12 ± 18.63 80.84 ± 18.97 0.0001 Commission rate 114.08 ± 5.30 108.77 ± 6.87 0.0001 RT 115.94 ± 5.82 113.66 ± 6.86 0.0001 RT variability 101.63 ± 14.58 89.77 ± 13.58 0.0001 D-prime 101.25 ± 13.50 90.24 ± 14.89 0.0001 Attention comparison score 0.96 ± 2.84 −1.33 ± 2.79 0.0001 ADHD-like group Omission rate 52.88 ± 9.31 54.13 ± 17.71 0.859 Commission rate 112.5 ± 9.05 109.25 ± 10.66 0.084 RT 111.63 ± 7.99 111.88 ± 9.99 0.929 RT variability 99 ± 16.80 87.25 ± 12.75 0.001 D-prime 74 ± 14.16 76 ± 18.19 0.597 Attention comparison score −0.89 ± 4.02 −1.59 ± 2.20 ± 0.575The ADHD-like group decreased significantly merely in the RT variability after 24 hours. Impairment was considered as any variable with SS <85 (<0 for attention comparison score) and accentuated in bold. Data are presented as average ± SD.
The study’s main aim was to objectively evaluate the effects of sleep deprivation due to work overload on attention performance in a large sample of residents. The TOVA results confirmed the adverse effects of work overload–induced fatigue on visual attention functioning. The impact of a 24-hour shift was most pronounced, to varying degrees, in some of the TOVA variables (e.g., the attention comparison score, RT variability, and D-prime), while being inconsistent in others (e.g., RT and commissions). Specifically, the attention comparison score declined to abnormal range, and the RT variability and D-prime dropped to borderline scores. Accordingly, the increased numbers of subjects with impaired performance were highest in those variables (25% in RT variability, 20% in attention comparison score, and 15% in D-prime). Notably, the borderline omission score at baseline switched to abnormal values after the shift. This deterioration profile observed among the residents carries clinical implications, as it was seen in all variables, excluding RT and commissions, thus indicating deficient attention functioning characterized by inattentiveness and lack of perceptual sensitivity but preserved processing speed and inhibition control (i.e., impulsivity) after an extended shift.23 Previous studies showed deterioration in psychomotor vigilance performance tasks34 and in recall memory and concentration35 after an extended shift. In accordance, residents made significantly less momentous errors during an intervention schedule that eliminated extended work shifts.16 Longer sleep deprivation induced by a 36-hour on-call shift negatively affected obstetrical resident physicians’ cognitive performance as manifested in all the TOVA variables.36
Our second aim was to test for differences in attention performance across various residencies. We found that the extended shift led to a differential degree of attentional failure as a function of the residency field. After a night shift, residents from all fields, excluding psychiatry, exhibited circumstantial ADHD-like symptomology, which resembled a profile of individuals with attention disorder. Accordingly, although, after their shift, psychiatrists remained within the normal range, residents from other fields showed pathological impairment in at least 2 variables, indicating clinical differences between the residency fields. For example, the psychiatrist is situated in a designated room and the patients approaches this room; thus, the psychiatrist is required to have less physical movement compared with all other residencies.
Generally, there are 2 types of errors: omissions occurring as a result of actions not taken (inattentiveness) versus commissions occurring as a result of the wrong action taken (impulsivity). After their shift, internal medicine, gynecology, and surgery residents tended to behave as those suffering from “ADHD predominantly inattentive,” as their impaired functions were inattention and processing speed, but not inhibition. Furthermore, the scores of the internal medicine, anesthesia, and gynecology did not merely decline but crossed to the abnormal range of the RT variability, which is a stable feature of attention disorder.37 Clinically, it could mean that these residents are not more impulsive at the end of their shift, but rather act slower and less attentive, which could lead to severe preventable
留言 (0)