Sampling
UAFT and AFT were samples collected at the beginning and at two years of the spontaneous aging, separately. Samples were collected using a five-point method from six different containers, at China Tobacco Si Chuan industrial Co, Ltd (Chendu County, Sichuan Province, China), as shown in Fig. A5. Finally, the samples were frozen immediately in liquid nitrogen and stored at -80 °C.
Profiling DCs between UAFT and AFT
The non-volatile and volatile components of FT were comprehensively determined with the non-targeted metabolomics based on UPLC-QTOP-MS, GC–MS assisted derivatization and HP-SPME-GC/MS platform. Before measurement, samples were ground for 90 s under 60 Hz by TL- 48R grinder (TL-48R, Jingxin, ShangHai, China).
UPLC-QTOP-MS analysis
A 0.05 ± 0.01 mg of the samples powder was extracted with 1 mL of single-phase solvent (acetonitrile-methanol–water, 2:2:1, 1 μg·mL−1 2-Chloros-L-phenylalanine as an internal standard, ≥ 98%, Sigma-Aldrich). The samples were vortexed for 30 s, sonicated for 5 min in an ice-water bath, incubated at -20 °C for 1 h, and centrifuged at 4 °C and 10,000 × g for 15 min. The resulting supernatants were gathered into vials for analysis.
Non-volatile components were analyzed with an UHPLC system (1290-Agilent Technologies) coupled with a UPLC HSS T3 column (2.1 mm × 100 mm, 1.8 um, Waters) and Q Exactive mass spectrometer (QE MS, Orbitrap MS, Thermo Fisher Scientific). The gradient elution was performed using a mobile phase A and phase B (acetonitrile, LC–MS grade, CNW Technologies). The phase A was respectively 0.1% v/v formic acid solution and 5 mmol·L−1 ammonium acetate solution in positive (POS) and negative (NEG) ion mode (LC–MS grade, CNW Technologies). With 2 μL injection volume, the flow rate of mobile phase was 0.5 mL·min−1, and the elution gradient was programmed as follows:1% B (v/v) from 0 to 1 min, 1%-99% B (v/v) from 1.1 to 10 min, 99%-1% B (v/v) from 10.1 to 12 min [12]. The QE mass spectrometer was used to gain MS/MS spectra based on a simultaneous scan POS and NEG and information dependent acquisition (IDA) triggered the enhanced ion scan (EPI) mode. The conditions of the electro spray ionization source were that the sheath and aux gas flow rate were 45 Arb and 15 Arb, respectively, the capillary temperature was 400 °C, the full MS resolution was 70,000, the MS/MS resolution was 17,500, the collision energy was 20/40/60 eV, and the spray voltage was 4.0 kV in POS or -3.6 kV in NCE. The MS data was evaluated continuously by the acquisition software (Xcalibur 4.0.27, Thermo). The raw data were transformed into mzXML format by ProteoWizard and processed by MAPS software (version 1.0). The pre-processing results generated a data matrix comprising the peak intensity, retention time (RT), and massto-charge ratio (m/z) values. Finally, the compounds were identified by the in-house MS2 database (Shanghai Biotree biotech CO., Ltd., Shanghai, China).
GC–MS assisted derivatization analysis
A 20 ± 1 mg of powder was extracted into 1 mL of solvent (acetonitrile-methanol–water, 2:2:1, 1 μg·mL−1 adonitol as the internal standard, LC–MS grade, ≥ 99%, SIGMA). Samples were treated in the same way as the above method. The 0.2 mL resulting supernatant was dried in a vacuum concentrator (LNG-T98, Huamei, Taichang, China). The residue was added into 80 μL methoxyamination hydrochloride solution (20 g·L−1, dissolved in pyridine, Supelco, Aladdin), incubated at 80 °C for 30 min and derivatized with 100 μL of 1% trifluoroacetamide (≥ 98.0%, Supelco, Aladdin) at 70 °C for 1.5 h.
After cooling, the samples were analyzed with an Agilent 7890-Pegasus HT GC/MS system equipped with an Agilent G4513A automatic injector (Agilent, USA, LECO, USA) and Agilent DB-5MS column (30 m × 250 μm × 0.25 μm). 1 μL aliquot of sample was injected using the splitless mode. The temperatures of injection, transfer line, and ion source were 280 °C, 280 °C, and 250 °C, respectively. The temperature gradient of the oven was that the initial temperature was at 50 °C for 1 min, then rase to 310 °C at a rate of 10 °C per min and maintained for 8 min. The carrier gas was helium, the front inlet purge flow was 3 mL·min−1, and the gas flow rate through the column was 1 mL·min−1. The ionization mode was the electron impact, and the energy was -70 eV. The mass spectrometry data were obtained in full-scan mode with full scanning range of 50–500 min, a rate of 12.5 spectr·s−1 and a solvent delay 6.25 min. Raw data were processed using ChromaTOF software (V4.3xLeco) including peak extraction, baseline adjustment, deconvolution, alignment and integration. The compounds were identified by matching the mass spectrum and retention index in LECO-Fiehn Rtx5 database and the in-house MS2 database (Shanghai Biotree biotech CO., Ltd., Shanghai, China) [31].
HP-SPME-GC/MS analysis
A 2.00 ± 0.01 g of FT powder with 1 μL tritiated naphthalene (2 mg·mL−1, dissolved in dichloromethane, Supelco, Aladdin) as internal standard was transferred into the 20 mL headspace bottle. Volatiles in FT were extracted for 30 min at 60 °C by SPME fiber assembled with DVB/CAR/PDC (divinylbenzene/carboxen/polydimethylsiloxane, 50/30 μm, Supelco, ANPEL Laboratory Technologies (Shanghai) Inc.). The equipment was the same as that described above in GC–MS assisted derivatization analysis. The chromatographic conditions were as follows: column flow of 1 mL·min−1, injection temperature of 250 °C, holding at 40 °C for 2 min, heating up to 250 °C at the rate of 10 °C·min−1 and holding for 6 min, ion source adopting an electron bombardment model with an electron energy of 70 eV, delivery line temperature of 280 °C and ion source temperature of 210 °C, mass spectrometry data in full scan mode with 33–400 atomic mass units in full scan mode with a data acquisition rate of 10 specs·s−1. The compounds were identified by the mass spectrometry data blasting into the MS library of the Wiley library (NY, version 9.0) and National Institute for Standards and Technology (NIST, Search Version 1.6). The identified compounds with the matching scores above 700 were kept for further analysis. Additionally, the compounds were identified again by the retention index. The mixture of C5-C30 n-alkanes was as the mixed standard and analyzed under the same conditions. According to the retention time of each alkane, the retention index of each compound was calculated with the improved Kovats' method [32], then compared with the retention index in the database. All samples were conducted in sextuplicate. At last, the peaks detected in more than half of samples or in samples with RSD (relative standard deviation) < 30% were retained [31].
Identification of DCs and mapping of relevant metabolic pathways
Via SIMCA software (v 14.1, MKS Umetrics AB), an OPLS-DA model was constructed with the quality evaluation score (as Y-axis) and the relative content of the compositions (as X-axis). The DCs between the UAFT and AFT samples were identified depending on the VIP value > 1 and p value < 0.05. The selected DCs were mapped on the metabolic pathways in the KEGG libraries to identify the enriched pathway.
Evaluation of quality
We organized a panel of seven professional assessors, including two females and five males, to evaluate the quality of the samples in strict accordance with the recommended standards of Chinese tobacco industry (YC/T138-1998, YC/T496-2014). There are eight evaluation indicators, including aromatic quality, aromatic intensities, pleasant odor, smoke strength, smoke intensities, softness, aftertaste, and sweetness. The total score of quality evaluation is the sum of the scores of each indicator.
Profiling of microbial diversityDNA extraction and PCR amplification
A 10 ± 0.1 g of each sample mixed with 200 mL sterilized phosphate buffer solution (PBS, 0.1 mol·L−1, pH 7.2) and shocked at 220 rpm, 30 °C for 2 h, sonicated for 5 min and filtered with the sterile absorbent gauze. The result filtrate was centrifuged to collect sediment at 10,000 × g for 10 min. At last, the metagenomic DNA of microflora in FT was extracted with the DNeasy PowerSoil Kit (QIAGEN, Inc., Netherlands) according to the instructions.
After quantitatively and qualitatively analyzed by 1.2% agarose gel electrophoresis, DNA extraction was used as the template for amplification. V4-V5 hypervariable region of the bacteria 16S rRNA gene was amplified with the barcoded universal primers (515F: 5'- GTGCCAGCMGC CGCGGTAA-3', 907R: 5'-CCGTCAATTCMTTTRAGTTT-3'). In addition, the intergenic transcribed spacers of the fungal rRNA gene were amplified with the primer (ITS1F: 5'- CTTG GTCATTTAGAGGAAGTAA-3', ITS2R: 5'-GCTGCGTTCTTCATCGATGC-3'). The polymerase chain reactions were amplificated in 30 µL reactions with 15 µL of Phusion High-Fidelity DNA polymerase (TransGen Biotech, China), 10 ng of DNA template and 0.2 µM of forward and reverse primers [12]. The programs of PCR (Polymerase Chain Reaction) were initial denaturation at 98 °C for 2 min, 30 cycles of denaturation at 98 °C for 15 s, annealing at 55 °C for 30 s, elongation at 72 °C for 30 s, finally extension at 72 °C for 5 min. Subsequently, the amplified products were purified, recovered using magnetic beads (Vazyme VAHTSTM DNA Clean Beads) and quantified by fluorescence with a microplate reader (BioTek, FLx800, USA).
Microbial diversity profiling
An equal amount of the amplicons was sequenced using paired-end 2 × 250 bp on the Illlumina MiSeq platform with MiSeq Reagent Kit V3 (Illumine, USA). The bioinformatics of raw sequence was analyzed with QIIME2 [33]. Simply, the raw sequence data was processed by DADA2 method [34] including depriming, quality filtering, denoising, splicing and chimera removal. Through quality control, each deduplicated sequence with a cluster similarity close to 100% was termed ASV [35]. The taxonomy of ASVs was obtained by blasting against the Silva database (Release 13.8,) for the bacterial 16S rRNA genes and against the UNITE database (Release 8.0, https://unite.ut.ee/) for the fungal ITS1 genes. With the rarefaction method, the sequencing data of each sample was flattened by randomly extracting sequences from each sample to reach a uniform depth for validly predicting the ASVs and their relative abundances. The depth level was set at the 95 percent of the minimum amount of sample sequence.
Microflora function prediction
Based on the sequence of 16S rRNA and ITS, the microflora functions were predicted by PICRUSt2 software package (https://github.com/picrust/picrust2/wiki). Compared to the initial version, PICRUSt2 was improved with a 10 times larger reference genome database and added MetaCyc metabolic pathway (https://metacyc.org/). MetaCyc database is widely used to predict both primary and secondary metabolic pathways as a nonredundant, intensively curated, and comprehensive database, which can be near to the results of macrogenomic data [36].
Correlation analysis between dominant genus and DCs
Using the OPLS-DA model, the top 30 bacterial and top 20 fungal genera based on the relative abundance were selected for the analysis of differential genera Then, the interrelation between differential genera and DCs was further explored using a Spearman's correlation analysis. The well-correlated members (|r|> 0.7 and p < 0.05) were visualized as the positive and negative relationship of associated networks with edge-weighted layouts by Cytoscape (v 3.7.1) software.
Validation of correlation relationships
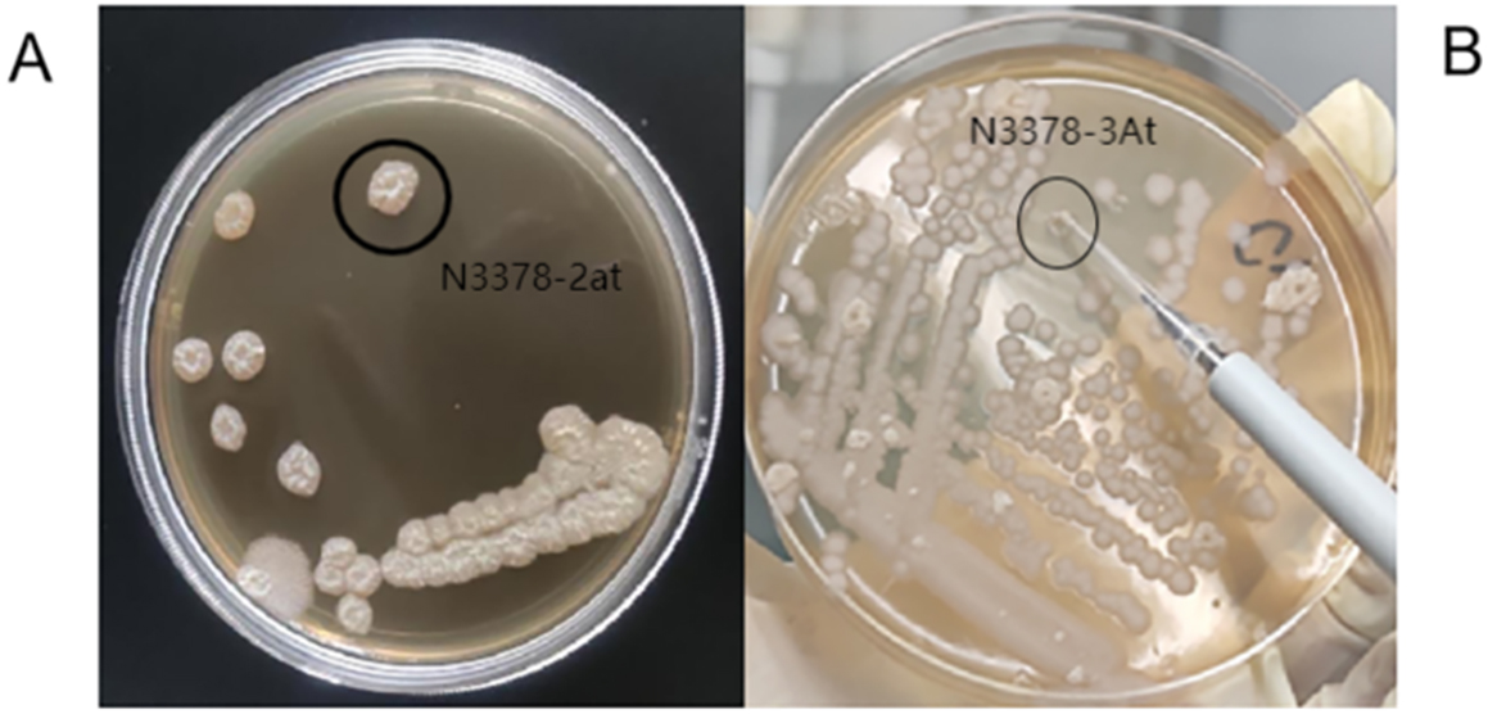
Refer to the previous sorting methods [37], we first sorted single cells of tobacco-microbe from a multi-strain suspension into 96-well plates using flow cytometry (FACSAria III Cell Sorter, BD Biosciences, USA). Briefly, 10 ± 0.1 g of FT sample was added into 200 mL of sterilised phosphate buffer solution (PBS, 0.1 mol/l pH 7.2), shaken and filtered. The result filtrate was centrifuged at 7,000 × g for 10 min. The collected multi-strain suspension was resuspended in the sterile PBS, then filtered by a 40 μm filter and diluted to the required absorbance (OD600 = 0.3). At last, 1 mL of the multi-strain suspension was transferred into a sample cell of flow cytometry. By isolating the mixed strains, single-cells were transferred to 96-well plates filled with Bengal Red (BR) Agar and incubated at 30 °C for 72 h. Filamentous strains were identified by colony morphology and then transferred to 96 deep well plates filled with BR broth and cultured with shaking at 400 rpm for 72–120 h. The BR broth, added with 20% (v/v) FT extract, was a yellowish-brown color which has a strong absorbance at 460 nm by spectrophotometry. Based on the colony and cell morphology of the strains, some strains with mycelium could be presumed to be Aspergillus spp. Strains that could lighten the color of the medium or reduce absorbance were selected out as further research objects, among which the strain named F4 has a high frequency of emergence and the ability to lighten the color of FT extracts.
Colony PCR of strain F4 was performed to amplify the ITS1-5.8S rRNA-ITS2 region with the primers ITS1 (5′-TCCGTAGGTGAACC TGCGG-3′) and ITS4 (5′-TCCTCCGCTTATTGATATGC-3′). The qualified PCR products were sent to Sangon Biotech Co., Ltd. (Shanghai, China) for sequencing. With the help of the Basic Local Alignment and Search Tool (BLAST) algorithm, the sequence from the isolated strains F4 were compared with sequences in NCBI GenBank database (National Center for Biotechnology Information, https://blast.ncbi.nlm.nih.gov/) to identify. The sequence ident between strain F4 and Aspergillus nidulans ATCC 10,074 was 100%.
Then, strain F4 was multiplied in Red Bengal liquid medium with 20% (v/v) FT extract at 30 °C, 220 rpm·min−1 for 72 h. To investigate the role of strain F4, a comparative study was performed with test and control groups. The test group was that the resulting suspension of strain F4 was sprayed onto the surface of FT at 20% (v/w) and cultured at 30 °C, 85% humidity and stirred per four hours. Under the same conditions as the test group, the control group was FT processed with the sterile distilled water. The defective FT, with strong irritation and insufficient aroma, has been treated with the spontaneous aging in the factory for two years, but the quality failed to meet the production requirements, which is commonly found in industrial. At last, FT samples were frozen in liquid nitrogen, collected into sterile polyethylene bags and stored at -80 °C.
In order to further study the function, the enzymatic activity secreted by F4 was measured. The activity of LOX (EC1.13.1.13) was determined using the linoleic acid assay [38]. One unit of LOX activity (U) was defined as an increase of 0.1 of absorbance at 234 nm per minute. The activity of POD (EC 1.11.1.7) was determined by the guaiacol assay [39]. One unit of POD activity (U) was defined as an increase of 0.01 unit of absorbance at 470 nm per minute. The activity of polyphenol oxidase (PPO, EC 1.10.3.1) was measured with the catechol assay [40]. One unit of PPO activity (U) was defined as an increase of 0.01 unit of absorbance at 420 nm per minute. Results were expressed as units per mL of fermented supernatant by strain F4 (U·mL−1).
Statistical analysis
All samples conducted at least in triplicate and data presented as mean ± standard error of the mean (SEM). R software (v 3.6.2) was used to calculate the Spearman's correlation coefficient, p-values, and drew the hot map.


留言 (0)