
記住我


A total of 31.5 and 30.5 million reads on average were obtained from the △abaI and the WT strains using sequencing. The cleaned and aligned ratios were 94%–99% and 97%–99%, respectively (Table 1). The principal component analysis (PCA) (Fig. S1) showed that the △abaI and the WT strains were clustered into two groups based on the gene expression matrix, indicating a good replication of raw data among the samples. After differential expression analysis, 380 DEGs [P-adj < 0.05 and the absolute value of log2(fold change) > log21.5] were identified, including 256 upregulated genes and 124 downregulated genes in the △abaI strain compared with the WT strain (Fig. 1). These DEGs included 65 upregulated genes with fold change (FC) > 2 and 12 downregulated genes with FC < 0.5.
Table 1 Cleaned and aligned status of the raw readsFig. 1
Differentially expressed genes (DEGs) identified in the mutant strain △abaI compared with the wild-type strain. A Expression heatmap of 380 DEGs by hierarchical clustering, with red representing the relatively higher level of expression and blue representing the relatively lower level of expression. B Volcano plot of DEGs with 256 upregulated genes (red dot) and 124 downregulated genes (blue dot). The black dots refer to the genes with no significant expression change. The top five up- and downregulated DEGs are marked in the plot
Clusters of orthologous groups functional classificationThe DEGs were annotated and clustered into the Clusters of Orthologous Groups (COG) functional categories through ortholog alignment of the amino acid sequence to the COG database (Fig. 2). Among the DEGs, 12.7% were classified into [E] amino acid transport and metabolism, 10.1% into [I] lipid transport and metabolism, 9.9% into [K] transcription, 7.3% into [P] inorganic ion transport and metabolism, 7.0% into [J] translation, ribosomal structure, and biogenesis, 6.8% into [R] general function prediction only, and 5.9% into [G] carbohydrate transport and metabolism with gene number more than 20.
Fig. 2
Clusters of Orthologous Groups (COG) enrichment of DEGs, which were divided into functional categories by alignment to the latest COG database
Gene ontology analysisAfter Gene Ontology analysis, the DEGs were annotated and enriched into three physiological function categories: biological process, cellular component, and molecular function (Fig. 3A). In biological process, the mainly enriched functional categories comprised organic acid metabolic process, aromatic compound catabolic process, cellular catabolic process, and pyrimidine ribonucleotide biosynthetic and metabolic process. In cellular component, the mainly enriched functional categories were intrinsic component of membrane, extracellular region, and external encapsulating structure. In molecular function, the mainly enriched functional categories were CoA-transferase activity, ligase activity forming carbon-sulfur bonds, and transmembrane transporter activity for anions and organic acids.
Fig. 3
GO and KEGG enrichment of DEGs. A Top eight GO enrichment terms in each ontology group included biological process, cellular component, and molecular function. The P-adjusted value of each term is shown as a color gradient. B Top 20 KEGG pathways of DEGs with fold enrichment (GeneRatio/BgRatio) on the x-axis. The number of genes enriched in each KEGG pathway is shown as the size of the dot, and the P-adjusted value is shown as a color gradient of the dot
Kyoto encyclopedia of genes and genomes pathway enrichmentKyoto Encyclopedia of Genes and Genomes (KEGG) is a general and abundant database meant for the biological interpretation of genes and genomes. The KEGG enrichment was analyzed based on the alignment of query amino acid sequences to the KO database to investigate the effect of QS on the molecular interaction network and pathway in A. baumannii. The DEGs were mainly involved in the pathways related to amino acid metabolism, biofilm formation, fatty acid metabolism, secretion system, two-component system, and purine metabolism (Fig. 3B).
Amino acid metabolismIn amino acid metabolism pathways, the partial DEGs were involved in metabolizing phenylalanine, arginine, cysteine, methionine, alanine, aspartate, glutamate, valine, leucine, and isoleucine. The phenylalanine metabolism was associated with bacterial growth and virulence [17,18,19]. In the △abaI strain, the upregulated DEGs involved in this pathway included the FQU82_00157, FQU82_00183, FQU82_02324, FQU82_01642(paaF), FQU82_02187, FQU82_01589(paaK), FQU82_01581(paaB), FQU82_01580(paaA), and FQU82_01583(paaD), while FQU82_02901 was found to be downregulated.
Among the DEGs involved in the arginine biosynthesis, FQU82_00067 and FQU82_01752 were upregulated, whereas FQU82_01177, FQU82_02901, FQU82_01050 (ureC), FQU82_01049 (ureB), and FQU82_01048 (ureA) were downregulated. Arginine was one of the common amino acids required for protein synthesis in bacteria, constituting about 5% of the total proteins of Escherichia coli [20, 21].
Valine, leucine, and isoleucine were branched-chain amino acids related to the growth and virulence of the bacteria [22, 23]. Nine DEGs were enriched in the degradation of valine, leucine, and isoleucine, and all of them were upregulated.
Biofilm formationThe DEGs enriched in the biofilm formation pathway comprised nine downregulated genes: FQU82_01545 (tagF), FQU82_01550 (tssK), FQU82_015379 (tssB), FQU82_01549 (tssA), FQU82_01538 (tssC), FQU82_01544 (tssM), FQU82_01548 (tssH), FQU82_01539 (hcp), and FQU82_01542 (tssG). These genes were also associated with the type VI secretion system.
Secretion systemIn this study, 16 downregulated DEGs were found to be enriched in the secretion system pathway. Among these genes, 14 were involved in the type VI secretion system: FQU82_01545 (tagF), FQU82_01550 (tssK), FQU82_01537 (tssB), FQU82_01549 (tssA), FQU82_01538 (tssC), FQU82_01544 (tssM), FQU82_01548 (tssH), FQU82_03692 (vgrG2a), FQU82_01551 (tssL), FQU82_01540 (tssE), FQU82_01539 (hcp), FQU82_00952 (vgrG2b), FQU82_01541 (tssF), and FQU82_01542 (tssG). FQU82_00545 (tatB) was involved in the twin-arginine translocation system, and FQU82_01811 was involved in the type 1 pilus assembly.
The two-component systemThe upregulated DEGs were found to be enriched in the two-component system, including FQU82_00307 (pilS), FQU82_01779, FQU82_02017, FQU82_01778, FQU82_01780, FQU82_01752, FQU82_02461 (kdpA), and FQU82_02460 (kdpB). The downregulated DEGs in this pathway included FQU82_02258 (cydA), FQU82_02259 (cydB), FQU82_02260 (cydX), FQU82_02840, and FQU82_02515. Among these genes, FQU82_00307(pilS) was a sensor histidine kinase of the PilS/PilR system, which was associated with the type-4 fimbriae synthesis contributing to bacterial motility [24, 25].
Propanoate and purine metabolismPropanoate and purine metabolism are both critical metabolic pathways related to growth and virulence in bacteria [26, 27]. In this study, 10 upregulated DEGs were found to be enriched in the propanoate metabolism: FQU82_00191, FQU82_00562, FQU82_03635, FQU82_01642 (paaF), FQU82_00192, FQU82_00189 (mmsA), FQU82_00193, FQU82_00159 (prpB), FQU82_00160 (prpC), and FQU82_00161 (acnD). In purine metabolism, 8 DEGs were downregulated, including FQU82_00576 (ndk), FQU82_02944 (purL), FQU82_02508 (purH), FQU82_02833 (purB), FQU82_00036, FQU82_01050 (ureC), FQU82_01048 (ureA), and FQU82_01049, and 2 were upregulated, including FQU82_02113 and FQU82_00719. A key gene in purine metabolism FQU82_00576 (ndk), encoding an evolutionarily conserved NTP-generating kinase, was vital for nucleic acid biosynthesis [27].
Gene set enrichment analysisGene set enrichment analysis (GSEA) is a bioinformatics tool for interpreting genome-wide expression profiles at the level of gene sets [28]. The GSEA analysis was conducted to determine the general expression trend of enriched pathways in the KEGG analysis. The results showed that the genes enriched in the phenylalanine metabolism and propanoate metabolism were concentrated at the top of the ordered gene expression set. The normalized enrichment scores (NESs) were 2.18 and 2.01, respectively, with FDR < 0.001 (Fig. 4E and F), indicating that the whole gene sets in these pathways were upregulated in general. However, the genes enriched in the arginine biosynthesis, purine metabolism, bacterial secretion system, and biofilm formation were distributed at the bottom of the ordered gene expression profile (NES = –1.70, –1.81, –1.99, and –2.31, respectively, FDR < 0.05) (Fig. 4A–D), indicating that the whole gene sets in these pathways were downregulated in general.
Fig. 4
Gene set enrichment analysis of the KEGG pathways based on the ordered gene expression profile in general. A–F Enrichment plot of the arginine biosynthesis, purine metabolism, bacterial secretion system, biofilm formation, phenylalanine metabolism, and propanoate metabolism
Validation of RNA sequencingA total of 15 genes were subjected to reverse transcription quantitative polymerase chain reaction (RT-qPCR), including 10 genes selected from the top up- and downregulated DEGs and another 5 DEGs, to confirm the reliability of RNA sequencing and transcriptomic analysis (Fig. 5). The expression trend of these genes was consistent in RT-qPCR and RNA sequencing, indicating the reliability of the expression data by RNA sequencing. The disparity between RNA-seq and RT-qPCR was possibly attributed to the small sample number, RNA degradation, and low expression level of genes.
Fig. 5
Validation of RNA sequencing using the real-time qPCR. Four individual biological replicates were performed in triplicates. The data represented the means ± standard deviation of the results
Antibiotic resistance profile and biofilm formationThe minimum inhibitory concentrations (MICs) of 16 commonly used antibiotics were detected to determine whether the deletion of abaI changed the antibiotic resistance. The results showed that the mutant strain △abaI was more resistant to cefepime compared with the WT strain with a slightly increased MIC. The interpretive category of MIC results turned to intermediate (I) from susceptible (S) after abaI deletion. However, the MIC of amikacin decreased following the deletion of abaI, with no change in the interpretation of the susceptibility to this drug (Table 2).
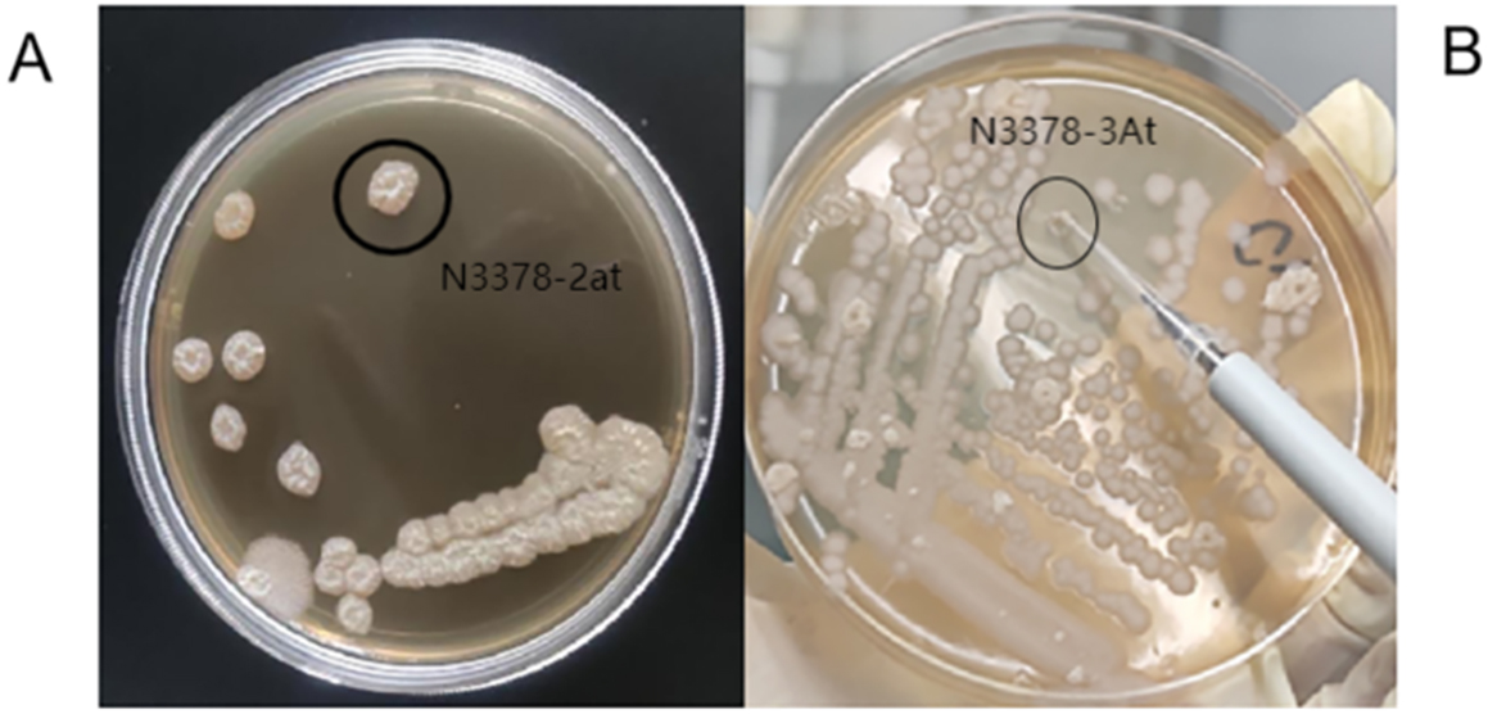
Table 2 Antibiotic resistance profile of the strain usedWith respect to biofilm formation, crystal violet (CV) staining showed that the biofilm formation ability decreased following the deletion of abaI, which was consistent with the expression change of the DEGs. As shown in Fig. 6, the stained biofilm of the WT strain presented an obvious purple circle, while the stained area of the △abaI strain was fragmented after an incubation time of 24 h. The absorbance of CV solution also decreased significantly in the △abaI strain compared with the WT strain.
Fig. 6
Biofilm formation assay of wild-type (WT) and mutant (△abaI) strains. A and B Image of the biofilm of WT and △abaI strains stained using CV staining in a 96-well plate after 24-h incubation at 37℃ (original magnification × 40). C Absorbance of CV solution at 550 nm between WT and △abaI strains. Six individual biological replicates were performed in quadruplicates, and the data were represented as the means ± standard deviation of the results. *P < 0.05
留言 (0)